Houses for sale & to rent in Harlech, Harlech
House Prices in Harlech
Properties in Harlech have an average house price of £192,198.00 and had 108 Property Transactions within the last 3 years¹.
Harlech is an area in Harlech, Gwynedd - Gwynedd with 691 households², where the most expensive property was sold for £650,500.00.
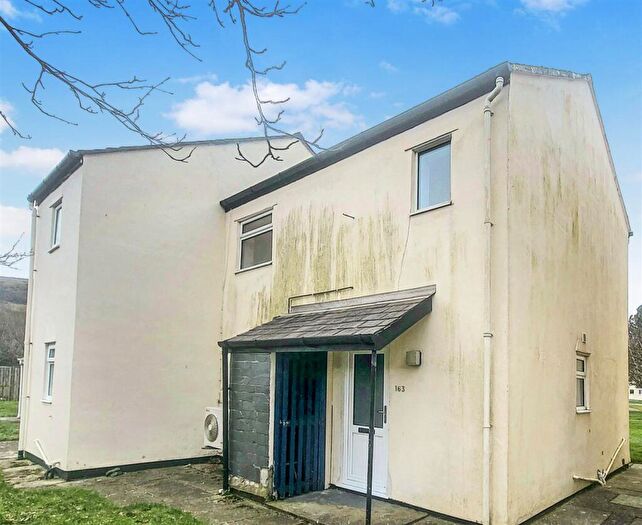
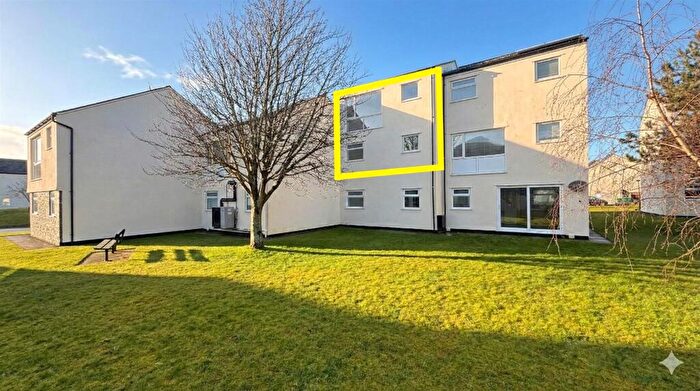
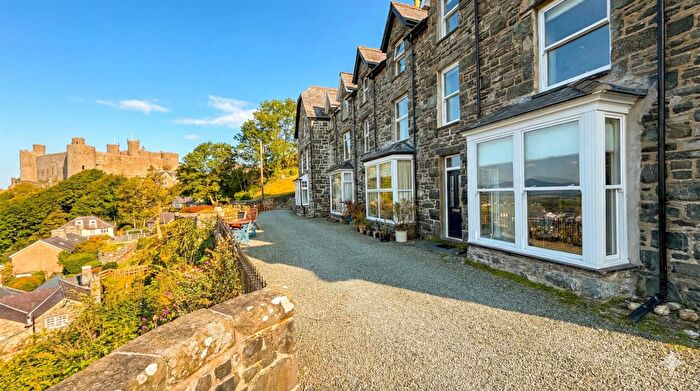
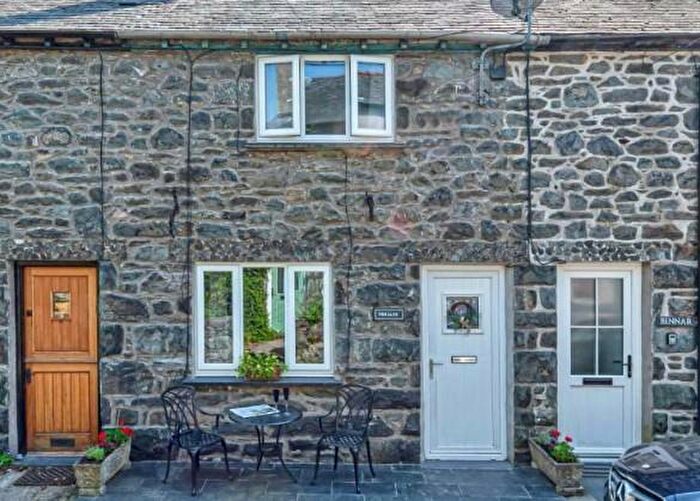
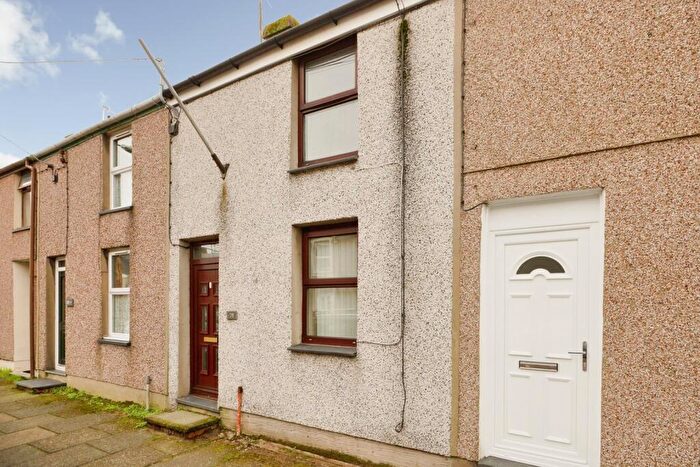
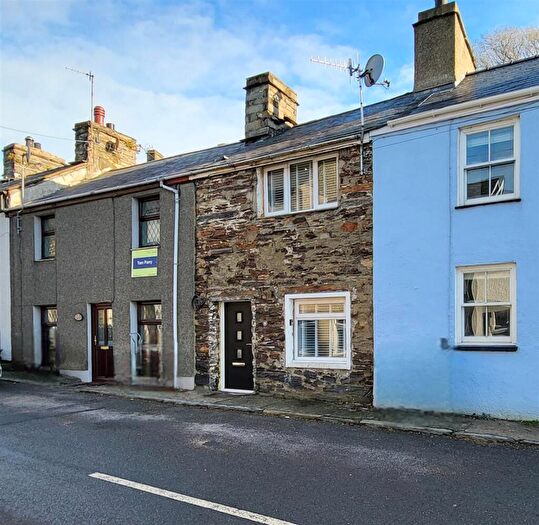
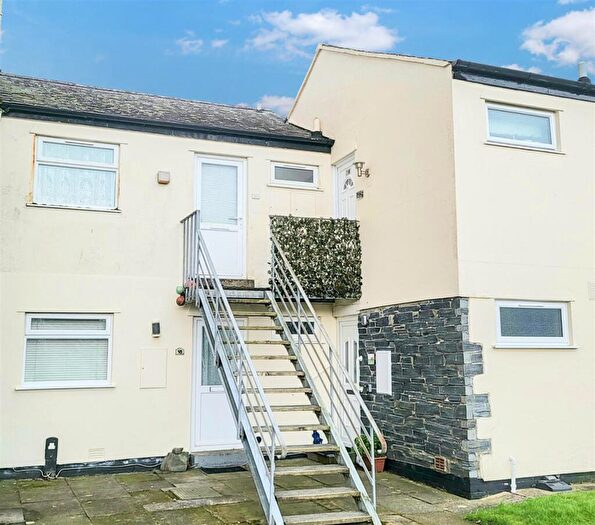
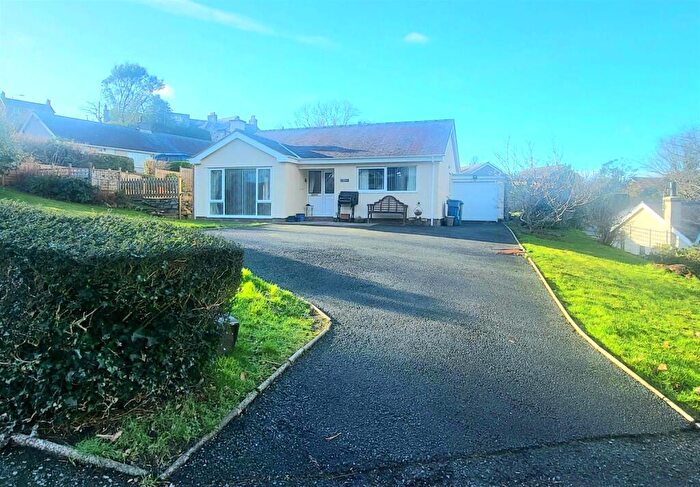
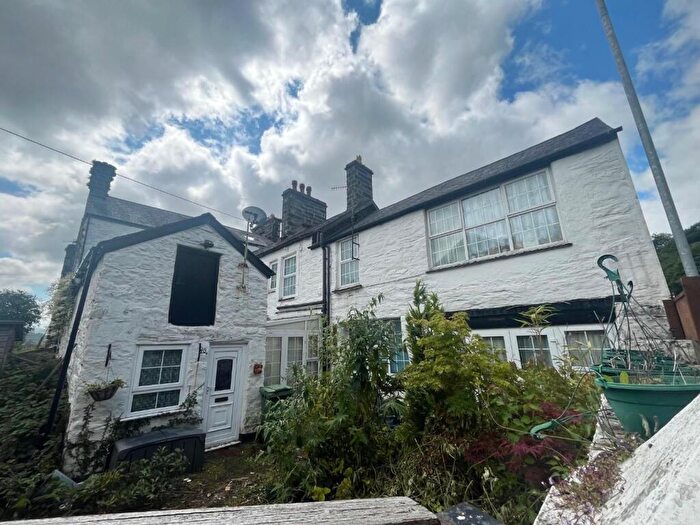
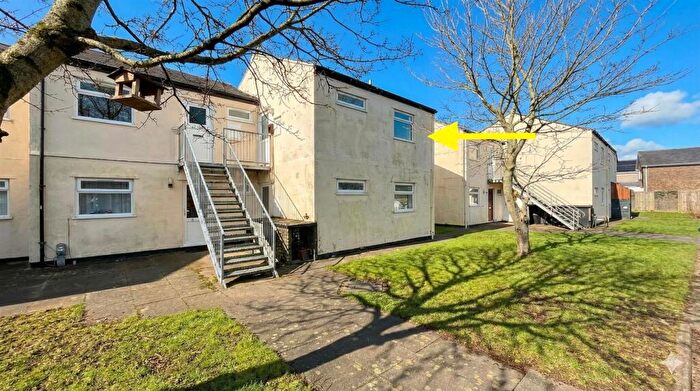
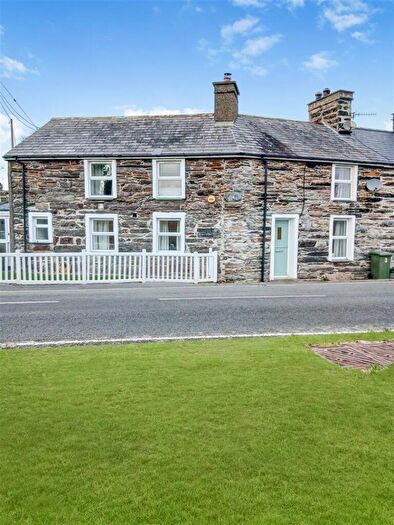
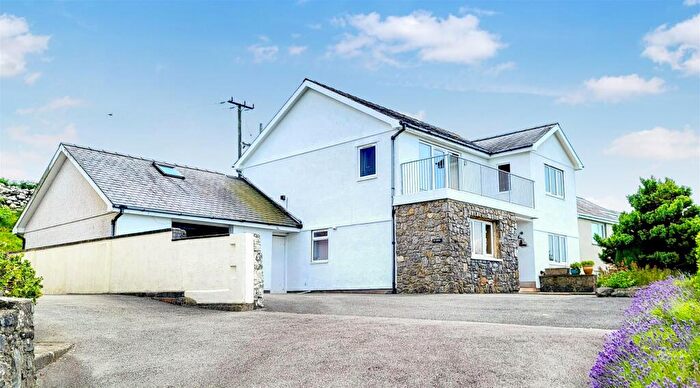
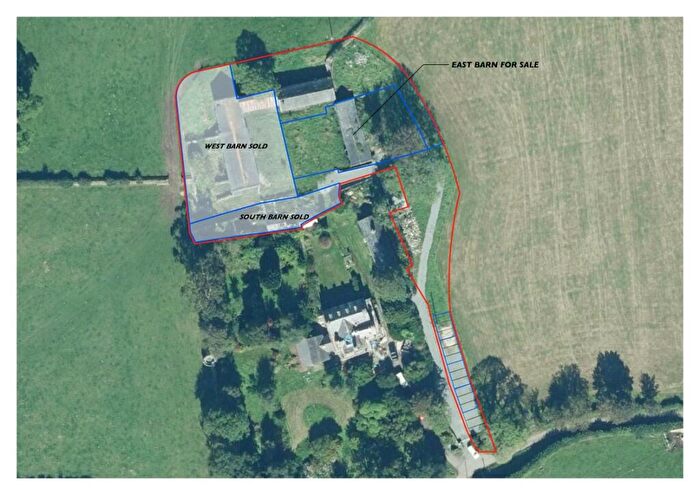
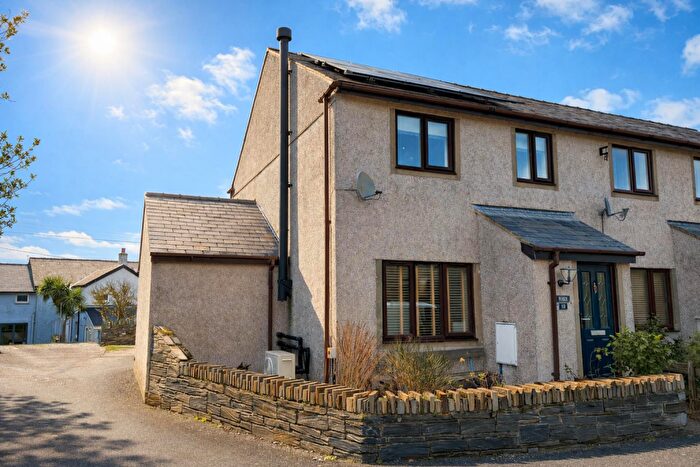
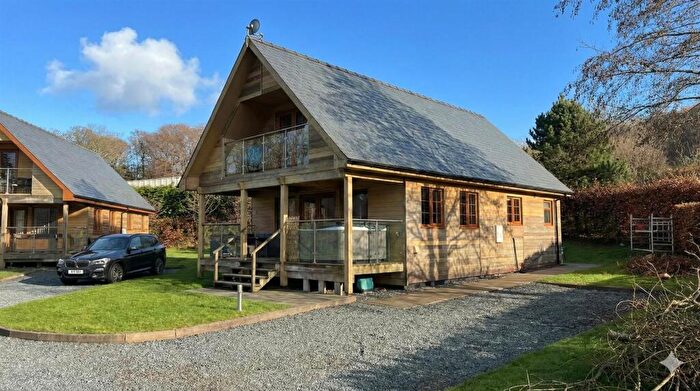
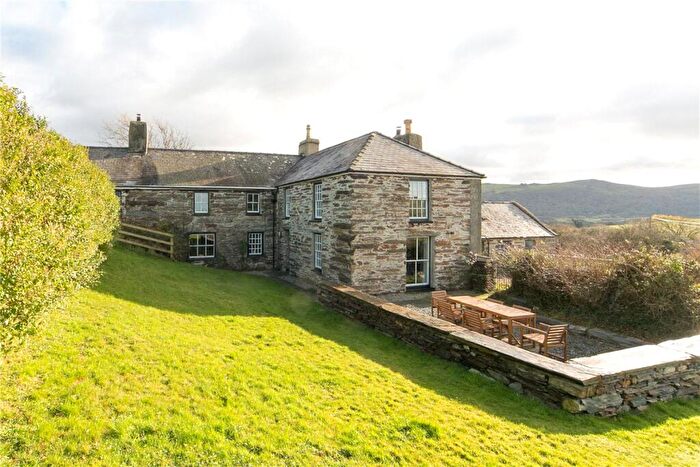
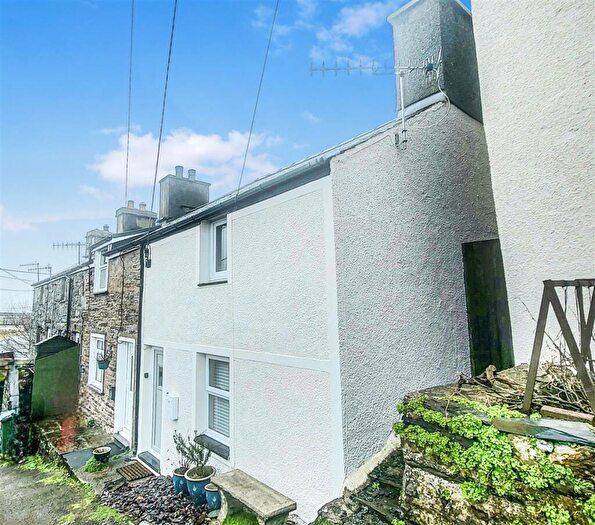
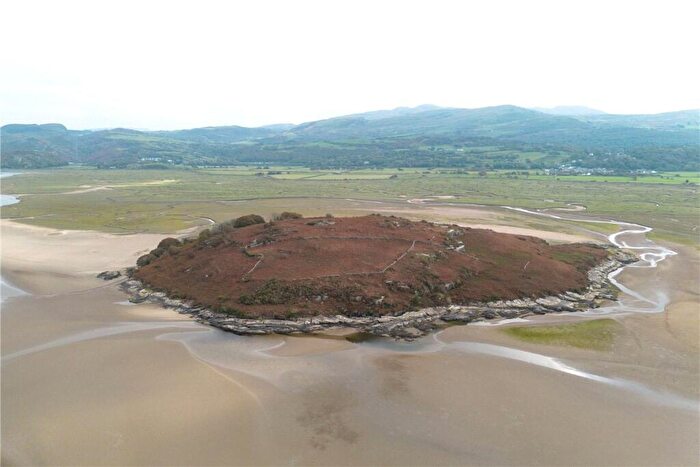
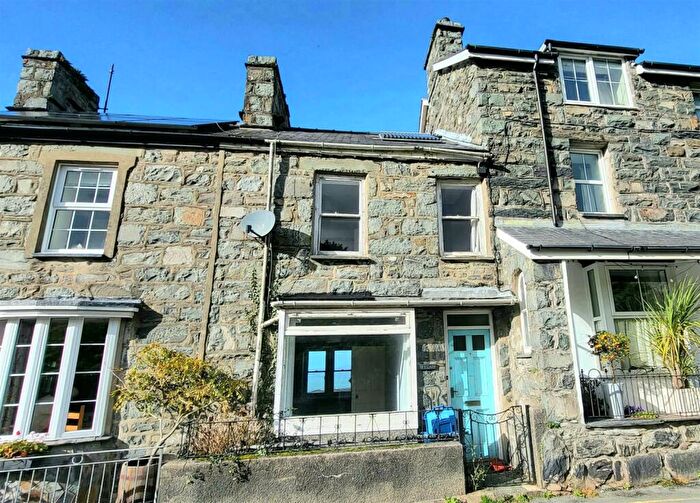
Properties for sale in Harlech
Roads and Postcodes in Harlech
Navigate through our locations to find the location of your next house in Harlech, Harlech for sale or to rent.
| Streets | Postcodes |
|---|---|
| Ael Y Glyn | LL46 2UJ |
| Beach Road | LL46 2UG |
| Bron Y Graig | LL46 2SR |
| Bronwen Terrace | LL46 2YS |
| Cae Gwastad | LL46 2GY |
| Cae Main | LL46 2UP |
| Castle Square | LL46 2YH |
| Ffordd Gwylan Bach | LL46 2GZ |
| Ffordd Isaf | LL46 2PR |
| Ffordd Ty Canol | LL46 2GS |
| Glan Gors | LL46 2NJ LL46 2NX LL46 2SQ |
| Grogan Terrace | LL46 2YF |
| Heol Y Bryn | LL46 2TU |
| High Street | LL46 2YA LL46 2YB LL46 2YD LL46 2YE |
| Hwylfa R Nant Road | LL46 2AB |
| Llys Bach | LL46 2GX |
| Moreia Terrace | LL46 2YW |
| Old Llanfair Road | LL46 2SS LL46 2SX |
| Pant Mawr Estate | LL46 2ST |
| Pentrer Efail | LL46 2YG |
| Penybryn Estate | LL46 2SL |
| Penyrhwylfa | LL46 2UW |
| Porkington Terrace | LL46 2SH |
| Rock Terrace | LL46 2SP |
| St Davids Hill | LL46 2PU |
| Tryfer Terrace | LL46 2YR |
| Ty Canol | LL46 2NZ |
| Y Llech | LL46 2YL |
| Y Waun | LL46 2UN |
| Ystad Castell Morfa | LL46 2GA |
| LL46 2PY LL46 2RA LL46 2SG LL46 2SN LL46 2SW LL46 2TS LL46 2UA LL46 2UB LL46 2UD LL46 2UE LL46 2UF LL46 2UL LL46 2UR LL46 2UT LL46 2UU LL46 2YT LL41 4HY LL46 2AA LL46 2PS LL46 2TP LL46 2TR LL46 2TT LL46 2UH LL46 2US LL46 2WA LL46 2YN LL46 2YP |
Transport near Harlech
- FAQ
- Price Paid By Year
- Property Type Price
Frequently asked questions about Harlech
What is the average price for a property for sale in Harlech?
The average price for a property for sale in Harlech is £192,198. This amount is 5% lower than the average price in Harlech. There are 408 property listings for sale in Harlech.
What streets have the most expensive properties for sale in Harlech?
The streets with the most expensive properties for sale in Harlech are Beach Road at an average of £390,000, Heol Y Bryn at an average of £361,000 and Y Llech at an average of £330,000.
What streets have the most affordable properties for sale in Harlech?
The streets with the most affordable properties for sale in Harlech are Glan Gors at an average of £78,141, Rock Terrace at an average of £165,000 and Tryfer Terrace at an average of £170,983.
Which train stations are available in or near Harlech?
Some of the train stations available in or near Harlech are Harlech, Llandanwg and Pensarn.
Property Price Paid in Harlech by Year
The average sold property price by year was:
| Year | Average Sold Price | Price Change |
Sold Properties
|
|---|---|---|---|
| 2025 | £187,051 | -7% |
35 Properties |
| 2024 | £200,302 | 6% |
41 Properties |
| 2023 | £187,445 | -37% |
32 Properties |
| 2022 | £256,263 | 18% |
32 Properties |
| 2021 | £211,202 | 8% |
42 Properties |
| 2020 | £194,974 | 1% |
34 Properties |
| 2019 | £193,471 | 13% |
44 Properties |
| 2018 | £169,165 | 6% |
36 Properties |
| 2017 | £158,915 | 8% |
43 Properties |
| 2016 | £145,690 | -17% |
43 Properties |
| 2015 | £170,592 | 12% |
35 Properties |
| 2014 | £150,627 | -14% |
35 Properties |
| 2013 | £171,096 | 20% |
27 Properties |
| 2012 | £136,910 | 1% |
28 Properties |
| 2011 | £135,270 | -11% |
31 Properties |
| 2010 | £149,595 | -7% |
21 Properties |
| 2009 | £159,332 | 26% |
23 Properties |
| 2008 | £118,620 | -45% |
25 Properties |
| 2007 | £172,025 | 19% |
43 Properties |
| 2006 | £138,932 | -1% |
57 Properties |
| 2005 | £140,455 | 12% |
38 Properties |
| 2004 | £122,999 | 21% |
43 Properties |
| 2003 | £96,589 | 23% |
48 Properties |
| 2002 | £74,008 | 32% |
61 Properties |
| 2001 | £50,271 | -16% |
45 Properties |
| 2000 | £58,160 | 12% |
64 Properties |
| 1999 | £51,213 | -3% |
49 Properties |
| 1998 | £52,916 | 6% |
46 Properties |
| 1997 | £49,642 | 11% |
39 Properties |
| 1996 | £44,338 | -7% |
34 Properties |
| 1995 | £47,606 | - |
33 Properties |
Property Price per Property Type in Harlech
Here you can find historic sold price data in order to help with your property search.
The average Property Paid Price for specific property types in the last three years are:
| Property Type | Average Sold Price | Sold Properties |
|---|---|---|
| Semi Detached House | £216,916.00 | 9 Semi Detached Houses |
| Detached House | £336,448.00 | 30 Detached Houses |
| Terraced House | £182,643.00 | 33 Terraced Houses |
| Flat | £74,569.00 | 36 Flats |

