Houses for sale & to rent in Llanbedr, Llanbedr
House Prices in Llanbedr
Properties in Llanbedr have an average house price of £227,698.00 and had 23 Property Transactions within the last 3 years¹.
Llanbedr is an area in Llanbedr, Gwynedd - Gwynedd with 313 households², where the most expensive property was sold for £350,000.00.
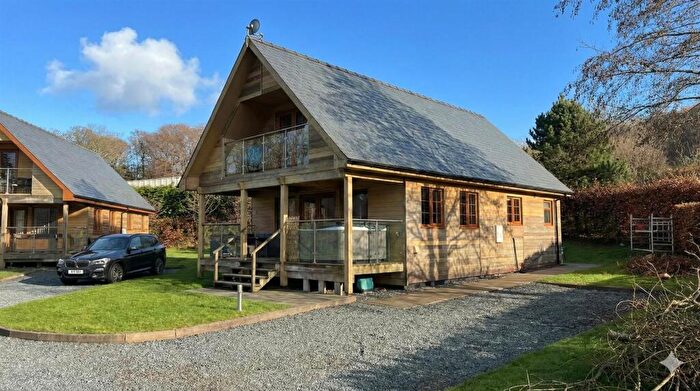
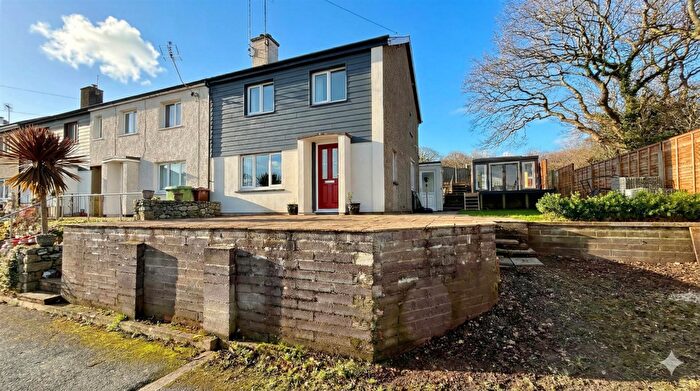
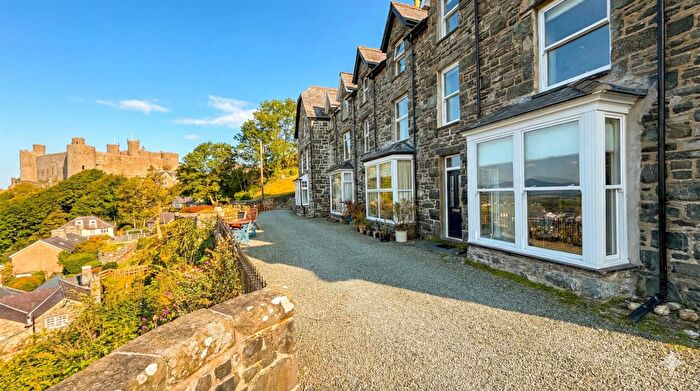
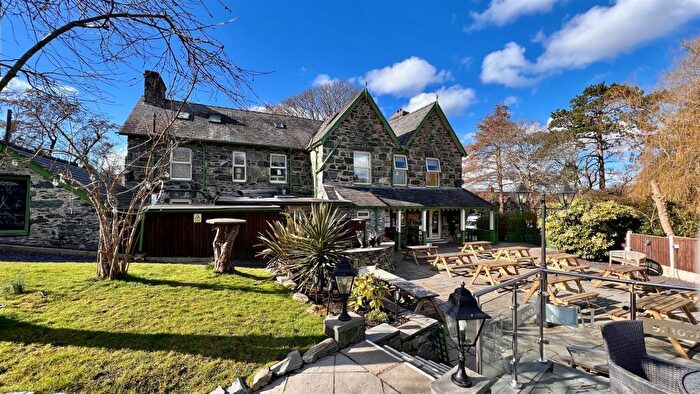
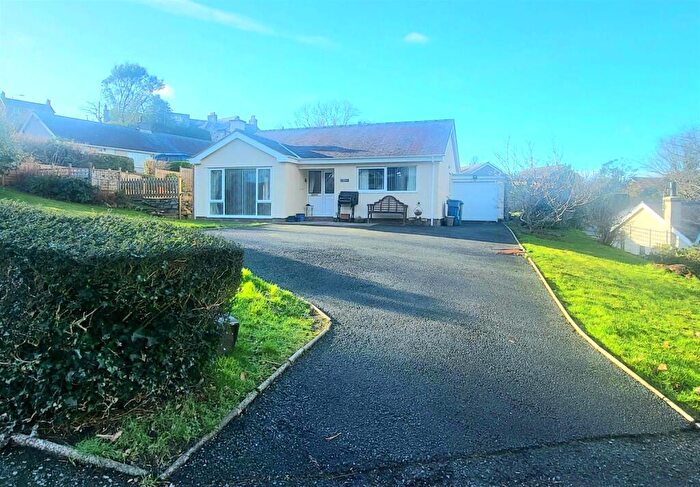
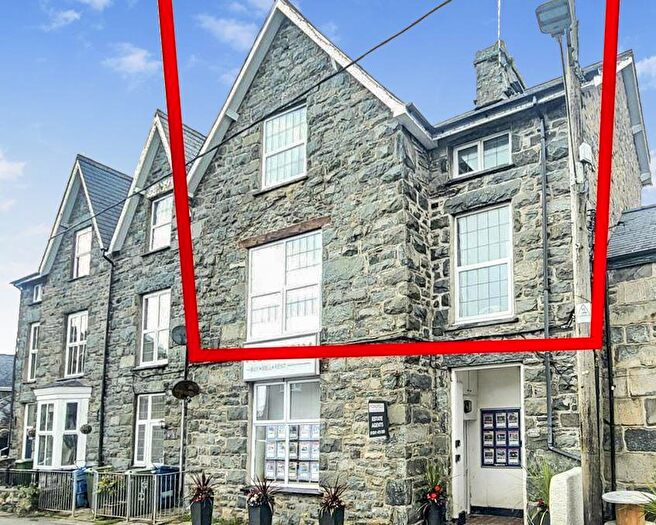
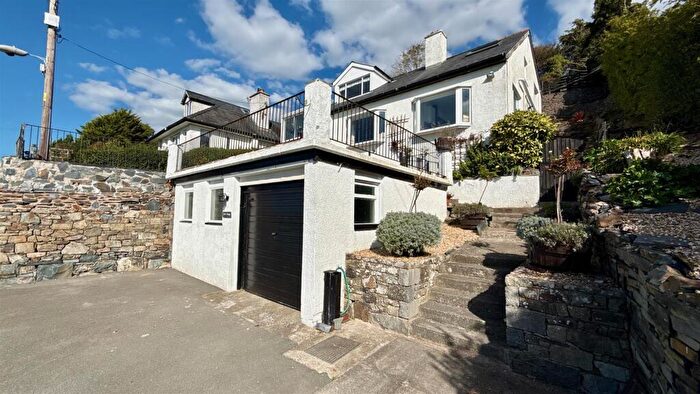
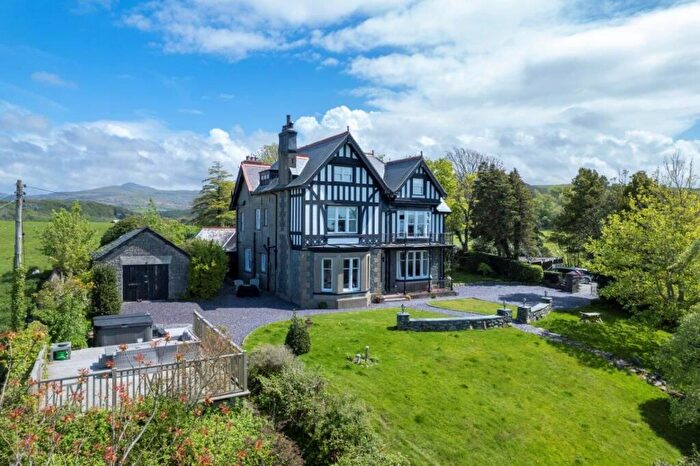
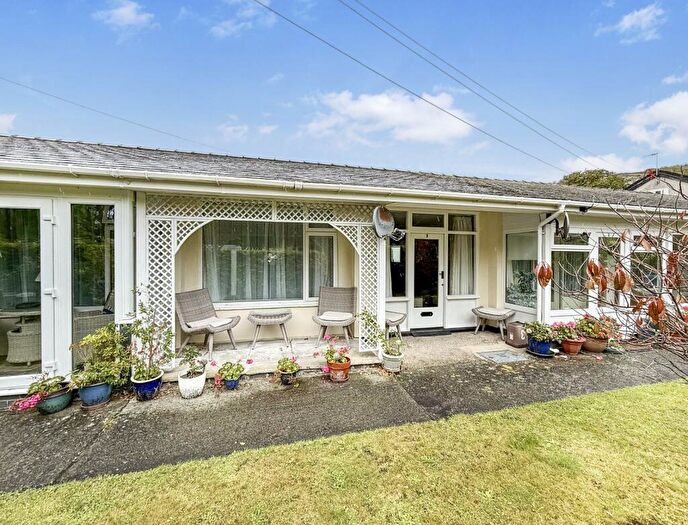
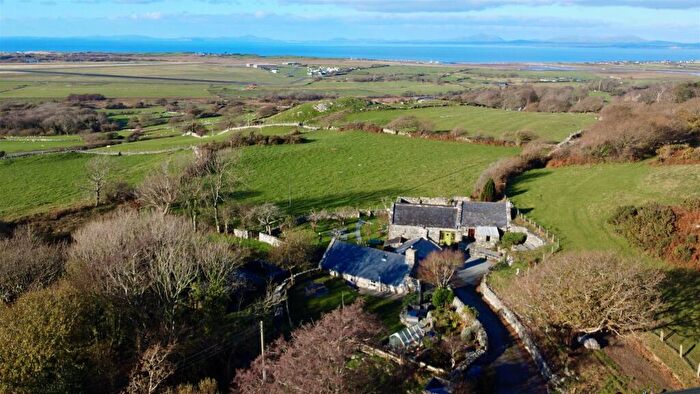
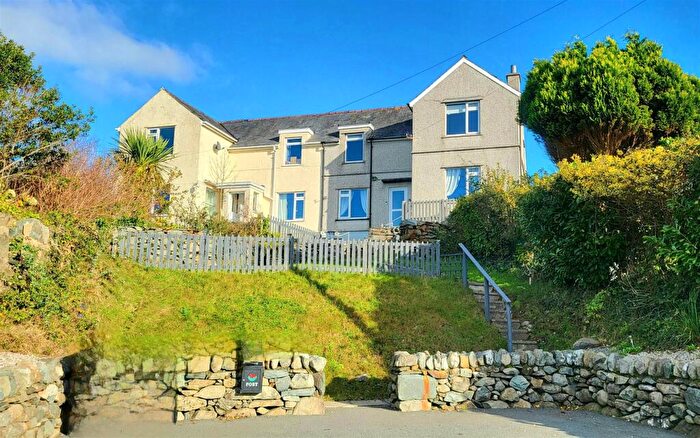
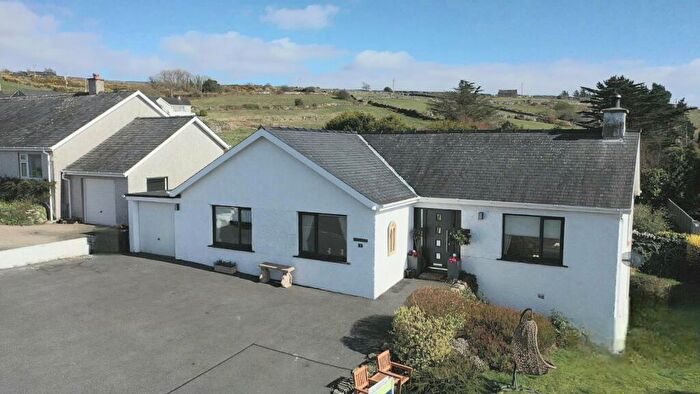
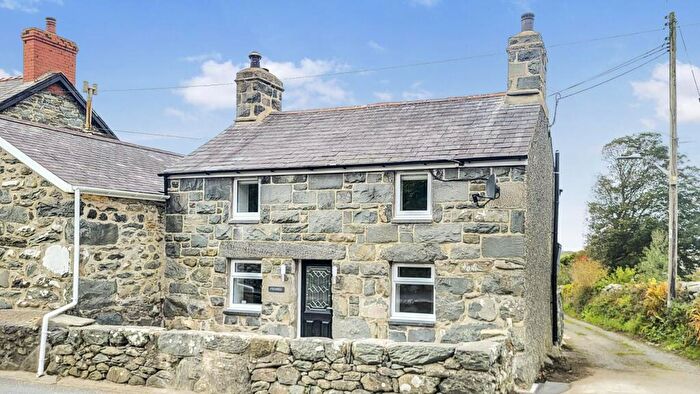
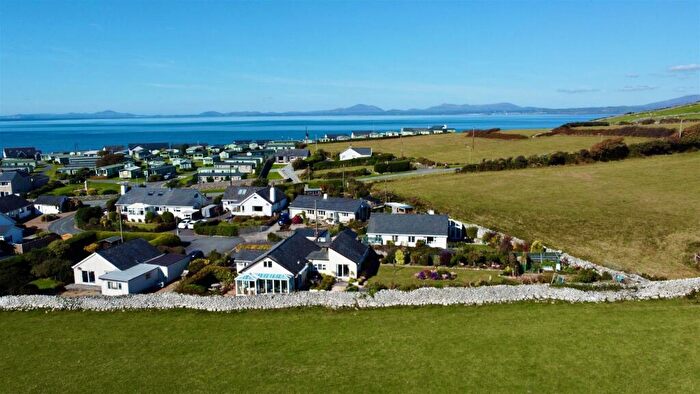
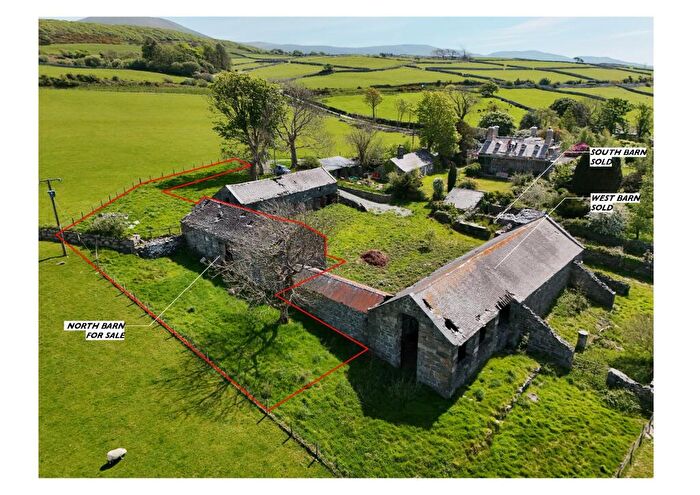
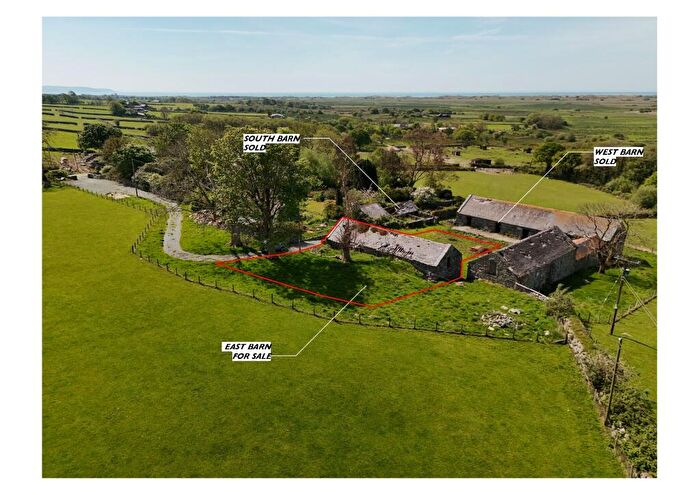
Properties for sale in Llanbedr
Roads and Postcodes in Llanbedr
Navigate through our locations to find the location of your next house in Llanbedr, Llanbedr for sale or to rent.
| Streets | Postcodes |
|---|---|
| Bryn Deiliog | LL45 2LF |
| Coed Artro | LL45 2LA |
| Glandwr Cottages | LL45 2PB |
| Moelfre Terrace | LL45 2DQ |
| Plas Newydd | LL45 2AA |
| Riverside Bungalows | LL45 2NW |
| Ystad Y Wenallt | LL45 2PD |
| LL45 2DJ LL45 2DZ LL45 2HH LL45 2HL LL45 2HN LL45 2HP LL45 2HR LL45 2HS LL45 2HW LL45 2LE LL45 2LG LL45 2LH LL45 2LP LL45 2LR LL45 2LW LL45 2LY LL45 2NA LL45 2ND LL45 2NH LL45 2NN LL45 2NT LL45 2PA LL45 2PE LL45 2PL LL45 2PZ LL45 2DX LL45 2EQ LL45 2EZ LL45 2HT LL45 2HU LL45 2LD LL45 2LL LL45 2LU LL45 2NB LL45 2NL LL45 2NP LL45 2NR LL45 2NS LL45 2NU LL45 2NY LL45 2PF LL45 2PG LL45 2PH LL45 2PJ LL45 2PX |
Transport near Llanbedr
- FAQ
- Price Paid By Year
- Property Type Price
Frequently asked questions about Llanbedr
What is the average price for a property for sale in Llanbedr?
The average price for a property for sale in Llanbedr is £227,698. There are 104 property listings for sale in Llanbedr.
What streets have the most expensive properties for sale in Llanbedr?
The streets with the most expensive properties for sale in Llanbedr are Ystad Y Wenallt at an average of £285,000 and Plas Newydd at an average of £277,666.
What streets have the most affordable properties for sale in Llanbedr?
The street with the most affordable properties for sale in Llanbedr is Glandwr Cottages at an average of £180,000.
Which train stations are available in or near Llanbedr?
Some of the train stations available in or near Llanbedr are Llanbedr, Pensarn and Llandanwg.
Property Price Paid in Llanbedr by Year
The average sold property price by year was:
| Year | Average Sold Price | Price Change |
Sold Properties
|
|---|---|---|---|
| 2025 | £227,957 | 7% |
7 Properties |
| 2024 | £211,261 | -25% |
11 Properties |
| 2023 | £263,500 | -24% |
5 Properties |
| 2022 | £326,307 | 39% |
13 Properties |
| 2021 | £199,969 | -15% |
23 Properties |
| 2020 | £228,988 | -10% |
18 Properties |
| 2019 | £250,812 | 26% |
8 Properties |
| 2018 | £185,058 | 8% |
12 Properties |
| 2017 | £170,927 | 1% |
11 Properties |
| 2016 | £169,571 | -6% |
7 Properties |
| 2015 | £179,991 | -19% |
6 Properties |
| 2014 | £213,750 | 28% |
4 Properties |
| 2013 | £153,500 | -13% |
2 Properties |
| 2012 | £174,071 | 12% |
7 Properties |
| 2011 | £152,916 | 5% |
6 Properties |
| 2010 | £144,954 | -15% |
11 Properties |
| 2009 | £167,136 | -7% |
11 Properties |
| 2008 | £178,278 | 7% |
7 Properties |
| 2007 | £166,071 | -33% |
7 Properties |
| 2006 | £220,995 | 0,1% |
10 Properties |
| 2005 | £220,833 | -5% |
9 Properties |
| 2004 | £232,571 | 42% |
7 Properties |
| 2003 | £135,086 | 36% |
11 Properties |
| 2002 | £86,652 | -9% |
11 Properties |
| 2001 | £94,535 | 26% |
14 Properties |
| 2000 | £70,046 | -4% |
12 Properties |
| 1999 | £72,562 | 8% |
8 Properties |
| 1998 | £66,428 | 1% |
7 Properties |
| 1997 | £65,472 | 31% |
18 Properties |
| 1996 | £44,990 | -37% |
6 Properties |
| 1995 | £61,625 | - |
4 Properties |
Property Price per Property Type in Llanbedr
Here you can find historic sold price data in order to help with your property search.
The average Property Paid Price for specific property types in the last three years are:
| Property Type | Average Sold Price | Sold Properties |
|---|---|---|
| Semi Detached House | £257,600.00 | 5 Semi Detached Houses |
| Detached House | £225,124.00 | 11 Detached Houses |
| Terraced House | £218,783.00 | 6 Terraced Houses |
| Flat | £160,000.00 | 1 Flat |

