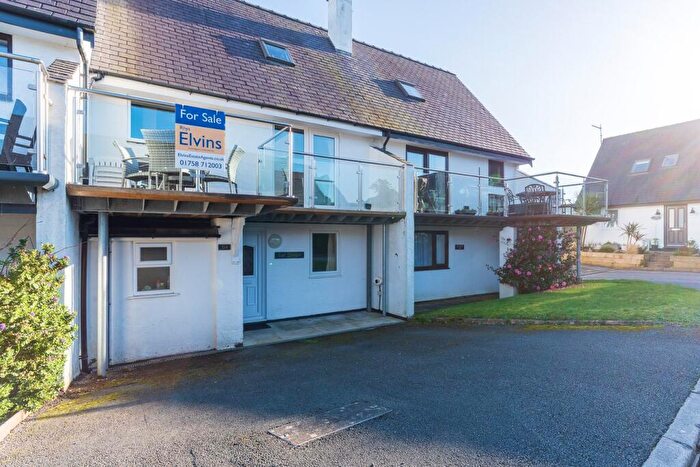
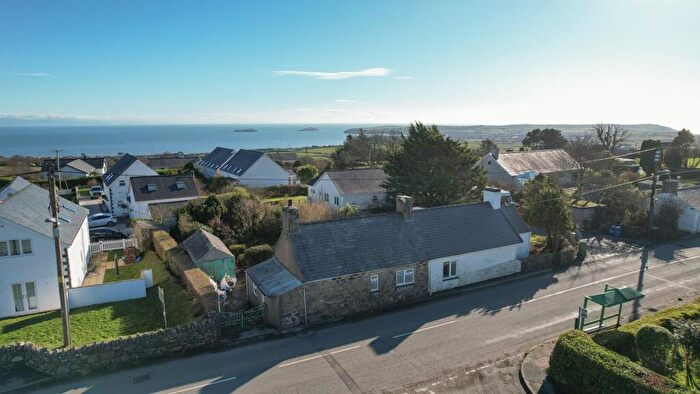
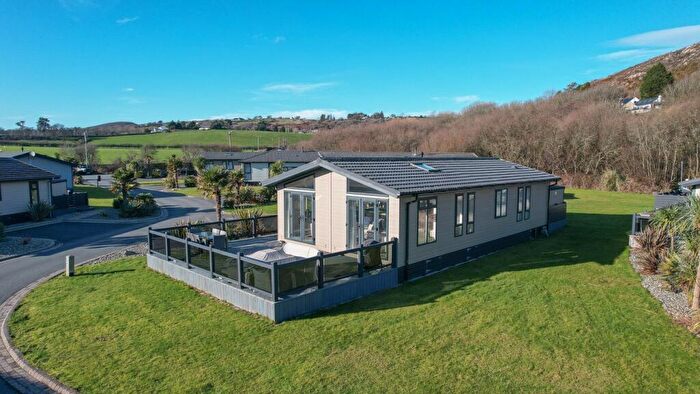
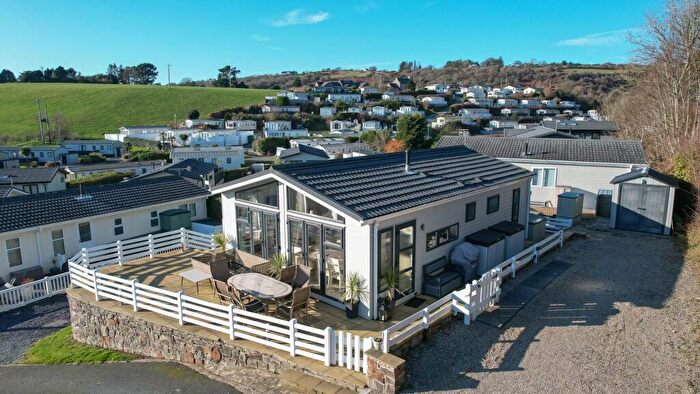
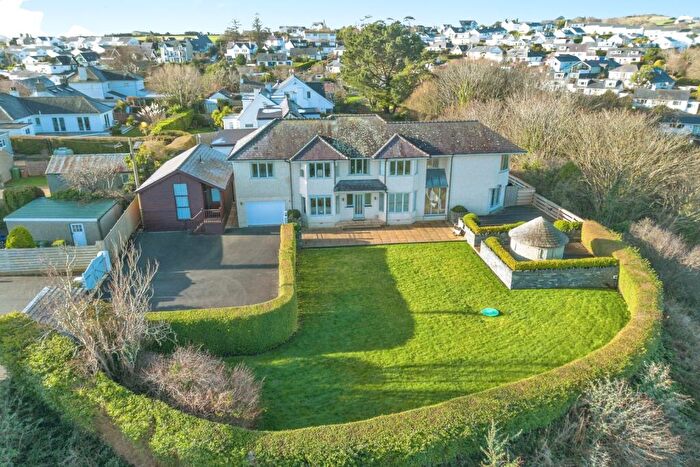
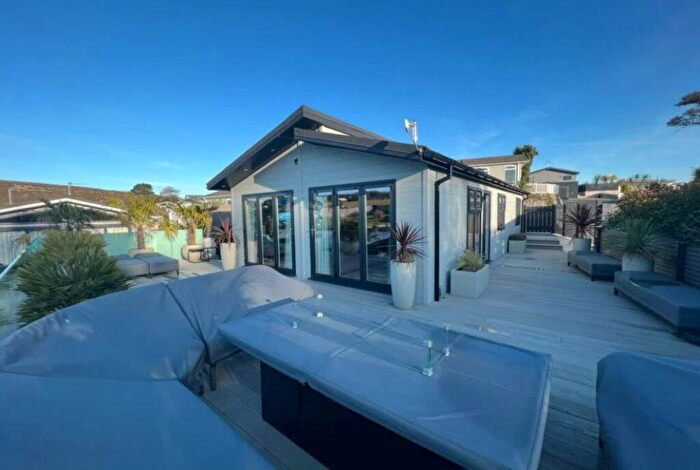
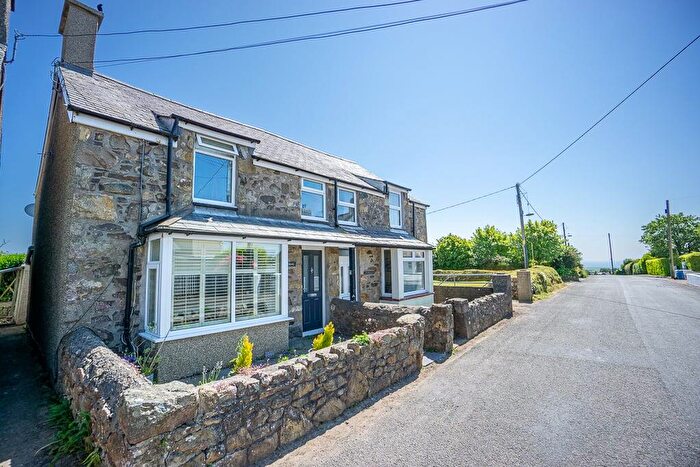
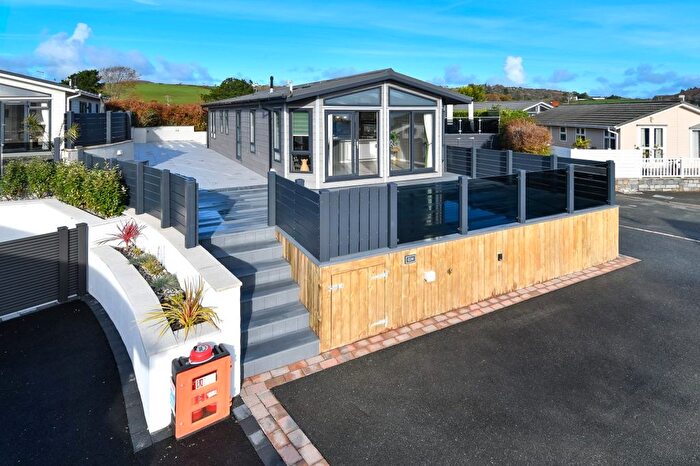
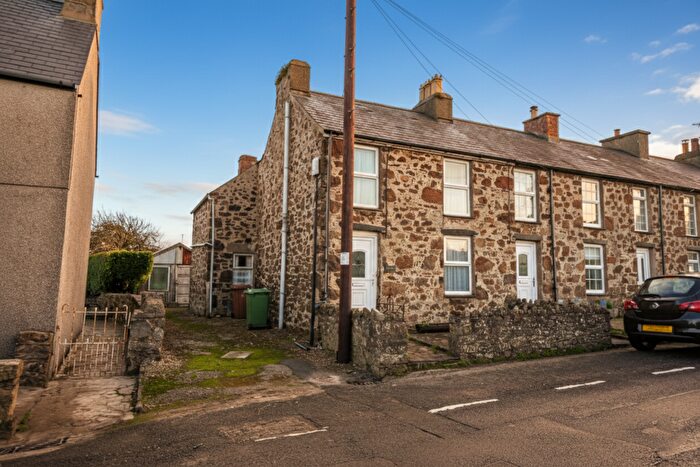
Houses for sale & to rent in Abersoch, Pwllheli
House Prices in Abersoch
Properties in Abersoch have an average house price of £561,446.00 and had 68 Property Transactions within the last 3 years¹.
Abersoch is an area in Pwllheli, Gwynedd - Gwynedd with 411 households², where the most expensive property was sold for £3,627,787.00.
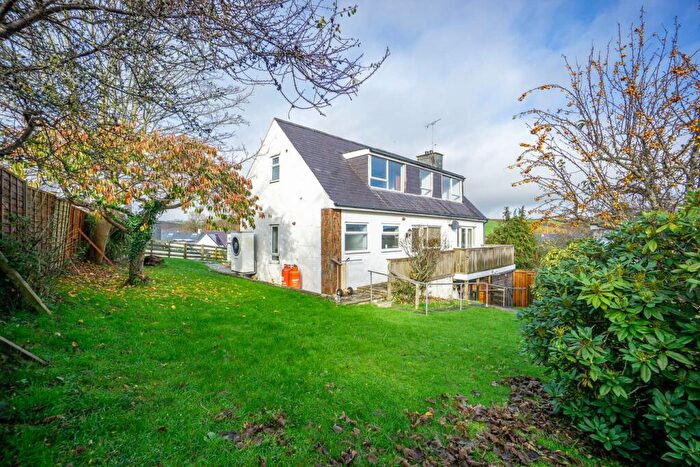
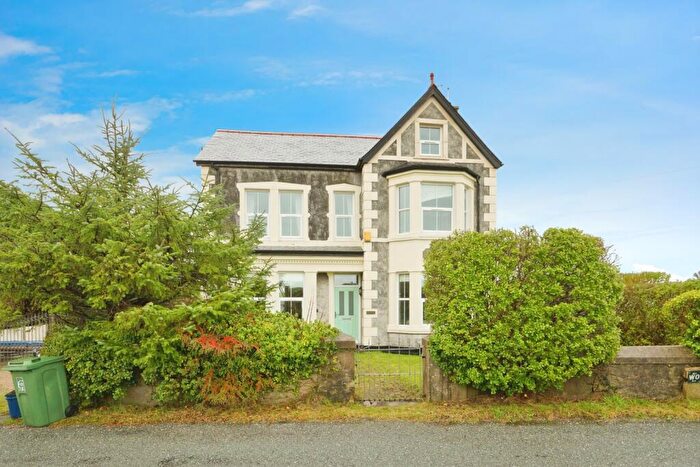
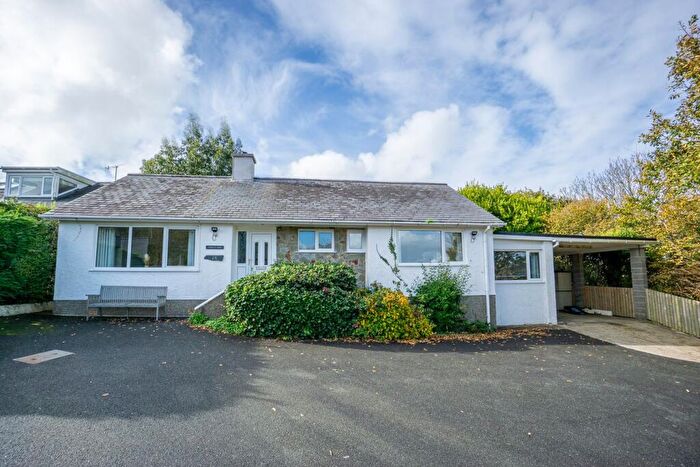
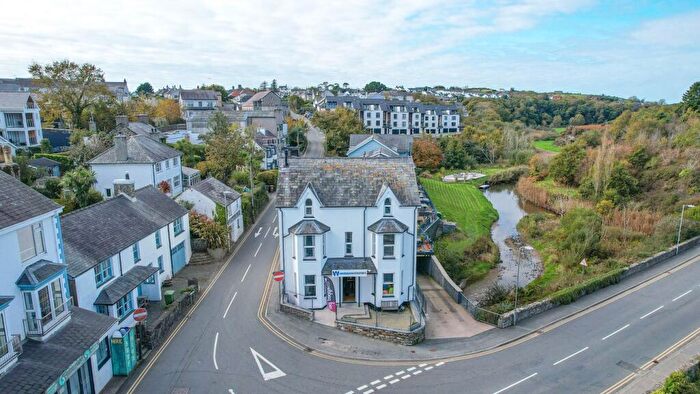
Properties for sale in Abersoch
Roads and Postcodes in Abersoch
Navigate through our locations to find the location of your next house in Abersoch, Pwllheli for sale or to rent.
| Streets | Postcodes |
|---|---|
| Afon Y Felin | LL53 7AB |
| Bayview Terrace | LL53 7UG |
| Benar Headland | LL53 7BA |
| Bro Aber | LL53 7UQ |
| Bryn Garmon | LL53 7UJ |
| Cae Du Estate | LL53 7DE LL53 7DJ LL53 7EN |
| Cae Du Village | LL53 7DX LL53 7DZ |
| Caepin Estate | LL53 7UH |
| Congl Feddw | LL53 7AE |
| Golf Road | LL53 7EF LL53 7EG |
| Gwydryn Road | LL53 7EA |
| Hafan Yr Harbwr | LL53 7HZ |
| Harbour Estate | LL53 7AT |
| Llwynonn Estate | LL53 7EP |
| Lon Engan | LL53 7HX |
| Lon Hawen | LL53 7EW |
| Lon Rhoslyn | LL53 7BD LL53 7BE LL53 7DN |
| Maes Gwydryn | LL53 7ED |
| Maesawel | LL53 7HS |
| Pen Y Bont | LL53 7HQ |
| Stryd Fawr | LL53 7DS |
| Tai Dyffryn | LL53 7AX |
| Tan Y Gaer | LL53 7LY |
| White House Drive | LL53 7AF |
| LL53 7AD LL53 7AG LL53 7AL LL53 7AU LL53 7AW LL53 7AY LL53 7BB LL53 7DL LL53 7DR LL53 7DT LL53 7DU LL53 7DY LL53 7EB LL53 7EE LL53 7EH LL53 7EL LL53 7ER LL53 7EY LL53 7HP LL53 7HR LL53 7HT LL53 7HU LL53 7HY LL53 7LA LL53 7LB LL53 7UL LL53 7AA LL53 7AH LL53 7AN LL53 7AP LL53 7AR LL53 7AS LL53 7DP LL53 7DW LL53 7UD LL53 7UE LL53 7UF |
Transport near Abersoch
- FAQ
- Price Paid By Year
- Property Type Price
Frequently asked questions about Abersoch
What is the average price for a property for sale in Abersoch?
The average price for a property for sale in Abersoch is £561,446. This amount is 82% higher than the average price in Pwllheli. There are 405 property listings for sale in Abersoch.
What streets have the most expensive properties for sale in Abersoch?
The streets with the most expensive properties for sale in Abersoch are Lon Rhoslyn at an average of £695,000, Harbour Estate at an average of £528,333 and Caepin Estate at an average of £492,500.
What streets have the most affordable properties for sale in Abersoch?
The streets with the most affordable properties for sale in Abersoch are Bro Aber at an average of £150,500, Congl Feddw at an average of £159,000 and Bayview Terrace at an average of £250,000.
Which train stations are available in or near Abersoch?
Some of the train stations available in or near Abersoch are Pwllheli, Abererch and Penychain.
Property Price Paid in Abersoch by Year
The average sold property price by year was:
| Year | Average Sold Price | Price Change |
Sold Properties
|
|---|---|---|---|
| 2025 | £289,215 | -121% |
19 Properties |
| 2024 | £638,093 | -7% |
16 Properties |
| 2023 | £681,023 | 12% |
33 Properties |
| 2022 | £598,844 | -6% |
36 Properties |
| 2021 | £633,870 | 23% |
41 Properties |
| 2020 | £489,468 | 13% |
32 Properties |
| 2019 | £427,790 | 1% |
31 Properties |
| 2018 | £421,740 | -15% |
29 Properties |
| 2017 | £483,417 | 14% |
46 Properties |
| 2016 | £414,241 | 12% |
35 Properties |
| 2015 | £362,669 | 6% |
19 Properties |
| 2014 | £339,166 | -21% |
37 Properties |
| 2013 | £410,938 | 3% |
16 Properties |
| 2012 | £399,860 | 4% |
15 Properties |
| 2011 | £383,476 | 7% |
21 Properties |
| 2010 | £355,541 | 3% |
18 Properties |
| 2009 | £344,261 | -16% |
21 Properties |
| 2008 | £400,278 | 7% |
16 Properties |
| 2007 | £371,912 | 1% |
24 Properties |
| 2006 | £367,372 | 21% |
29 Properties |
| 2005 | £288,637 | 11% |
31 Properties |
| 2004 | £256,850 | 23% |
32 Properties |
| 2003 | £199,004 | 18% |
40 Properties |
| 2002 | £162,800 | 17% |
35 Properties |
| 2001 | £135,251 | 23% |
39 Properties |
| 2000 | £103,802 | 17% |
38 Properties |
| 1999 | £85,647 | -12% |
34 Properties |
| 1998 | £95,848 | 15% |
39 Properties |
| 1997 | £81,300 | -4% |
30 Properties |
| 1996 | £84,809 | 10% |
33 Properties |
| 1995 | £76,323 | - |
17 Properties |
Property Price per Property Type in Abersoch
Here you can find historic sold price data in order to help with your property search.
The average Property Paid Price for specific property types in the last three years are:
| Property Type | Average Sold Price | Sold Properties |
|---|---|---|
| Semi Detached House | £547,700.00 | 15 Semi Detached Houses |
| Detached House | £715,429.00 | 30 Detached Houses |
| Terraced House | £418,230.00 | 13 Terraced Houses |
| Flat | £306,300.00 | 10 Flats |

