
Houses for sale & to rent in Llanengan, Pwllheli
House Prices in Llanengan
Properties in Llanengan have an average house price of £380k and had 37 Property Transactions within the last 3 years¹.
Llanengan is an area in Pwllheli, Gwynedd - Gwynedd with 559 households², where the most expensive property was sold for £1.15M.
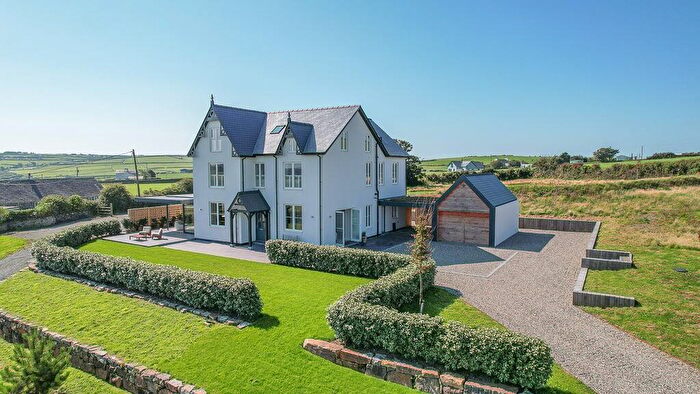
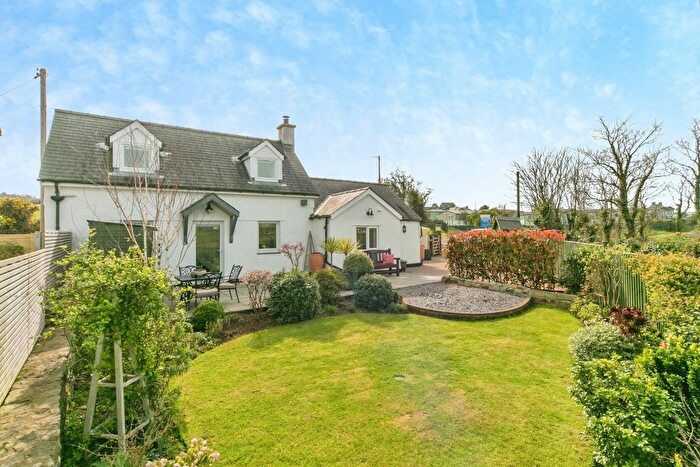
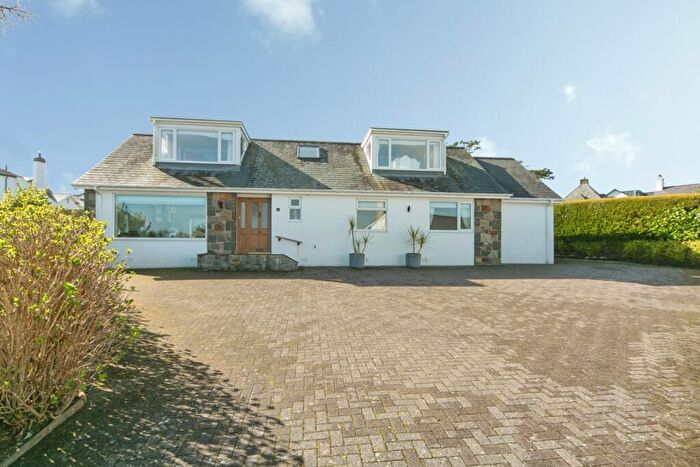
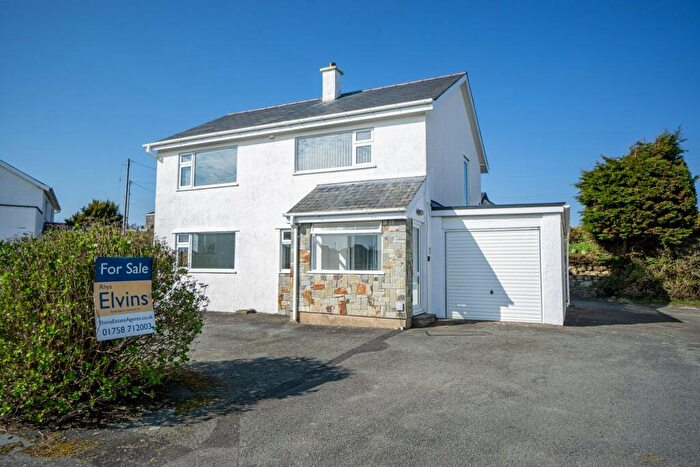
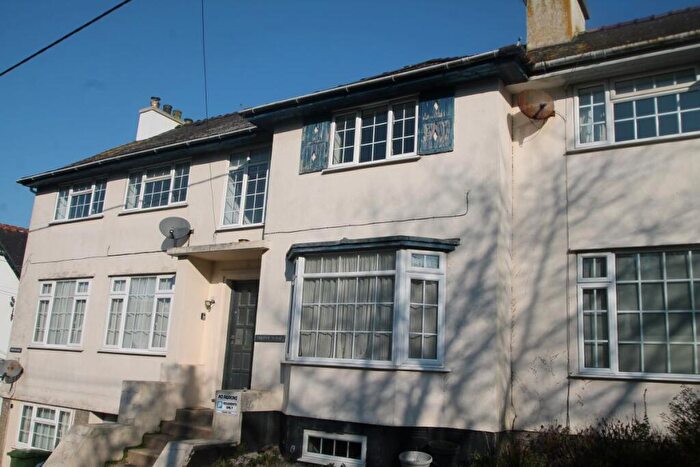
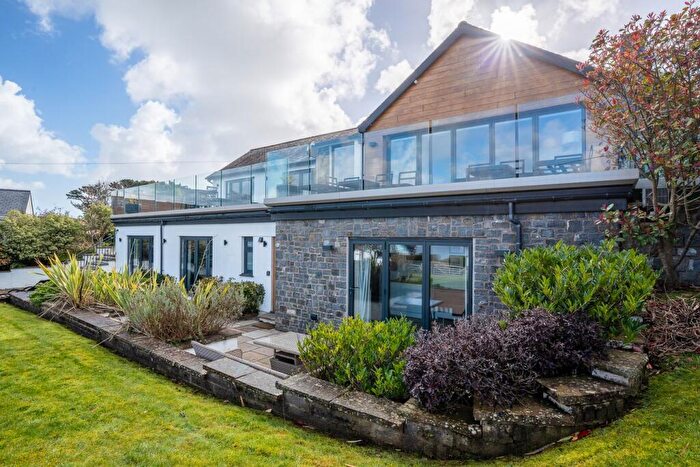
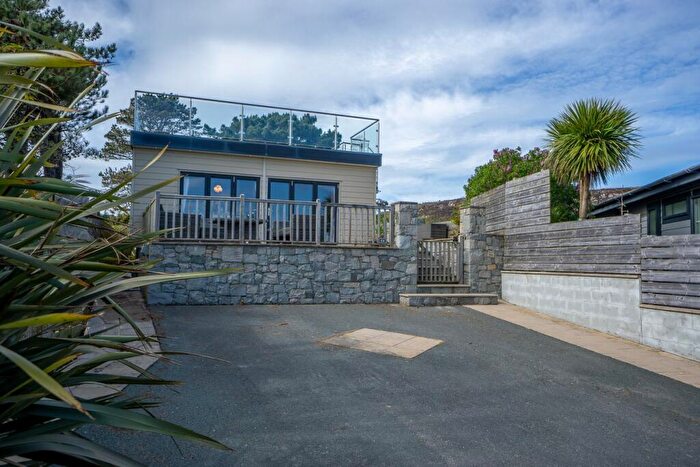
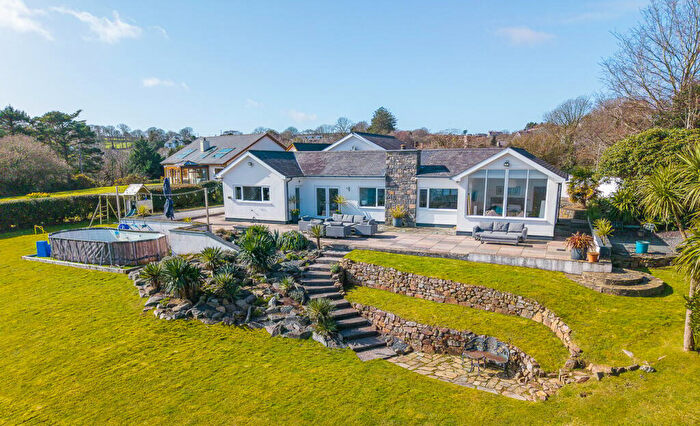
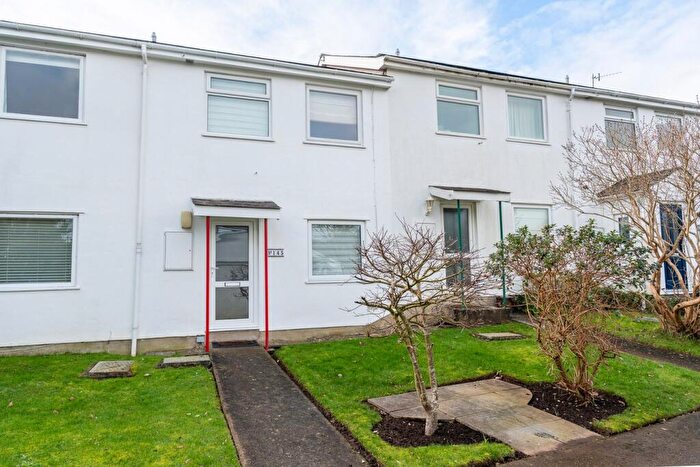
Properties for sale in Llanengan
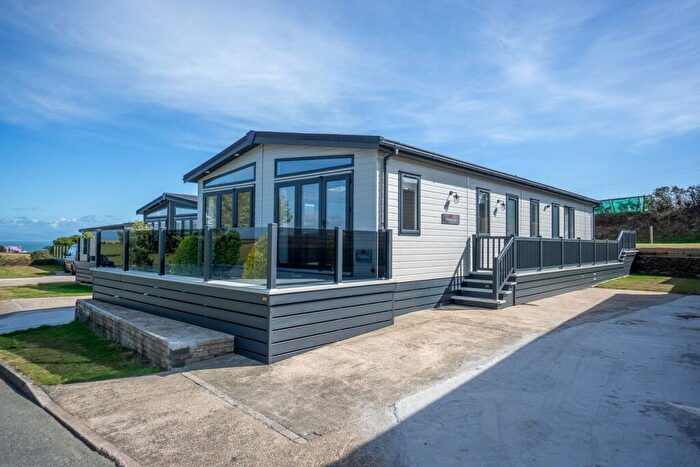
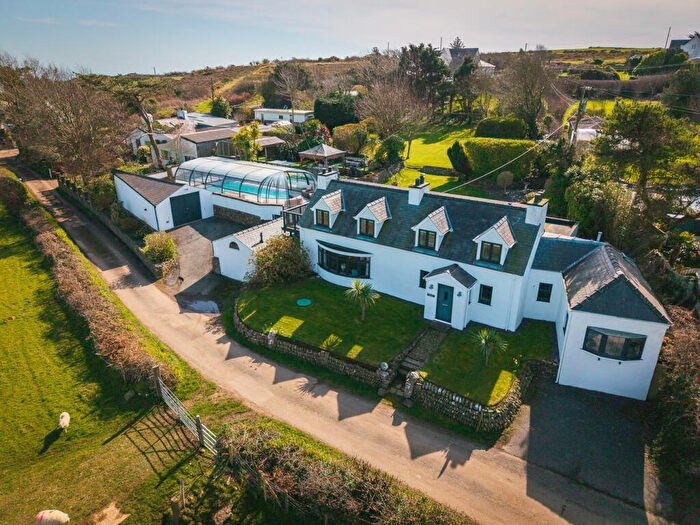
![]()
If you are looking to sell your house, let it out, or receive a property valuation, an expert can help you.
Click the button below to get started.
Roads and Postcodes in Llanengan
Navigate through our locations to find the location of your next house in Llanengan, Pwllheli for sale or to rent.
| Streets | Postcodes |
|---|---|
| Braich Farm Estate | LL53 7SF |
| Brooks | LL53 7SQ |
| Cae Arfryn | LL53 7RJ |
| Cornwall Estate | LL53 7RH |
| Dwyfor Estate | LL53 7DF |
| Follet Close | LL53 7DB |
| Ger Y Foel | LL53 7RD |
| Lon Cernyw | LL53 7DH |
| Lon Penlon | LL53 7SJ |
| Lon Wilis | LL53 7SA |
| Parciau | LL53 7SB |
| Pen Y Bryn Estate | LL53 7SE |
| St Tudwals Estate | LL53 7RU |
| Ystad Murpoeth | LL53 7ST |
| LL53 7BG LL53 7BL LL53 7BN LL53 7BP LL53 7BS LL53 7BT LL53 7BU LL53 7BW LL53 7BY LL53 7DA LL53 7DD LL53 7ES LL53 7ET LL53 7EU LL53 7LD LL53 7LE LL53 7LG LL53 7LH LL53 7LL LL53 7LN LL53 7LP LL53 7LT LL53 7PR LL53 7PS LL53 7RF LL53 7RG LL53 7RL LL53 7RN LL53 7RR LL53 7RS LL53 7RT LL53 7RW LL53 7RY LL53 7SD LL53 7SH LL53 7SN LL53 7YB LL53 7BH LL53 7LF LL53 7LR LL53 7LS LL53 7LU LL53 7LW LL53 7SG LL53 7SL LL53 7SW LL53 7YA LL53 7YD |
Transport near Llanengan

- FAQ
- Price Paid By Year
- Property Type Price
Frequently asked questions about Llanengan
What is the average price for a property for sale in Llanengan?
The average price for a property for sale in Llanengan is £380,114. This amount is 23% higher than the average price in Pwllheli. There are 545 property listings for sale in Llanengan.
What streets have the most expensive properties for sale in Llanengan?
The streets with the most expensive properties for sale in Llanengan are Pen Y Bryn Estate at an average of £420,625 and St Tudwals Estate at an average of £399,375.
What streets have the most affordable properties for sale in Llanengan?
The streets with the most affordable properties for sale in Llanengan are Cornwall Estate at an average of £127,500 and Brooks at an average of £235,000.
Which train stations are available in or near Llanengan?
Some of the train stations available in or near Llanengan are Pwllheli, Abererch and Penychain.
Property Price Paid in Llanengan by Year
The average sold property price by year was:
| Year | Average Sold Price | Price Change |
Sold Properties
|
|---|---|---|---|
| 2025 | £368,400 | 12% |
5 Properties |
| 2024 | £322,916 | -29% |
12 Properties |
| 2023 | £417,362 | -8% |
20 Properties |
| 2022 | £449,249 | 13% |
31 Properties |
| 2021 | £392,121 | 11% |
40 Properties |
| 2020 | £347,758 | 7% |
23 Properties |
| 2019 | £322,206 | 4% |
26 Properties |
| 2018 | £308,774 | 6% |
31 Properties |
| 2017 | £289,052 | -24% |
20 Properties |
| 2016 | £359,325 | -3% |
26 Properties |
| 2015 | £370,220 | 18% |
20 Properties |
| 2014 | £304,636 | 9% |
18 Properties |
| 2013 | £276,768 | 4% |
11 Properties |
| 2012 | £266,888 | -5% |
9 Properties |
| 2011 | £281,269 | 24% |
13 Properties |
| 2010 | £213,888 | -54% |
9 Properties |
| 2009 | £329,850 | 7% |
10 Properties |
| 2008 | £305,862 | -26% |
12 Properties |
| 2007 | £386,459 | 37% |
20 Properties |
| 2006 | £244,794 | -24% |
26 Properties |
| 2005 | £304,328 | 29% |
19 Properties |
| 2004 | £217,273 | 25% |
18 Properties |
| 2003 | £162,562 | 10% |
31 Properties |
| 2002 | £145,545 | 29% |
37 Properties |
| 2001 | £103,906 | 27% |
24 Properties |
| 2000 | £76,236 | -16% |
30 Properties |
| 1999 | £88,546 | -31% |
31 Properties |
| 1998 | £115,905 | 33% |
14 Properties |
| 1997 | £77,809 | 23% |
21 Properties |
| 1996 | £60,255 | 9% |
26 Properties |
| 1995 | £54,820 | - |
17 Properties |
Property Price per Property Type in Llanengan
Here you can find historic sold price data in order to help with your property search.
The average Property Paid Price for specific property types in the last three years are:
| Property Type | Average Sold Price | Sold Properties |
|---|---|---|
| Semi Detached House | £311,000.00 | 5 Semi Detached Houses |
| Detached House | £415,116.00 | 28 Detached Houses |
| Terraced House | £249,166.00 | 3 Terraced Houses |
| Flat | £138,500.00 | 1 Flat |