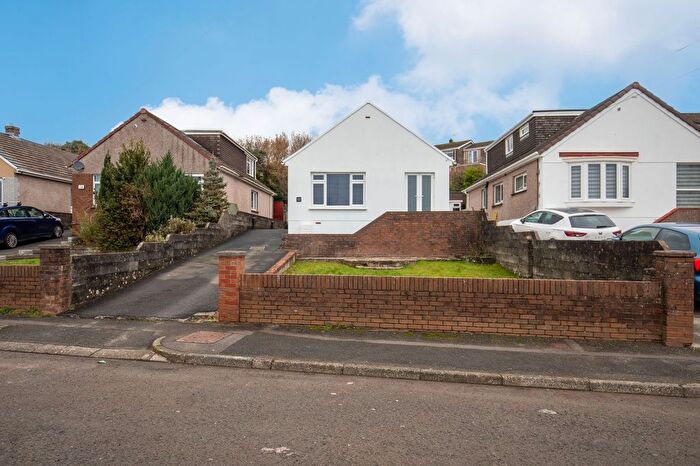
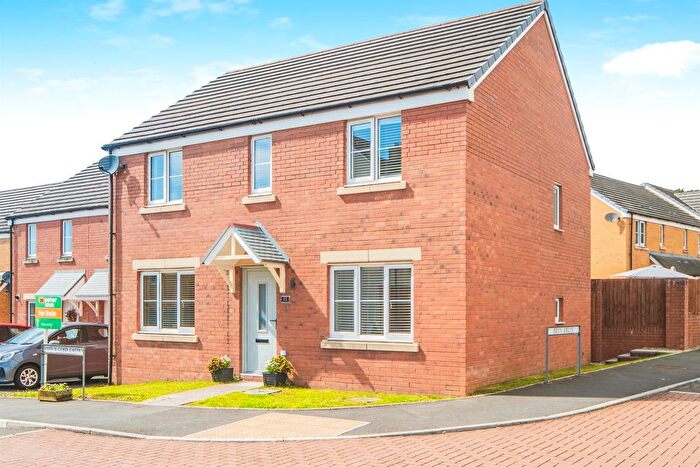
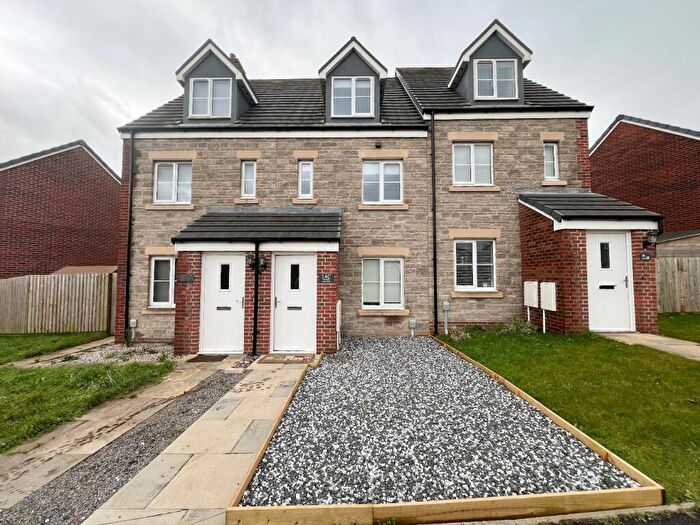
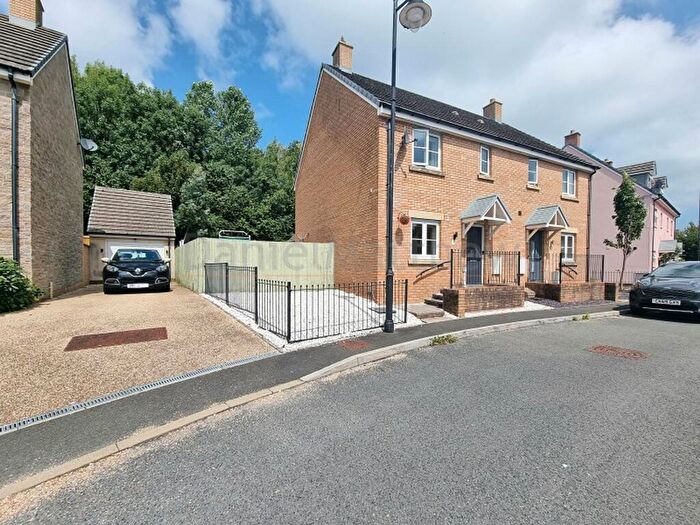
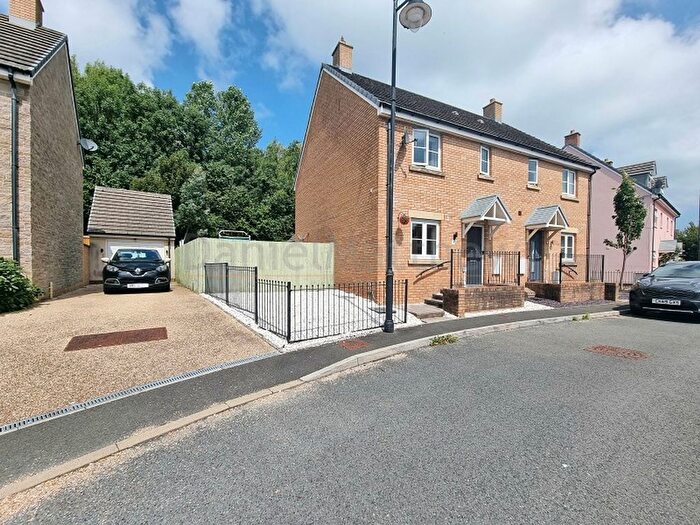
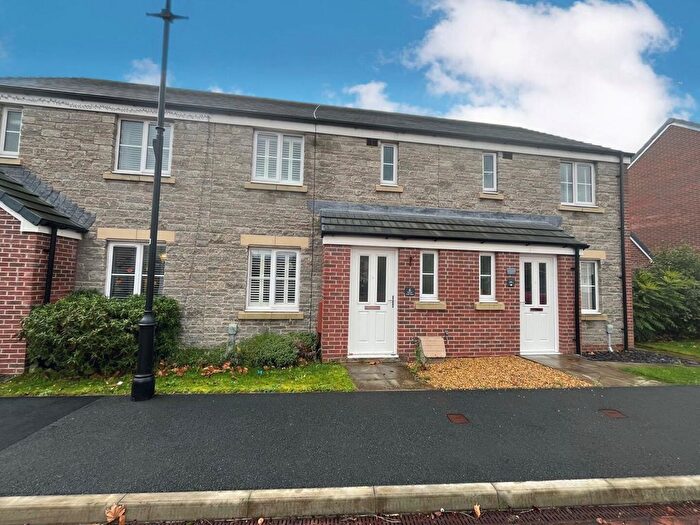
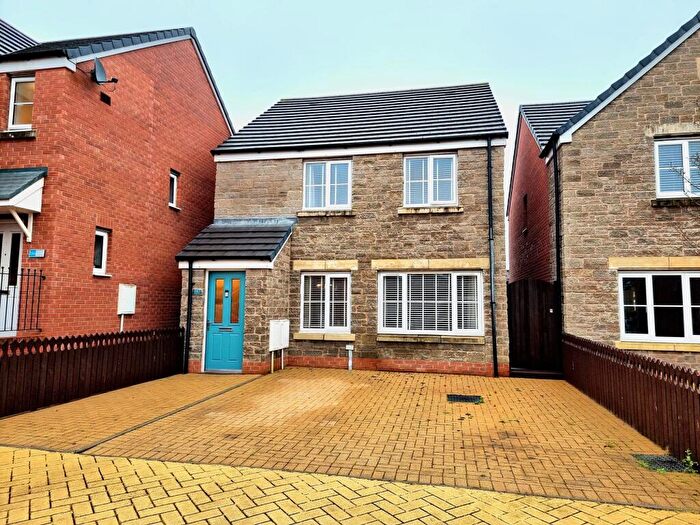
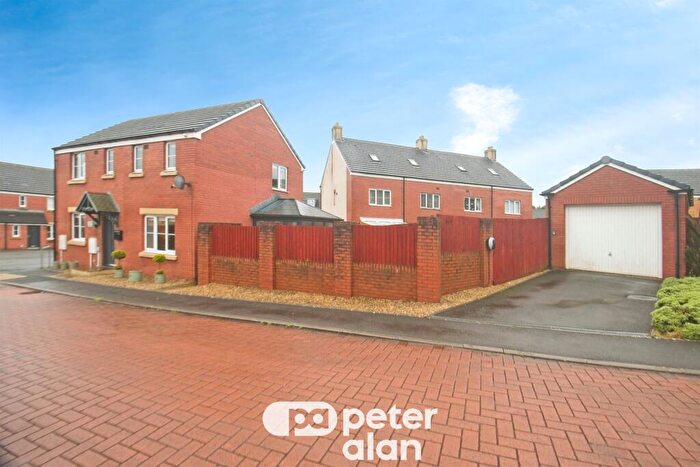
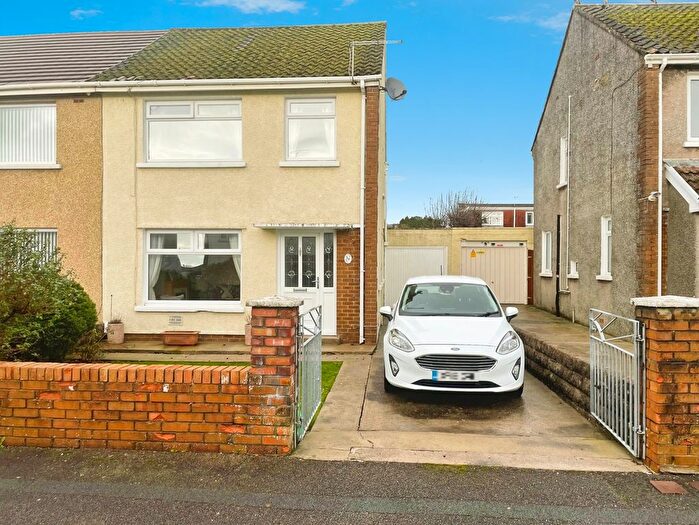
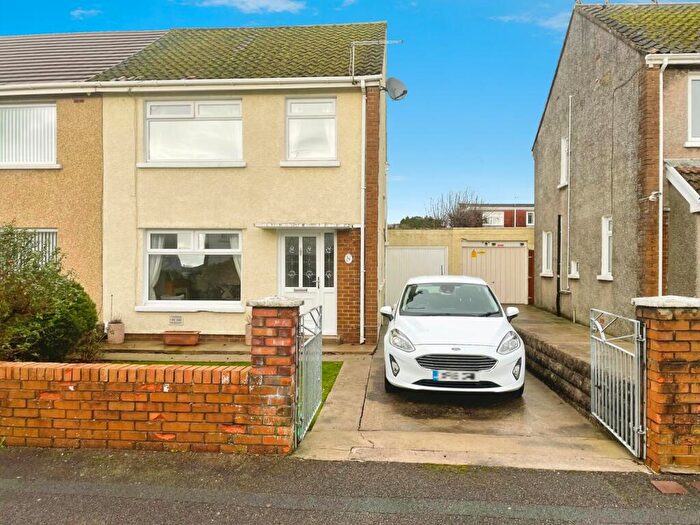
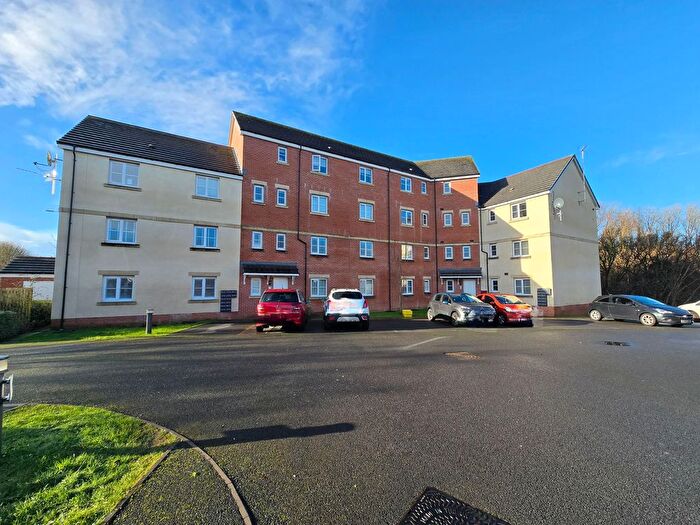
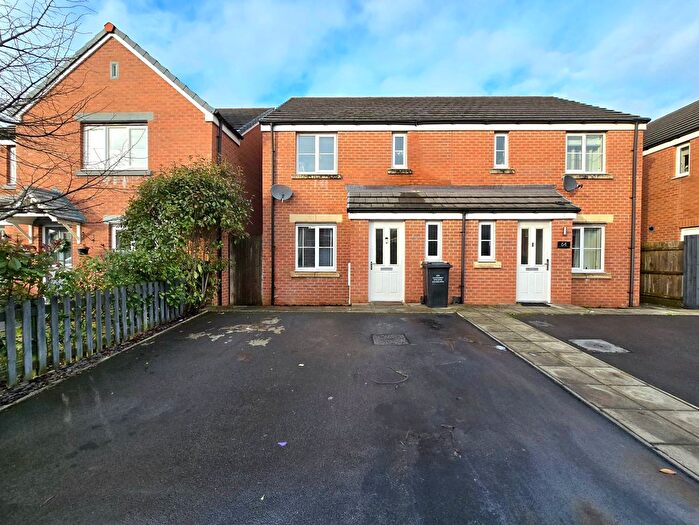
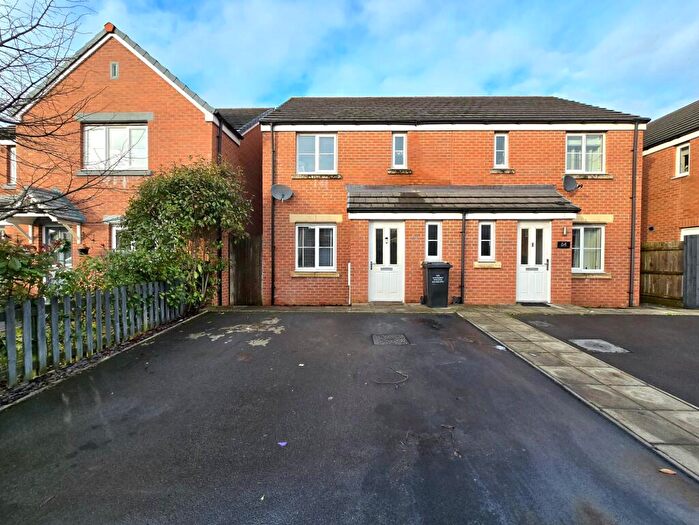
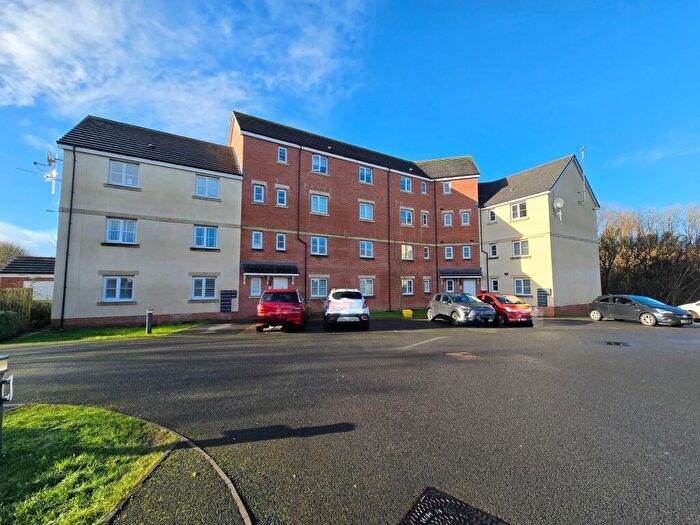
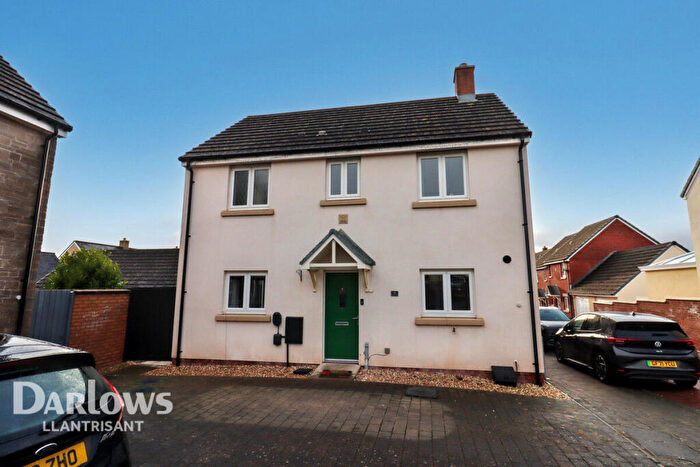
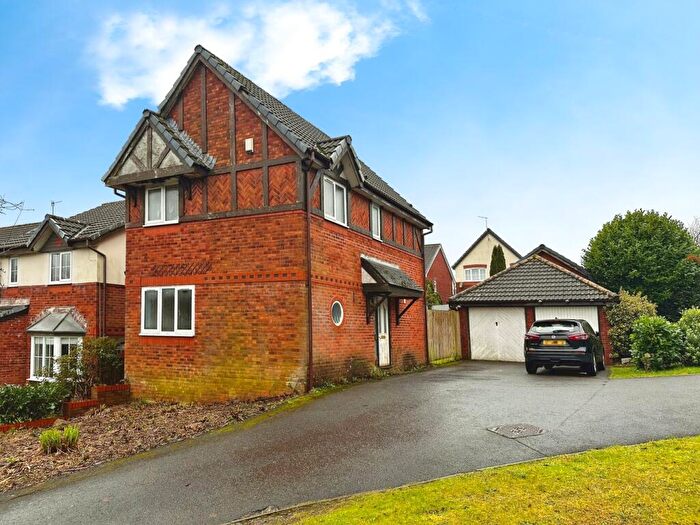
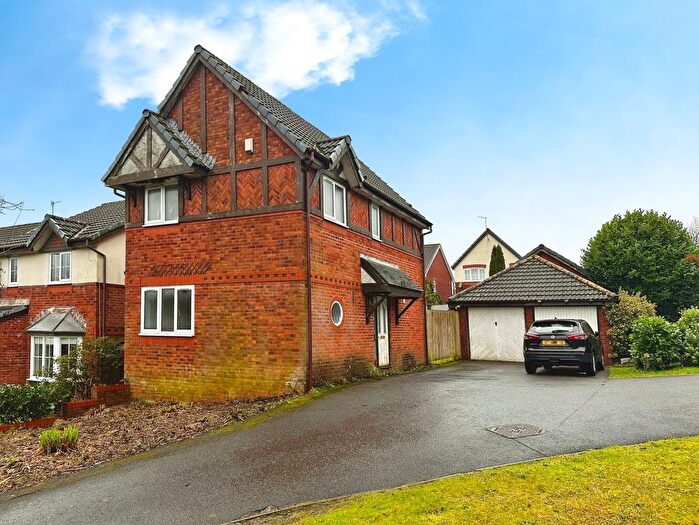
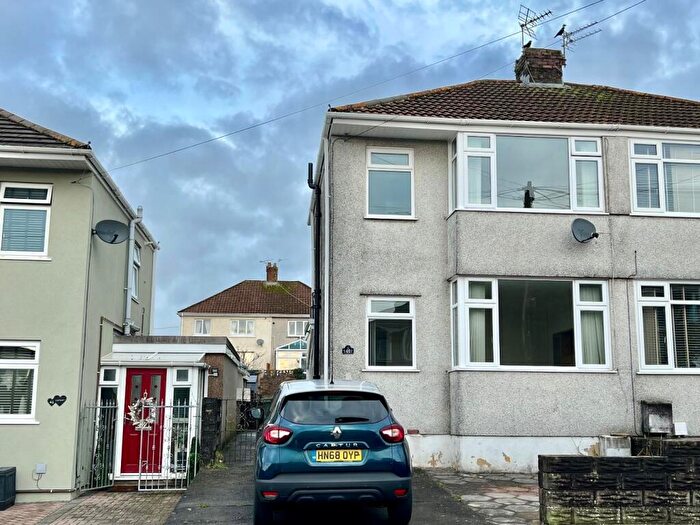
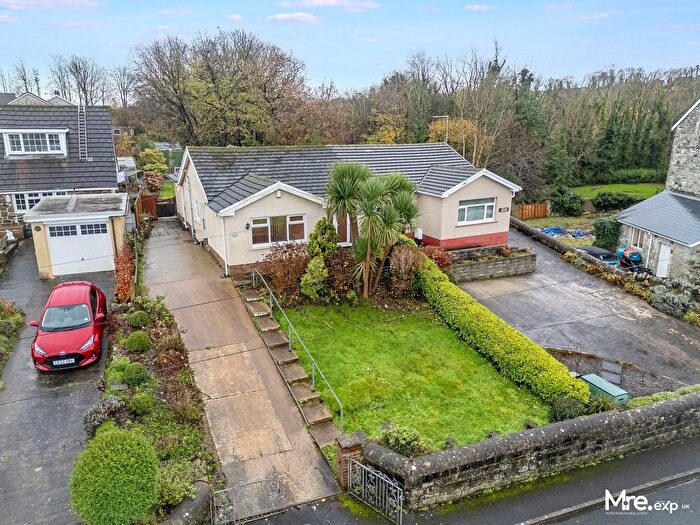
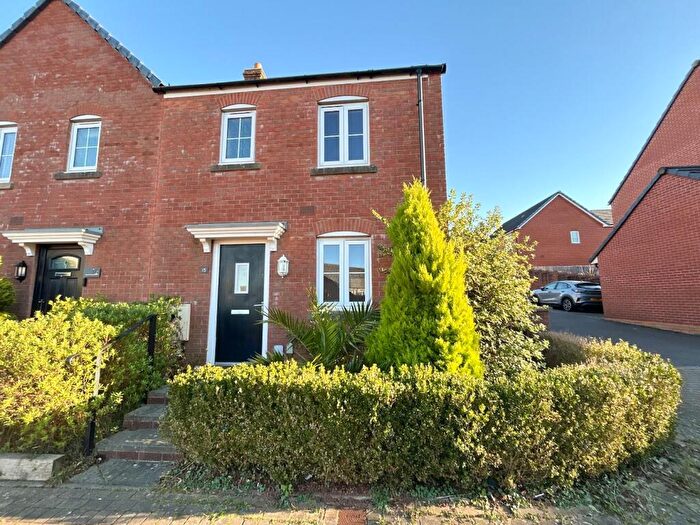
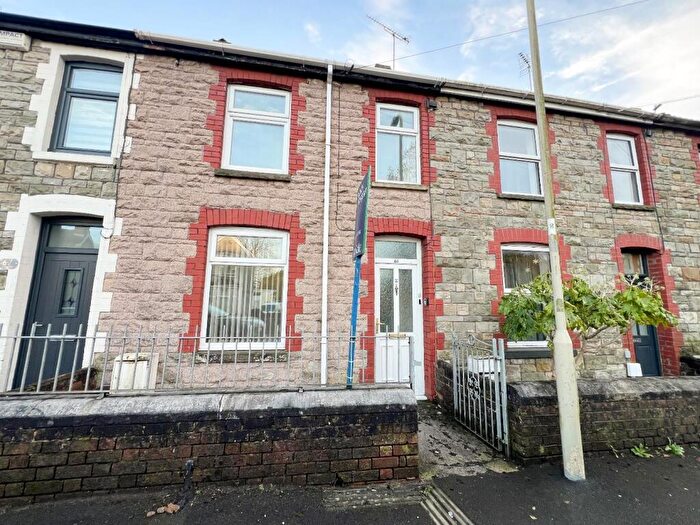
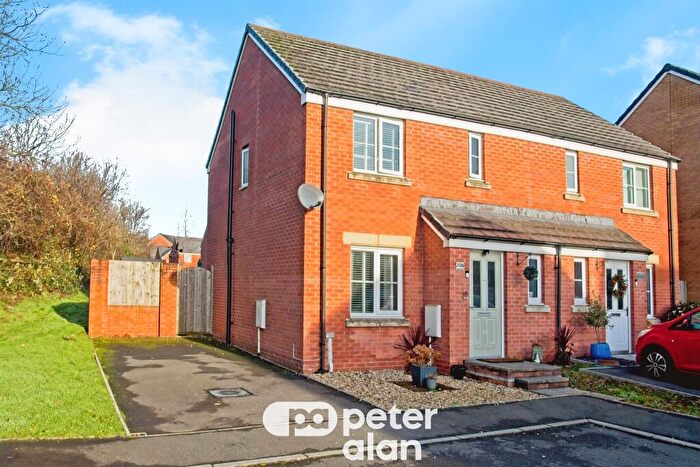
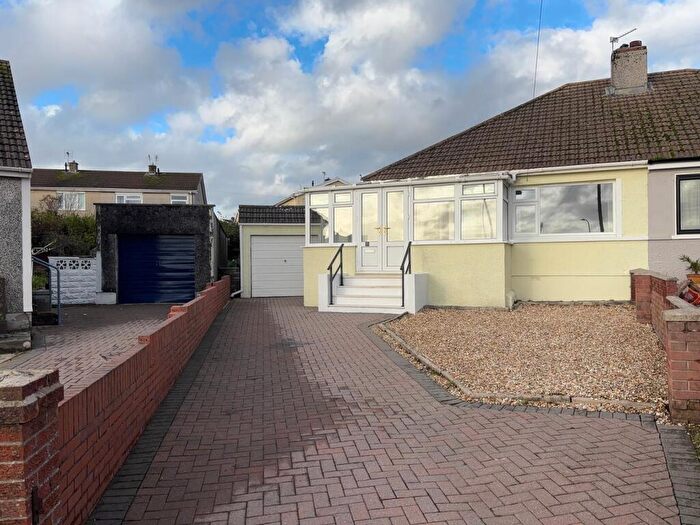
Houses for sale & to rent in Litchard, Bridgend
House Prices in Litchard
Properties in Litchard have an average house price of £263,132.00 and had 113 Property Transactions within the last 3 years¹.
Litchard is an area in Bridgend, Pen-y-bont ar Ogwr - Bridgend with 910 households², where the most expensive property was sold for £456,680.00.
Properties for sale in Litchard
Roads and Postcodes in Litchard
Navigate through our locations to find the location of your next house in Litchard, Bridgend for sale or to rent.
| Streets | Postcodes |
|---|---|
| Angelton Cottages | CF31 4LE |
| Anglia Close | CF31 1QX |
| Bracken Way | CF31 1YQ |
| Bryn Eirlys | CF35 6NU |
| Bryn Llidiard | CF31 1QD CF31 1QN |
| Cae Derwen | CF31 1PY |
| Celtic View | CF31 1YG |
| Clos Y Coed Castan | CF35 6PA |
| Clos Yr Eryr | CF35 6HE CF35 6HF |
| Derwen Close | CF31 1QP |
| Designer Outlet Village | CF32 9SH |
| Ffordd Y Parc | CF31 1RA |
| Garfield Avenue | CF31 1QA CF31 1QB |
| Glen View | CF31 1QU |
| Greenwood Close | CF31 1PJ |
| Gwalia Close | CF31 1YH |
| Heol Castell Coety | CF31 1PU CF31 1PX |
| Heol Mair | CF31 1YL |
| Heol Y Groes | CF31 1QE CF31 1QY CF31 1QZ |
| Highfield Avenue | CF31 1QR |
| Litchard Bungalows | CF31 1PH |
| Litchard Hill | CF31 1QJ CF31 1QQ CF35 6HA CF35 6HB CF31 1QL |
| Litchard Rise | CF31 1QH |
| Litchard Terrace | CF31 1PL |
| Litchard Villas | CF31 1RB |
| Llys Y Ddraenen Wen | CF35 6HP |
| Maes Y Coed Castan | CF35 6NZ |
| Nursery Gardens | CF31 1NH |
| Osborne Close | CF31 1YJ |
| Penylan | CF31 1QW |
| Penyrallt Avenue | CF31 1QG |
| Sycamore Close | CF31 1QS |
| The Derwen | CF31 1RD CF35 6HD CF32 9ST |
| Turberville Crescent | CF31 1QT |
| Woodside Avenue | CF31 1QF |
Transport near Litchard
- FAQ
- Price Paid By Year
- Property Type Price
Frequently asked questions about Litchard
What is the average price for a property for sale in Litchard?
The average price for a property for sale in Litchard is £263,132. This amount is 22% higher than the average price in Bridgend. There are 1,191 property listings for sale in Litchard.
What streets have the most expensive properties for sale in Litchard?
The streets with the most expensive properties for sale in Litchard are Anglia Close at an average of £395,200, Gwalia Close at an average of £390,000 and Nursery Gardens at an average of £360,750.
What streets have the most affordable properties for sale in Litchard?
The streets with the most affordable properties for sale in Litchard are Ffordd Y Parc at an average of £187,333, Garfield Avenue at an average of £202,883 and Heol Castell Coety at an average of £206,062.
Which train stations are available in or near Litchard?
Some of the train stations available in or near Litchard are Wildmill, Sarn and Bridgend.
Property Price Paid in Litchard by Year
The average sold property price by year was:
| Year | Average Sold Price | Price Change |
Sold Properties
|
|---|---|---|---|
| 2025 | £272,268 | 5% |
31 Properties |
| 2024 | £258,103 | -1% |
45 Properties |
| 2023 | £261,594 | 12% |
37 Properties |
| 2022 | £229,109 | 6% |
44 Properties |
| 2021 | £214,874 | 10% |
56 Properties |
| 2020 | £193,314 | -6% |
45 Properties |
| 2019 | £203,996 | 11% |
49 Properties |
| 2018 | £180,971 | -2% |
52 Properties |
| 2017 | £184,070 | -4% |
140 Properties |
| 2016 | £191,777 | 1% |
92 Properties |
| 2015 | £189,466 | 14% |
67 Properties |
| 2014 | £162,403 | 17% |
39 Properties |
| 2013 | £134,011 | -5% |
21 Properties |
| 2012 | £141,378 | -5% |
21 Properties |
| 2011 | £149,058 | -14% |
17 Properties |
| 2010 | £170,090 | 17% |
11 Properties |
| 2009 | £141,852 | -17% |
19 Properties |
| 2008 | £166,133 | -5% |
18 Properties |
| 2007 | £174,664 | 14% |
21 Properties |
| 2006 | £150,743 | 3% |
32 Properties |
| 2005 | £146,962 | 4% |
25 Properties |
| 2004 | £140,406 | 14% |
22 Properties |
| 2003 | £120,176 | 27% |
30 Properties |
| 2002 | £87,795 | 20% |
56 Properties |
| 2001 | £70,573 | 1% |
48 Properties |
| 2000 | £70,179 | 3% |
37 Properties |
| 1999 | £68,415 | 14% |
41 Properties |
| 1998 | £58,670 | -3% |
34 Properties |
| 1997 | £60,260 | 5% |
37 Properties |
| 1996 | £57,424 | -5% |
31 Properties |
| 1995 | £60,280 | - |
17 Properties |
Property Price per Property Type in Litchard
Here you can find historic sold price data in order to help with your property search.
The average Property Paid Price for specific property types in the last three years are:
| Property Type | Average Sold Price | Sold Properties |
|---|---|---|
| Semi Detached House | £237,700.00 | 58 Semi Detached Houses |
| Detached House | £318,348.00 | 42 Detached Houses |
| Terraced House | £198,207.00 | 13 Terraced Houses |

