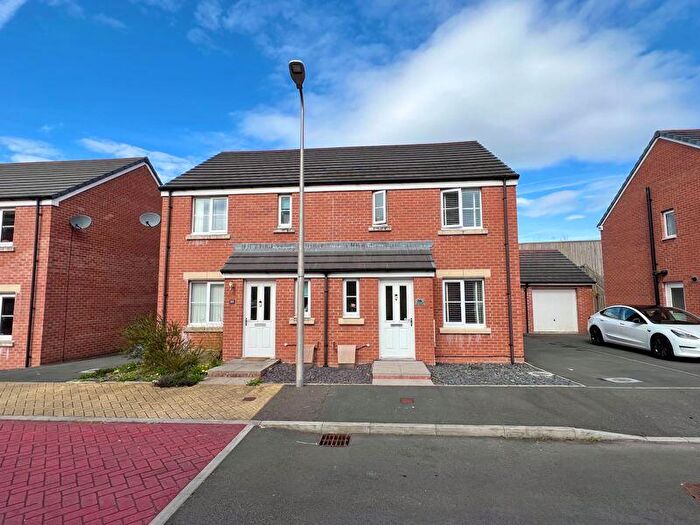
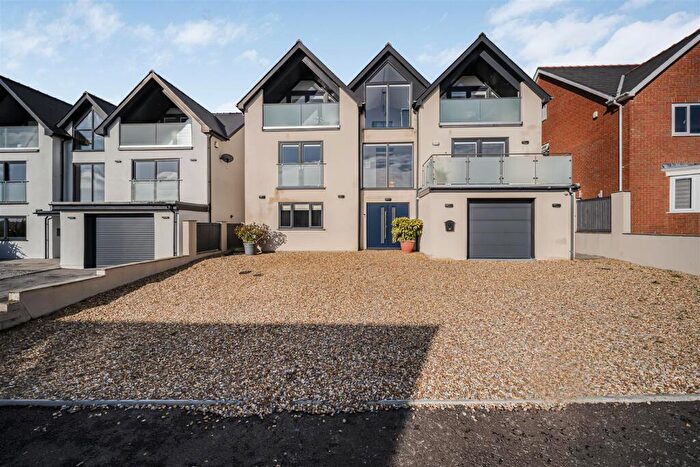
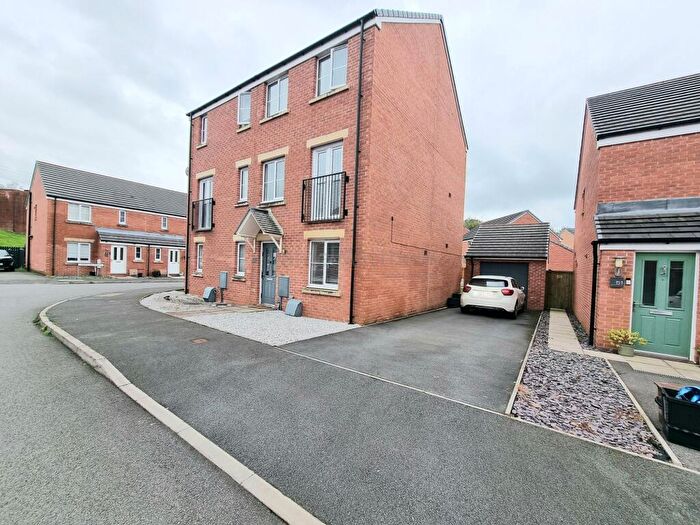
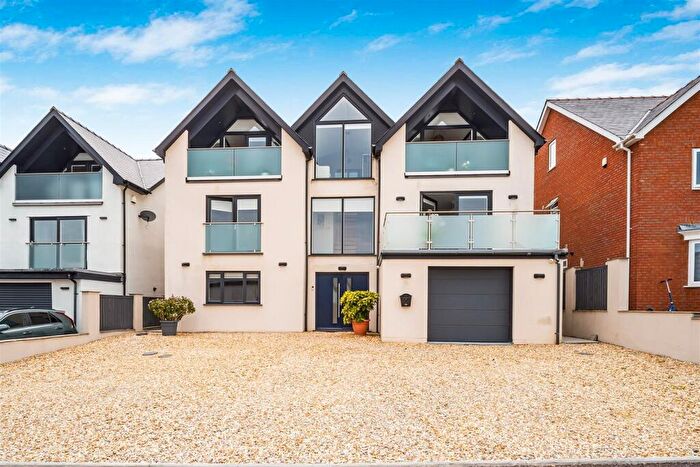
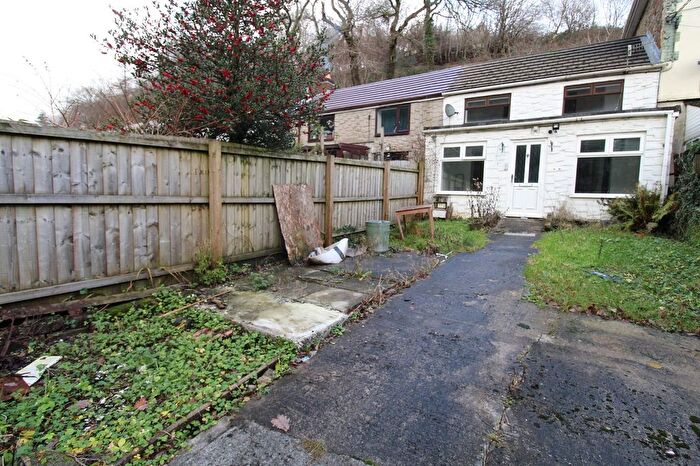
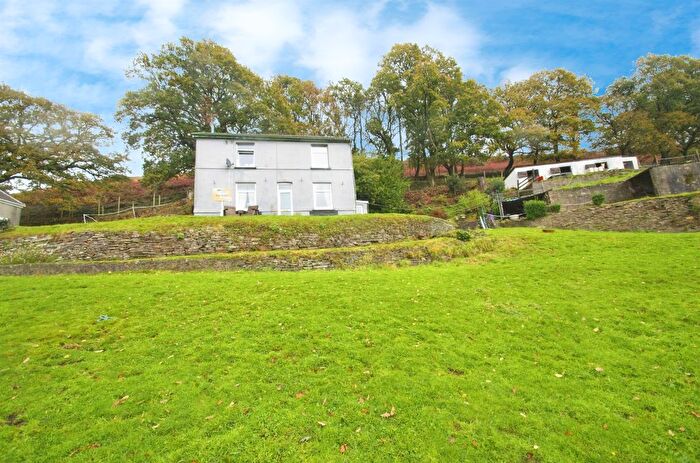
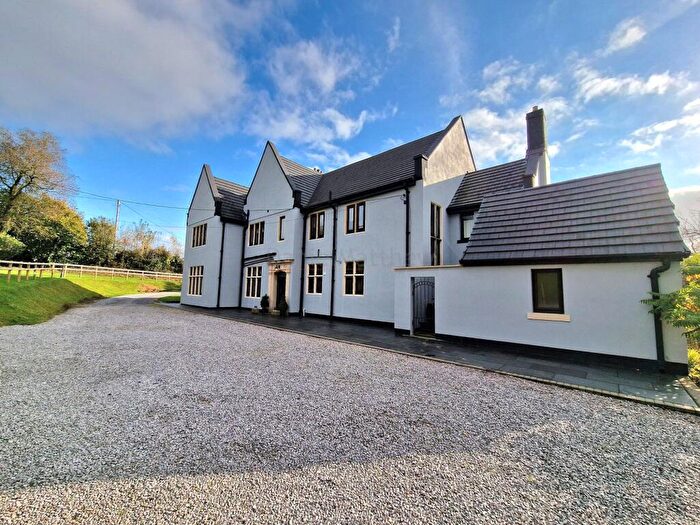
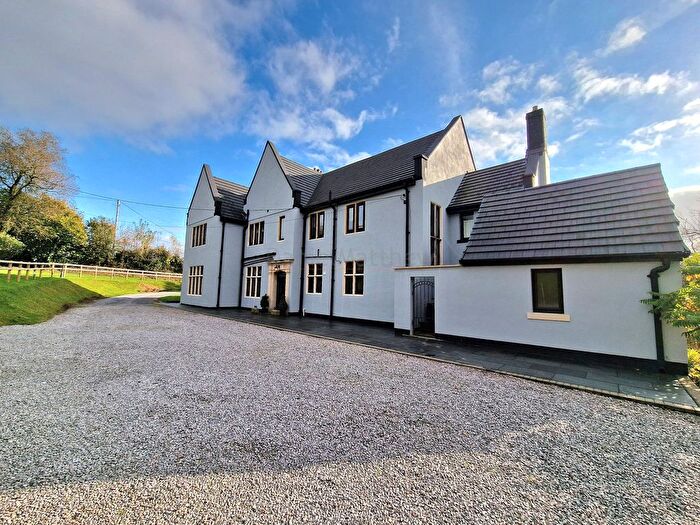
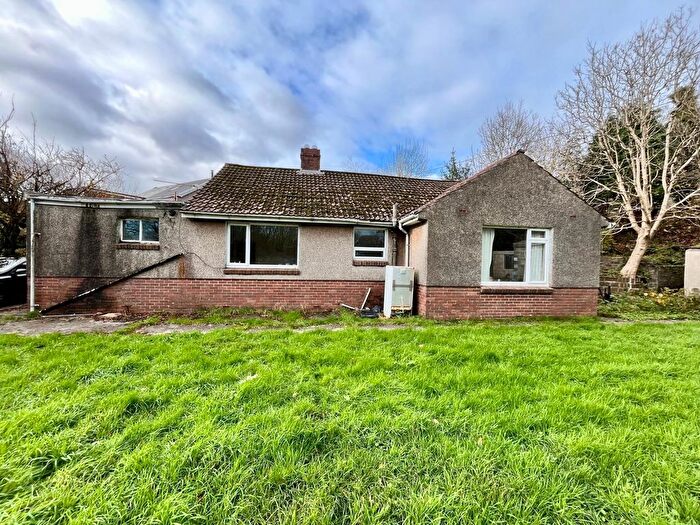
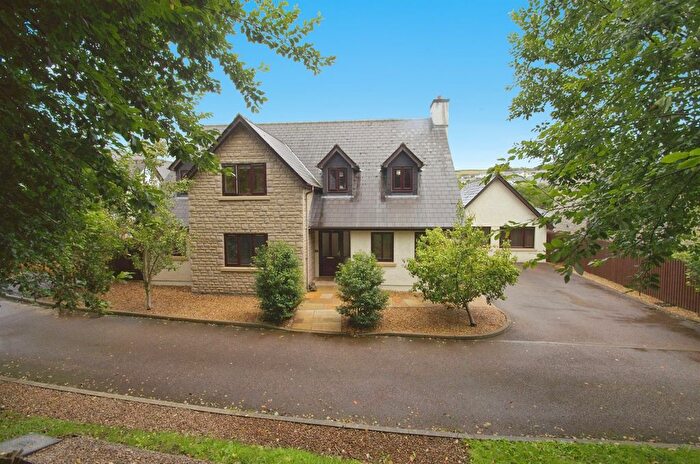
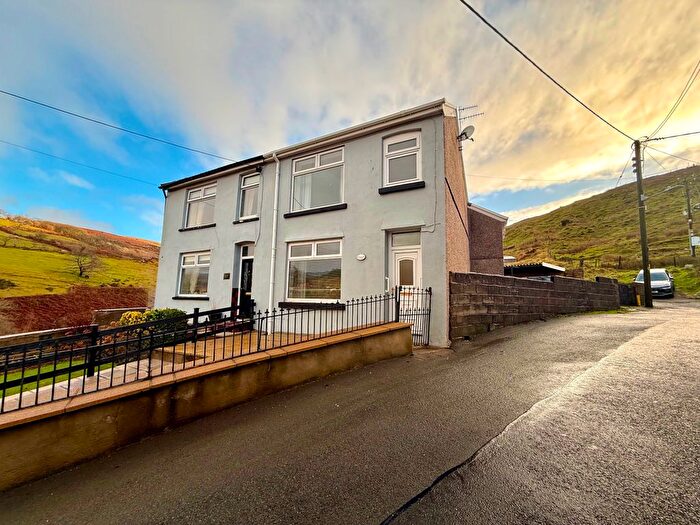
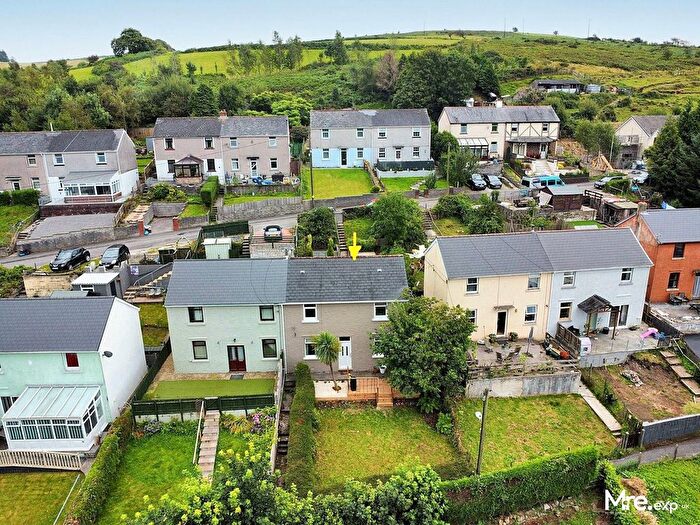
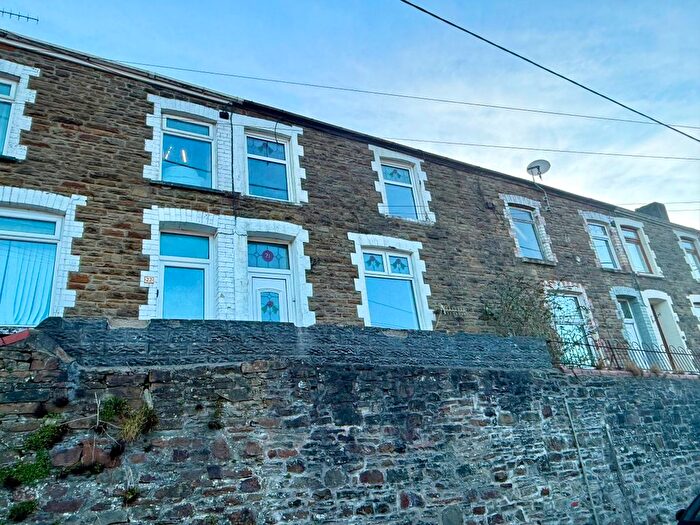
Houses for sale & to rent in Llangeinor, Bridgend
House Prices in Llangeinor
Properties in Llangeinor have an average house price of £179,239.00 and had 52 Property Transactions within the last 3 years¹.
Llangeinor is an area in Bridgend, Pen-y-bont ar Ogwr - Bridgend with 501 households², where the most expensive property was sold for £885,000.00.
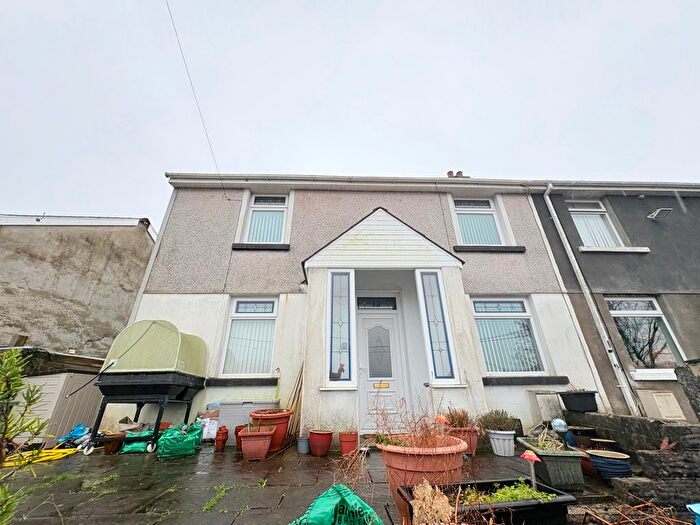
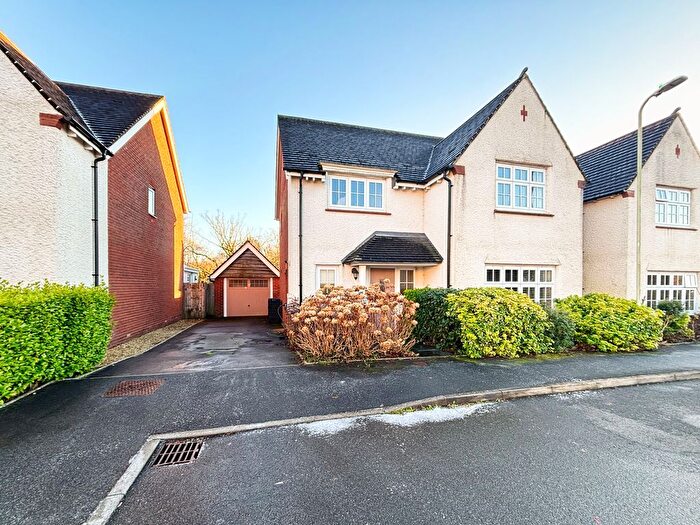
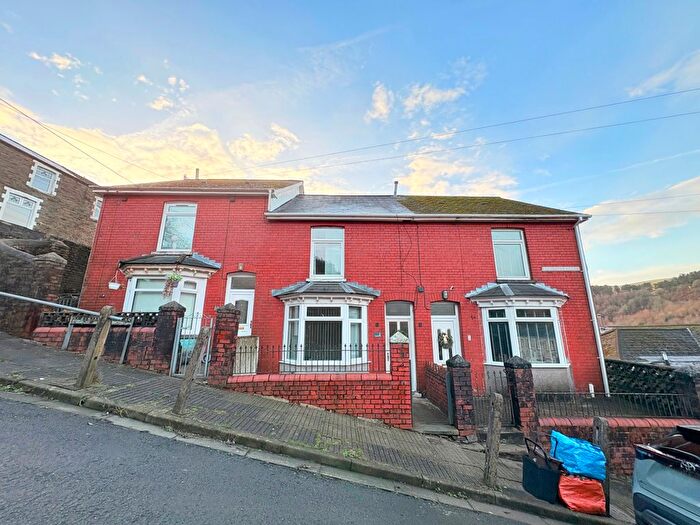
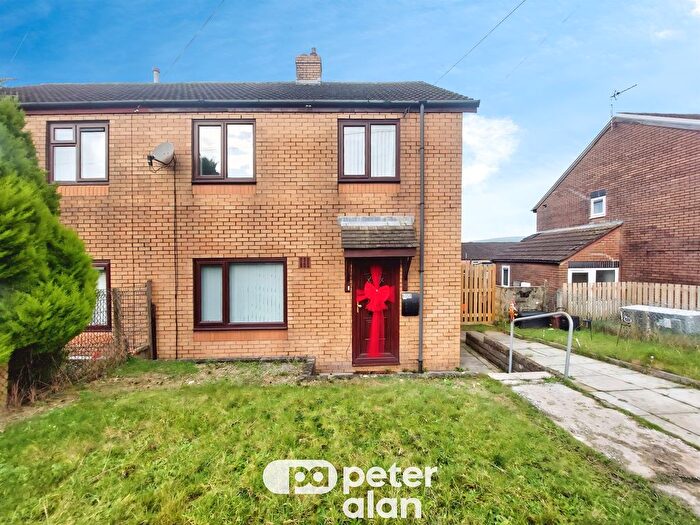
Properties for sale in Llangeinor
Previously listed properties in Llangeinor
Roads and Postcodes in Llangeinor
Navigate through our locations to find the location of your next house in Llangeinor, Bridgend for sale or to rent.
| Streets | Postcodes |
|---|---|
| Abergarw Road | CF32 8YA |
| Beech Road | CF32 8AJ |
| Bettws Road | CF32 8PH CF32 8PG |
| Bryn Cottages | CF32 8PX |
| Cae Bach | CF32 8PU |
| Craig Las | CF32 8NT CF32 8PT |
| Cwm Cottages | CF32 8PE |
| Ffrwyd Villas | CF32 8PF |
| Garw Fechan Road | CF32 8BX |
| Heol Gellilodrau | CF32 8PS |
| Heol Glynpandy | CF32 8RB |
| Heol Llangeinor | CF32 8PW |
| Heol Llwynffynon | CF32 8PR |
| Heol Pandy | CF32 8RA |
| Heol Tynant | CF32 8HZ |
| Heol Tynton | CF32 8PP |
| Hot Wells | CF32 8NU |
| Lluest Cottages | CF32 8LX |
| Mount Pleasant | CF32 8AX |
| Mount Pleasant Cottages | CF32 8NY |
| Pleasant View | CF32 8BJ |
| River Mews | CF32 8FD |
| Rose Cottages | CF32 8PB |
| Station Row | CF32 8PJ |
| Sweetwells Cottages | CF32 8DJ |
| The Croft | CF32 8PD |
| Tylagwyn Bungalows | CF32 8DX |
| West Rhondda Road | CF32 8LJ |
| CF32 8EJ CF32 8PA CF32 8PN CF32 8PY CF32 8RD CF32 8RX CF32 8UU CF32 8EX CF32 8HJ CF32 8HX CF32 8PL CF32 8QA CF32 8UG CF32 8UH CF34 0EB CF35 6UE CF35 6UF |
Transport near Llangeinor
-
Tondu Station
-
Sarn Station
-
Garth (Mid-Glamorgan) Station
-
Maesteg (Ewenny Road) Station
-
Maesteg Station
-
Wildmill Station
-
Pencoed Station
- FAQ
- Price Paid By Year
- Property Type Price
Frequently asked questions about Llangeinor
What is the average price for a property for sale in Llangeinor?
The average price for a property for sale in Llangeinor is £179,239. This amount is 16% lower than the average price in Bridgend. There are 411 property listings for sale in Llangeinor.
What streets have the most expensive properties for sale in Llangeinor?
The streets with the most expensive properties for sale in Llangeinor are Bettws Road at an average of £461,666, Beech Road at an average of £203,375 and Heol Tynton at an average of £185,000.
What streets have the most affordable properties for sale in Llangeinor?
The streets with the most affordable properties for sale in Llangeinor are Mount Pleasant at an average of £75,750, Sweetwells Cottages at an average of £105,000 and The Croft at an average of £106,200.
Which train stations are available in or near Llangeinor?
Some of the train stations available in or near Llangeinor are Tondu, Sarn and Garth (Mid-Glamorgan).
Property Price Paid in Llangeinor by Year
The average sold property price by year was:
| Year | Average Sold Price | Price Change |
Sold Properties
|
|---|---|---|---|
| 2025 | £166,861 | -35% |
9 Properties |
| 2024 | £225,455 | 33% |
18 Properties |
| 2023 | £152,041 | 2% |
12 Properties |
| 2022 | £148,923 | -20% |
13 Properties |
| 2021 | £179,032 | -0,1% |
14 Properties |
| 2020 | £179,124 | 33% |
16 Properties |
| 2019 | £120,608 | -1% |
23 Properties |
| 2018 | £121,942 | -14% |
14 Properties |
| 2017 | £139,150 | 19% |
23 Properties |
| 2016 | £112,696 | 39% |
18 Properties |
| 2015 | £68,363 | -58% |
15 Properties |
| 2014 | £107,811 | -2% |
17 Properties |
| 2013 | £110,444 | -2% |
10 Properties |
| 2012 | £112,125 | -14% |
8 Properties |
| 2011 | £128,000 | 19% |
11 Properties |
| 2010 | £103,888 | -29% |
9 Properties |
| 2009 | £133,565 | 26% |
6 Properties |
| 2008 | £98,794 | -19% |
14 Properties |
| 2007 | £117,136 | 6% |
34 Properties |
| 2006 | £110,605 | 34% |
19 Properties |
| 2005 | £72,774 | 6% |
14 Properties |
| 2004 | £68,631 | 44% |
11 Properties |
| 2003 | £38,544 | 3% |
14 Properties |
| 2002 | £37,579 | -52% |
17 Properties |
| 2001 | £57,219 | 30% |
20 Properties |
| 2000 | £40,168 | 2% |
8 Properties |
| 1999 | £39,438 | 36% |
9 Properties |
| 1998 | £25,195 | -36% |
10 Properties |
| 1997 | £34,263 | -18% |
9 Properties |
| 1996 | £40,333 | 52% |
6 Properties |
| 1995 | £19,250 | - |
8 Properties |
Property Price per Property Type in Llangeinor
Here you can find historic sold price data in order to help with your property search.
The average Property Paid Price for specific property types in the last three years are:
| Property Type | Average Sold Price | Sold Properties |
|---|---|---|
| Semi Detached House | £200,747.00 | 18 Semi Detached Houses |
| Detached House | £392,291.00 | 6 Detached Houses |
| Terraced House | £119,758.00 | 28 Terraced Houses |

