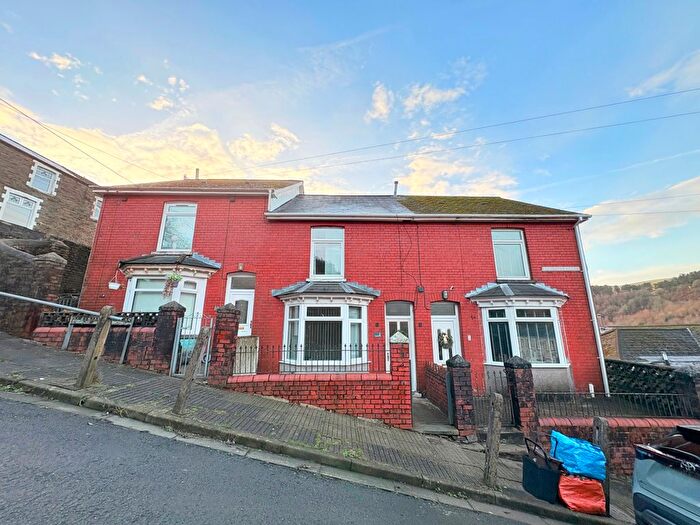
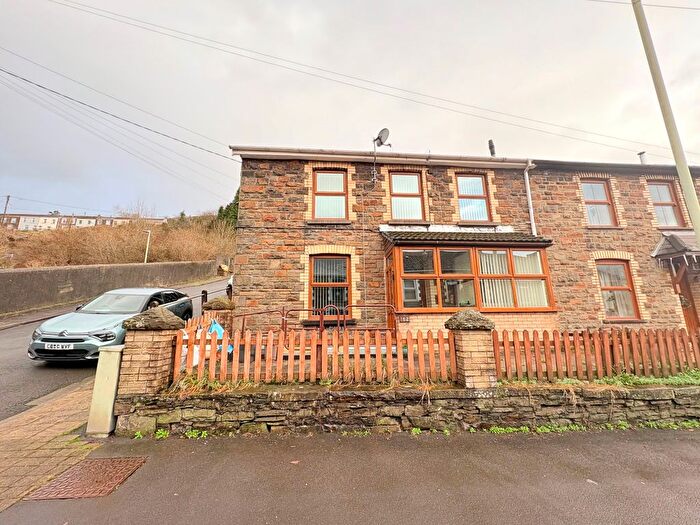
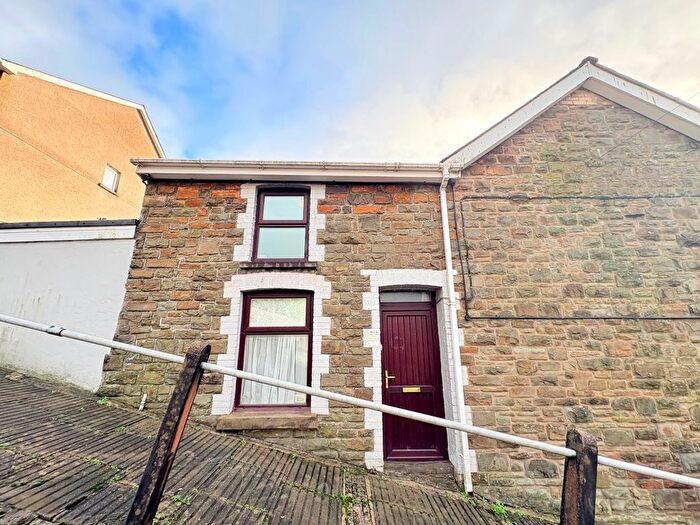
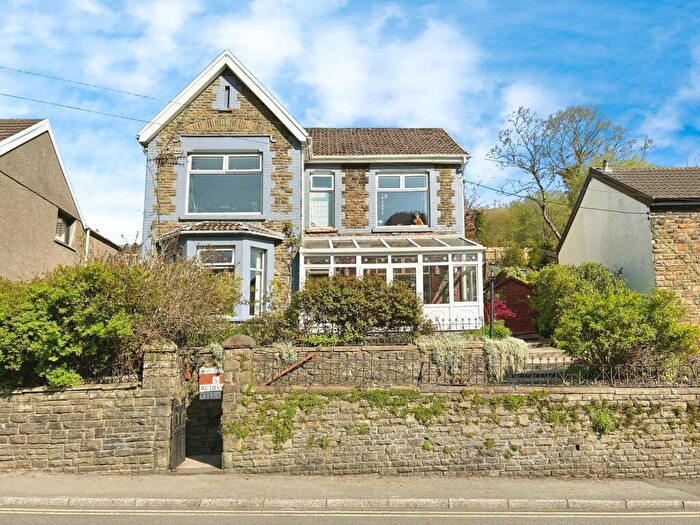
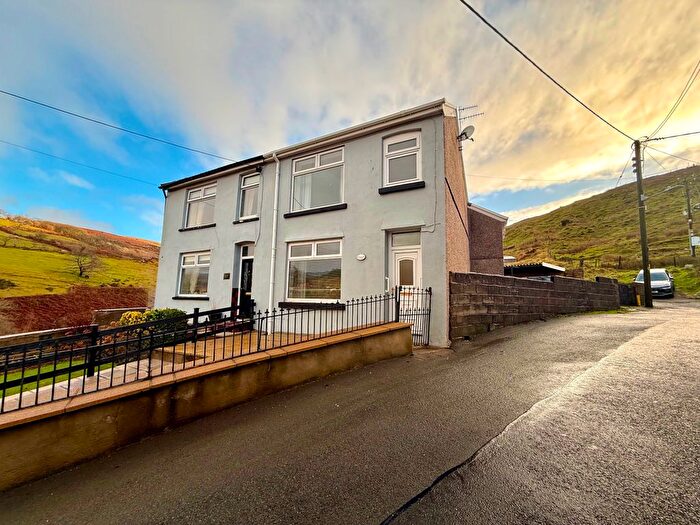
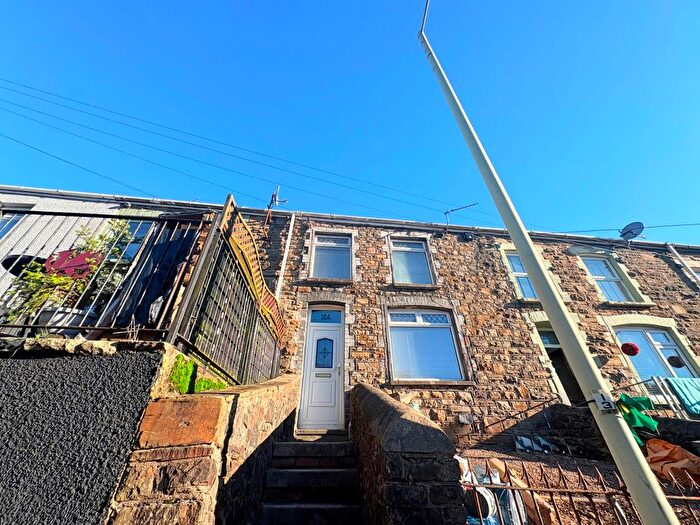
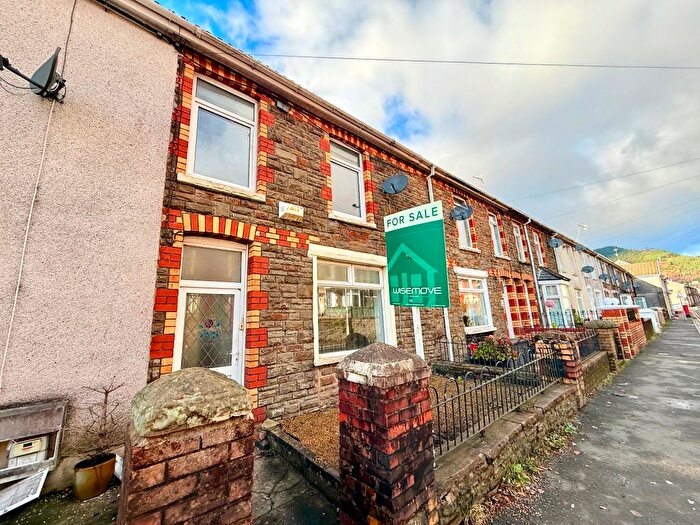
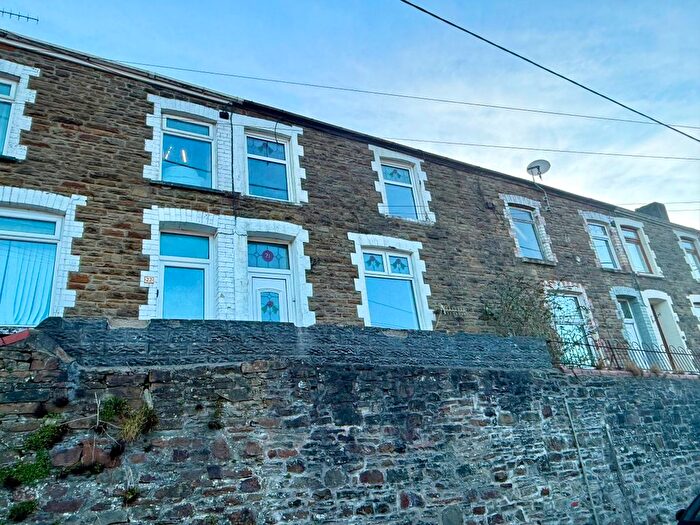
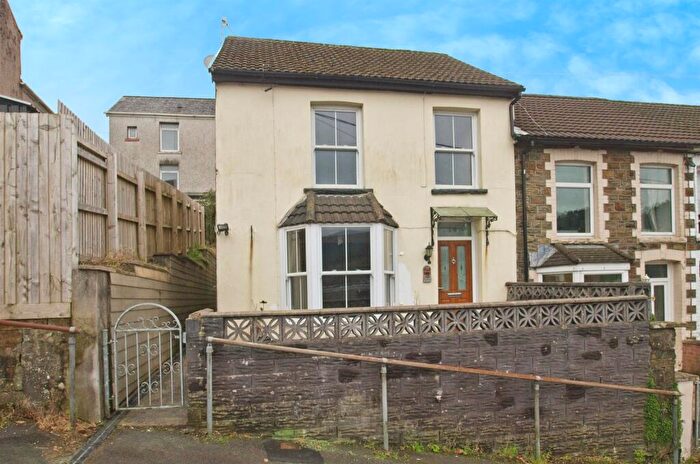
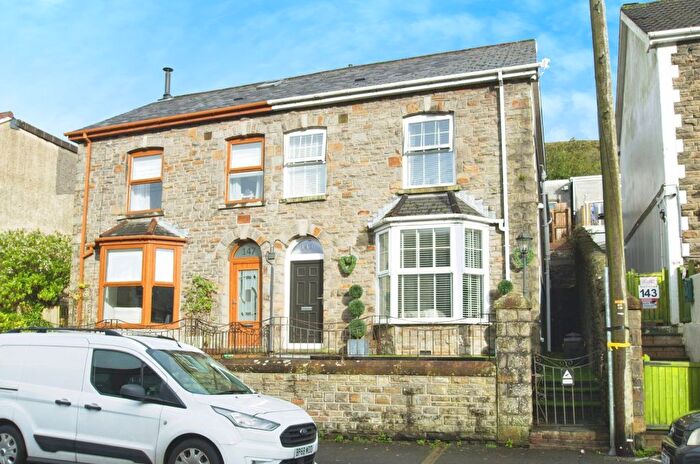
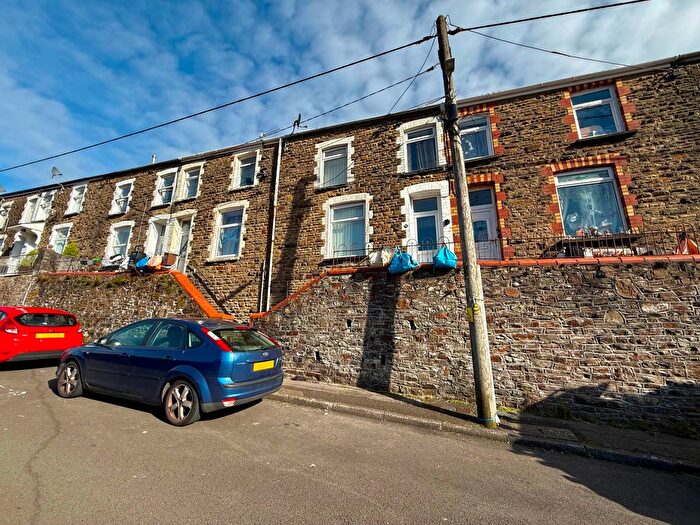
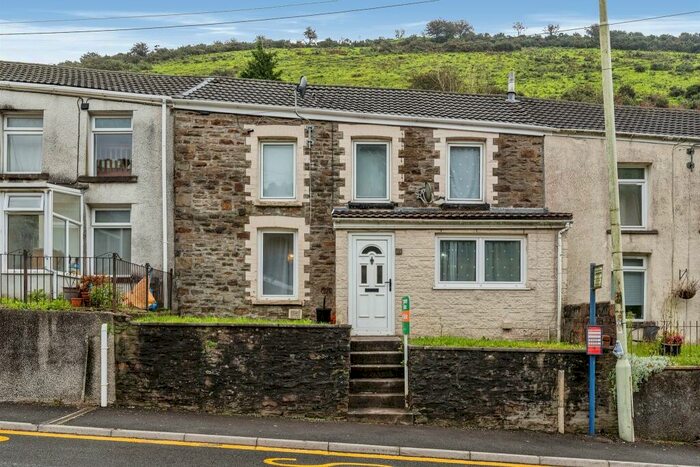
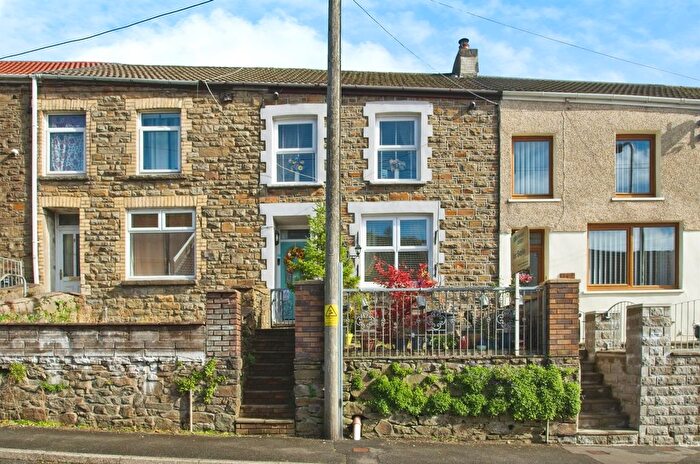
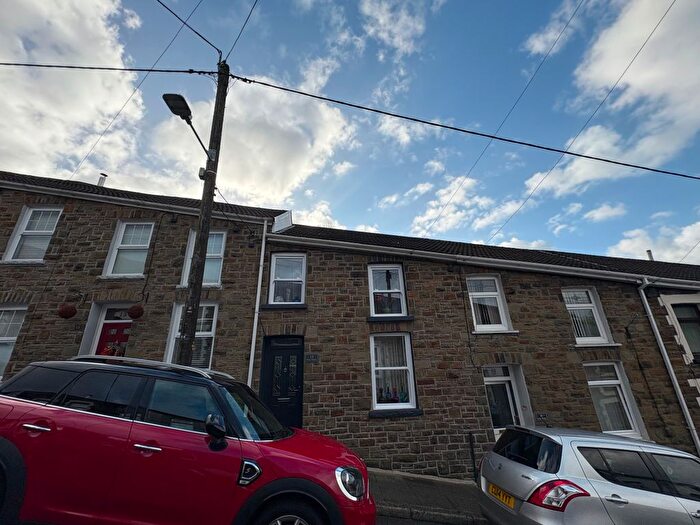
Houses for sale & to rent in Pontycymmer, Bridgend
House Prices in Pontycymmer
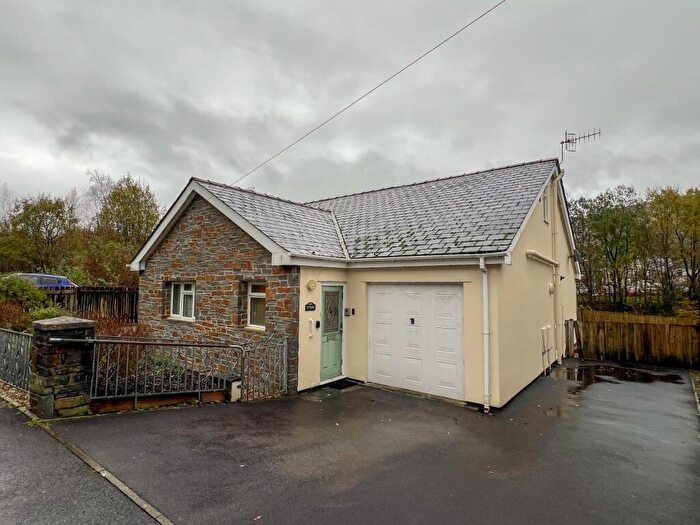
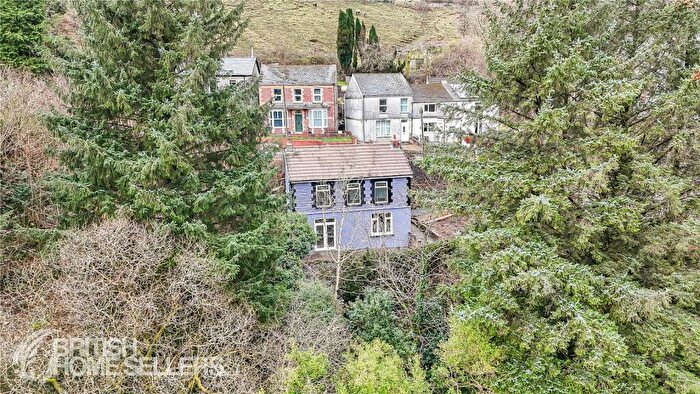
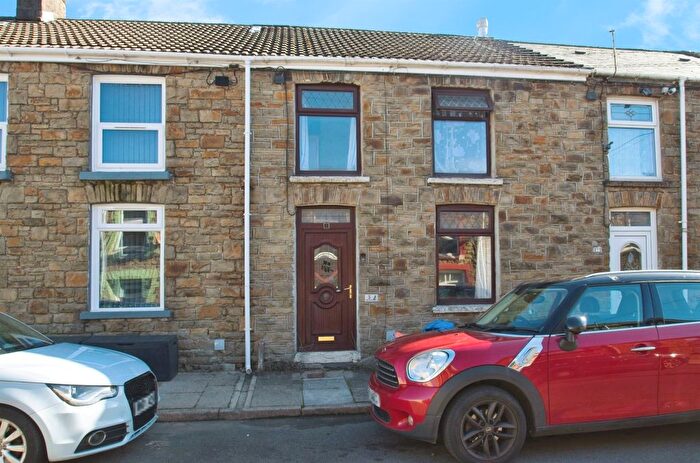
Properties in Pontycymmer have an average house price of £102,905.00 and had 160 Property Transactions within the last 3 years¹.
Pontycymmer is an area in Bridgend, Pen-y-bont ar Ogwr - Bridgend with 1,075 households², where the most expensive property was sold for £357,500.00.
Properties for sale in Pontycymmer
Previously listed properties in Pontycymmer
Roads and Postcodes in Pontycymmer
Navigate through our locations to find the location of your next house in Pontycymmer, Bridgend for sale or to rent.
| Streets | Postcodes |
|---|---|
| Albany Road | CF32 8HE |
| Alexandra Road | CF32 8HA CF32 8HB |
| Blandy Terrace | CF32 8LD |
| Braich Y Cymer Road | CF32 8EP |
| Bridgend Road | CF32 8EH |
| Brynhyfryd | CF32 8HP |
| Chapel Street | CF32 8EG |
| Church Street | CF32 8LB |
| Cuckoo Street | CF32 8DR |
| Federation Lane | CF32 8LQ |
| Fenton Place | CF32 8DN |
| Ffaldau Industrial Estate | CF32 8NQ |
| Ffaldau Villas | CF32 8NP |
| Garreg Road | CF32 8EL |
| Gerddi'r Bryn | CF32 8LF |
| Gloucester Buildings | CF32 8DW |
| Green Hill | CF32 8EW |
| Gwaun Bant | CF32 8LN |
| High Street | CF32 8HY |
| Hill View | CF32 8LU |
| Ivor Street | CF32 8HW |
| Lower Adare Street | CF32 8LW |
| Lower Church Street | CF32 8LA |
| Meadow Street | CF32 8HF CF32 8HG |
| Mount Pleasant | CF32 8EN |
| Nant Yr Ychain Terrace | CF32 8DL |
| New Street | CF32 8DP |
| Oxford Street | CF32 8DB CF32 8DD CF32 8DE CF32 8DF CF32 8DG CF32 8LL CF32 8DA |
| Pant Street | CF32 8DY |
| Pant Y Gog | CF32 8DU |
| Park Street | CF32 8HD |
| Prospect Place | CF32 8EE |
| Railway Terrace | CF32 8EB |
| Richard Street | CF32 8HU |
| School Terrace | CF32 8HT |
| South View | CF32 8LE |
| St David Street | CF32 8LT |
| Stable Lane | CF32 8DQ |
| The Avenue | CF32 8LY CF32 8NA |
| Thornton Crescent | CF32 8DT |
| Upper Adare Street | CF32 8LP CF32 8LS |
| Victoria Street | CF32 8NB CF32 8NN CF32 8NW CF32 8LR |
| William Street | CF32 8EF |
| Yr Hafan | CF32 8DS |
| CF32 8ER CF32 8AZ CF32 8DH CF32 8EA CF32 8ES CF32 8HN CF32 8HR CF32 8HS |
Transport near Pontycymmer
-
Garth (Mid-Glamorgan) Station
-
Maesteg (Ewenny Road) Station
-
Maesteg Station
-
Tondu Station
-
Ynyswen Station
-
Treorchy Station
-
Treherbert Station
-
Ton Pentre Station
-
Sarn Station
- FAQ
- Price Paid By Year
- Property Type Price
Frequently asked questions about Pontycymmer
What is the average price for a property for sale in Pontycymmer?
The average price for a property for sale in Pontycymmer is £102,905. This amount is 52% lower than the average price in Bridgend. There are 315 property listings for sale in Pontycymmer.
What streets have the most expensive properties for sale in Pontycymmer?
The streets with the most expensive properties for sale in Pontycymmer are Church Street at an average of £180,000, Alexandra Road at an average of £143,000 and Albany Road at an average of £126,700.
What streets have the most affordable properties for sale in Pontycymmer?
The streets with the most affordable properties for sale in Pontycymmer are Nant Yr Ychain Terrace at an average of £64,999, Pant Y Gog at an average of £69,500 and Upper Adare Street at an average of £72,749.
Which train stations are available in or near Pontycymmer?
Some of the train stations available in or near Pontycymmer are Garth (Mid-Glamorgan), Maesteg (Ewenny Road) and Maesteg.
Property Price Paid in Pontycymmer by Year
The average sold property price by year was:
| Year | Average Sold Price | Price Change |
Sold Properties
|
|---|---|---|---|
| 2025 | £115,809 | 11% |
25 Properties |
| 2024 | £103,057 | 1% |
35 Properties |
| 2023 | £101,592 | 3% |
37 Properties |
| 2022 | £98,472 | -1% |
63 Properties |
| 2021 | £99,003 | 12% |
59 Properties |
| 2020 | £87,575 | 5% |
47 Properties |
| 2019 | £83,624 | 4% |
39 Properties |
| 2018 | £80,280 | 14% |
46 Properties |
| 2017 | £69,048 | -12% |
36 Properties |
| 2016 | £77,443 | 13% |
41 Properties |
| 2015 | £67,460 | -12% |
46 Properties |
| 2014 | £75,578 | 21% |
50 Properties |
| 2013 | £59,358 | -2% |
36 Properties |
| 2012 | £60,826 | -13% |
23 Properties |
| 2011 | £69,036 | -3% |
27 Properties |
| 2010 | £70,869 | 2% |
30 Properties |
| 2009 | £69,458 | -21% |
22 Properties |
| 2008 | £84,329 | 9% |
36 Properties |
| 2007 | £77,123 | 4% |
72 Properties |
| 2006 | £74,407 | 9% |
78 Properties |
| 2005 | £67,714 | 24% |
44 Properties |
| 2004 | £51,448 | 36% |
52 Properties |
| 2003 | £32,806 | 11% |
68 Properties |
| 2002 | £29,354 | 18% |
53 Properties |
| 2001 | £23,982 | 3% |
68 Properties |
| 2000 | £23,365 | 4% |
31 Properties |
| 1999 | £22,390 | 0,1% |
31 Properties |
| 1998 | £22,358 | -22% |
23 Properties |
| 1997 | £27,352 | 14% |
24 Properties |
| 1996 | £23,463 | -8% |
30 Properties |
| 1995 | £25,268 | - |
22 Properties |
Property Price per Property Type in Pontycymmer
Here you can find historic sold price data in order to help with your property search.
The average Property Paid Price for specific property types in the last three years are:
| Property Type | Average Sold Price | Sold Properties |
|---|---|---|
| Semi Detached House | £125,071.00 | 14 Semi Detached Houses |
| Detached House | £239,833.00 | 3 Detached Houses |
| Terraced House | £97,863.00 | 143 Terraced Houses |

