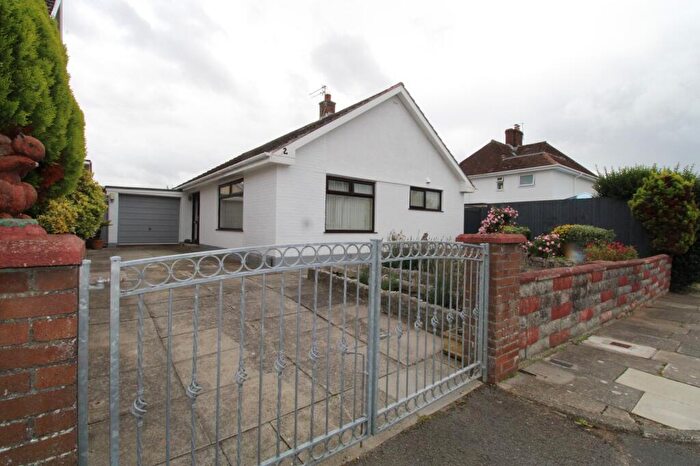
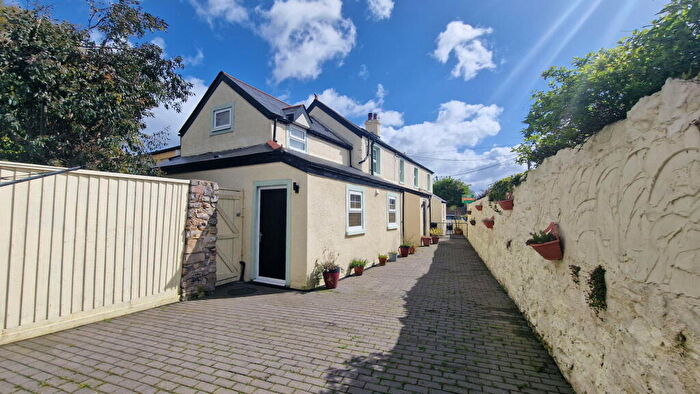
Houses for sale & to rent in Newton, Porthcawl
House Prices in Newton
Properties in Newton have an average house price of £370,248.00 and had 192 Property Transactions within the last 3 years¹.
Newton is an area in Porthcawl, Pen-y-bont ar Ogwr - Bridgend with 1,461 households², where the most expensive property was sold for £910,000.00.
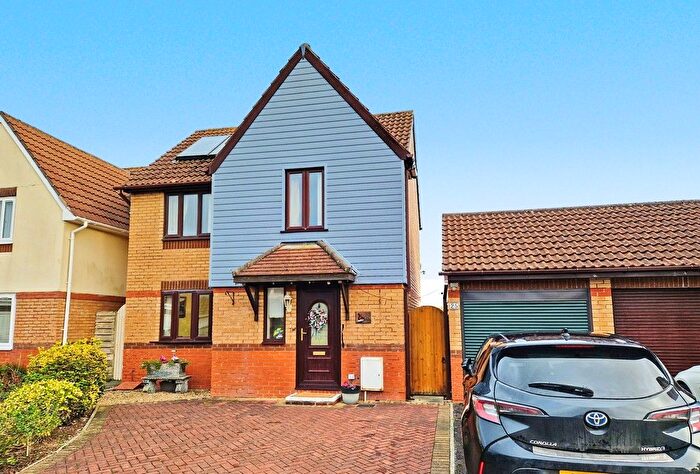
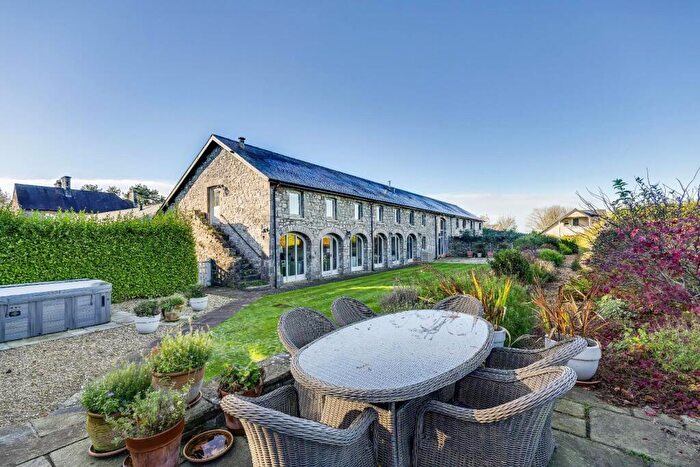
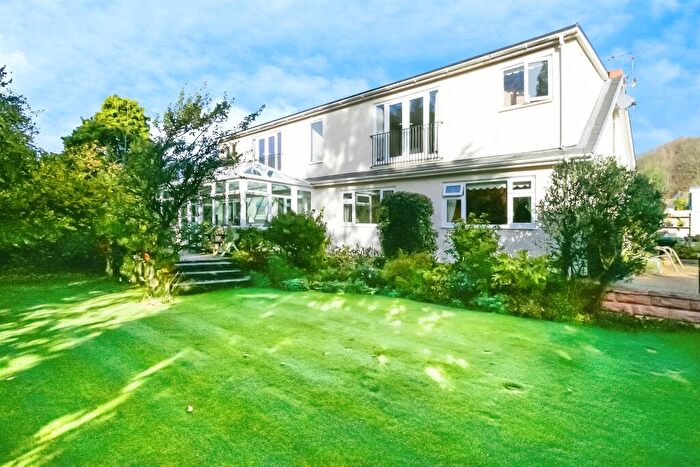
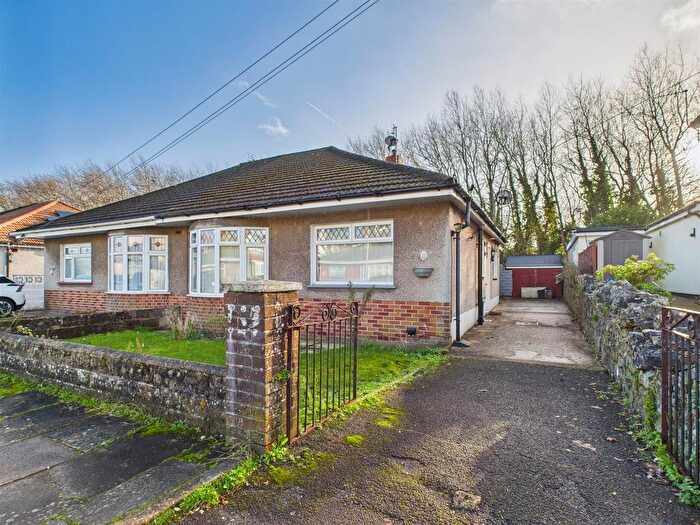
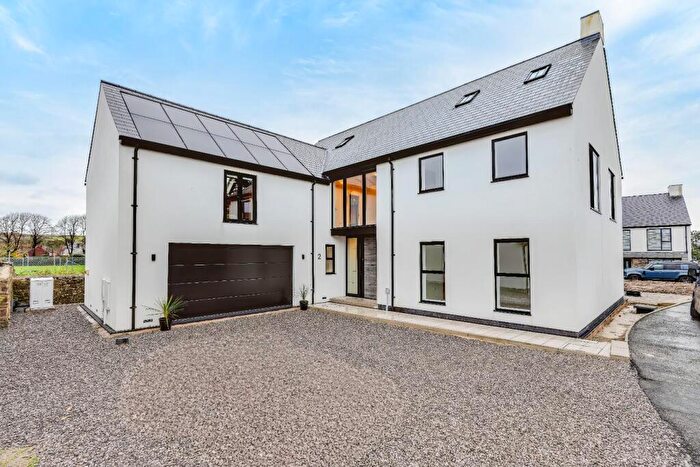
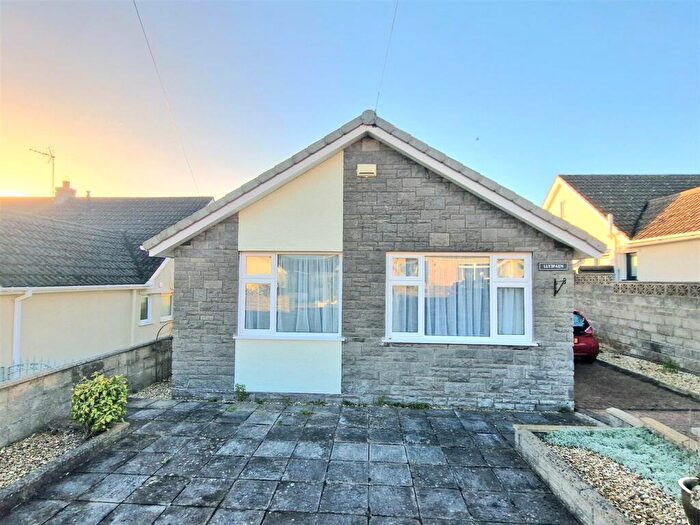
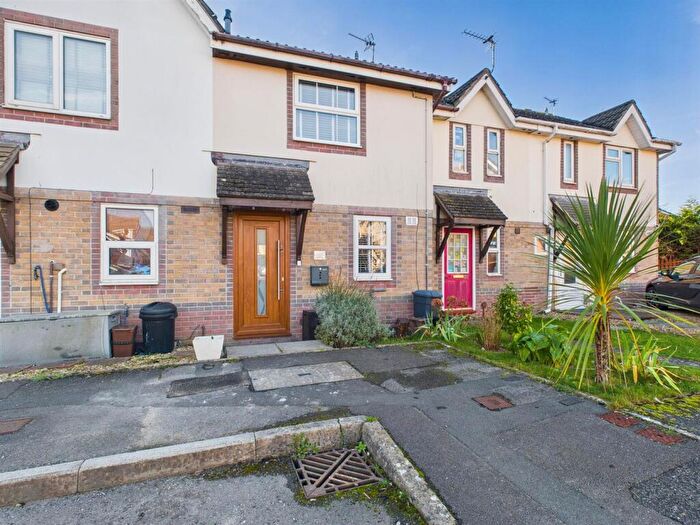
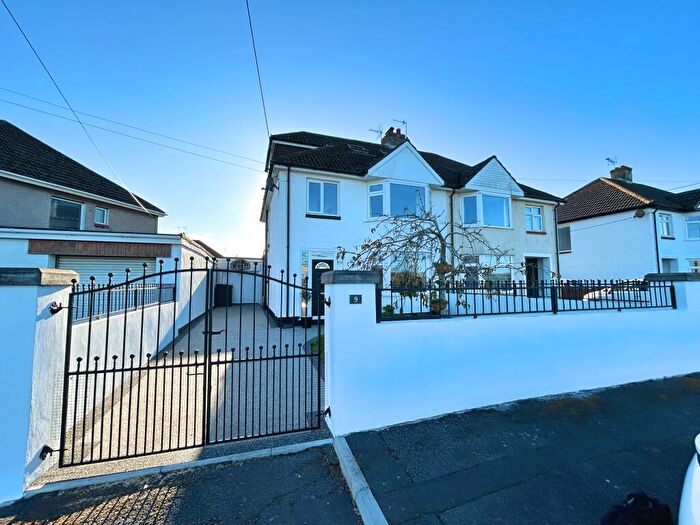
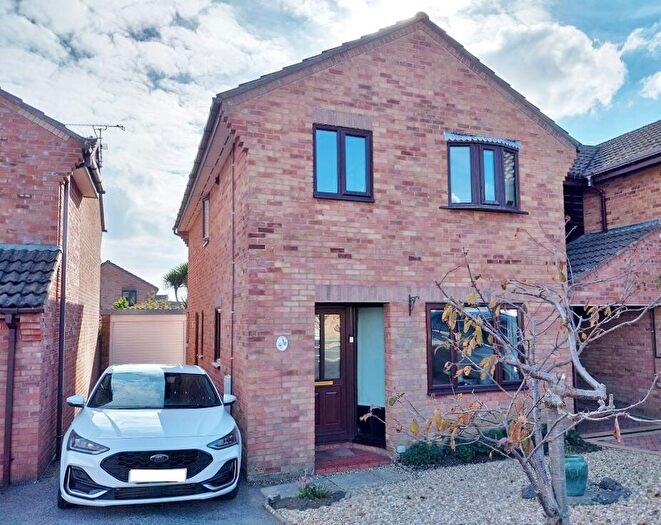
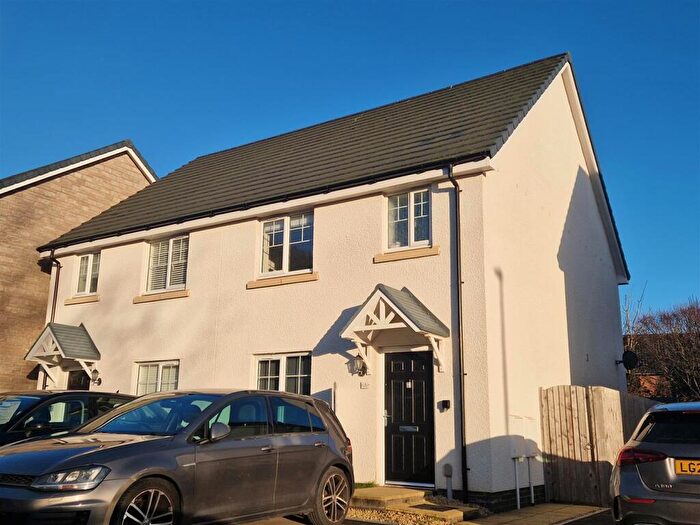
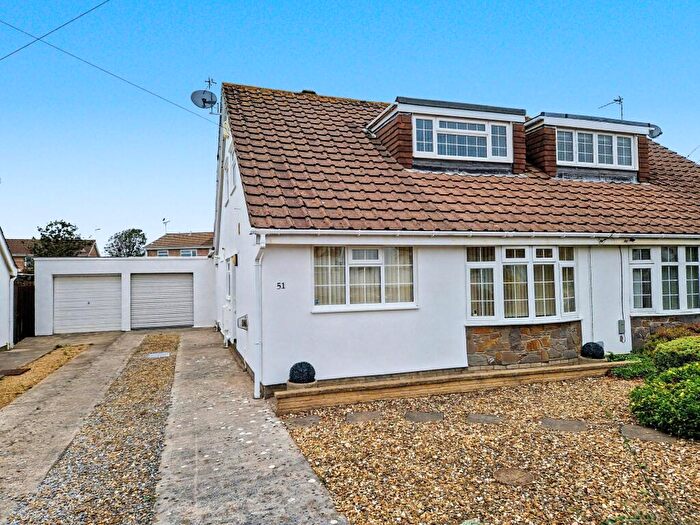
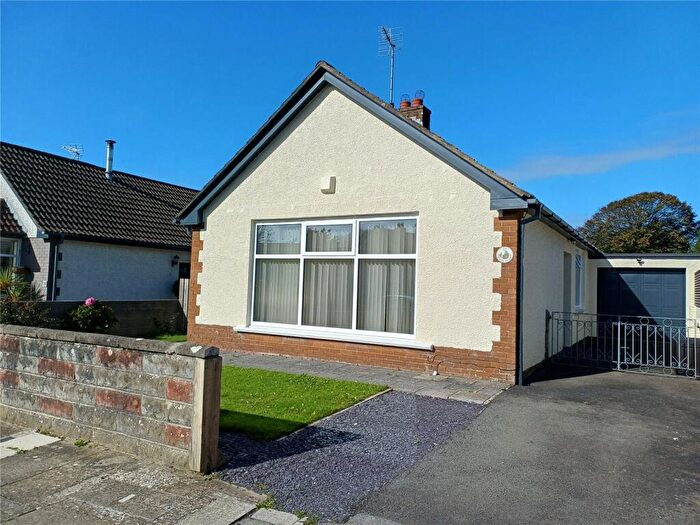
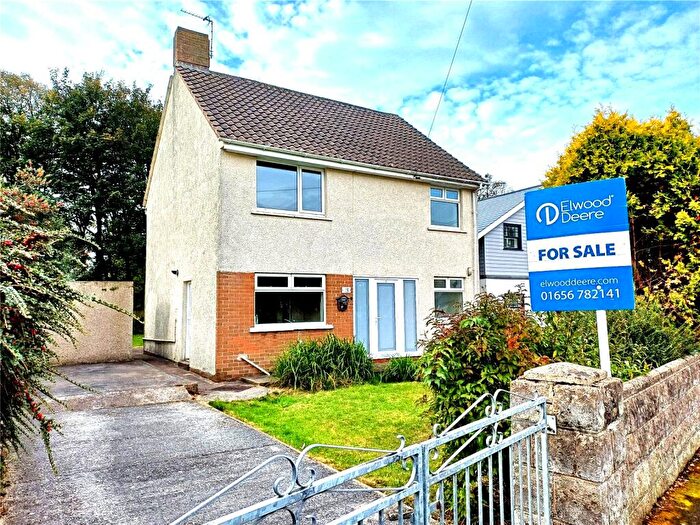
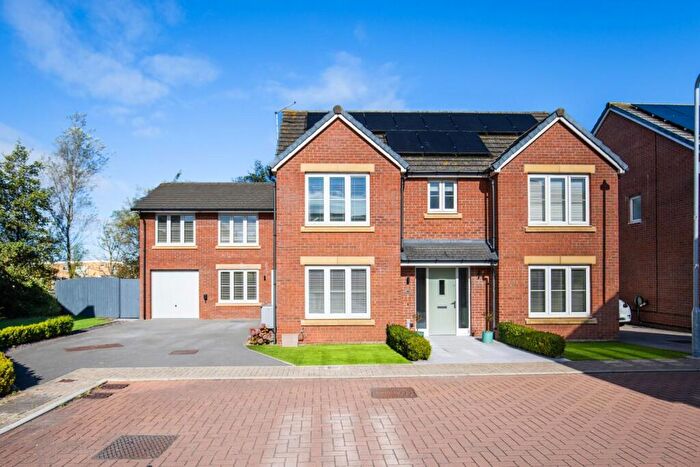
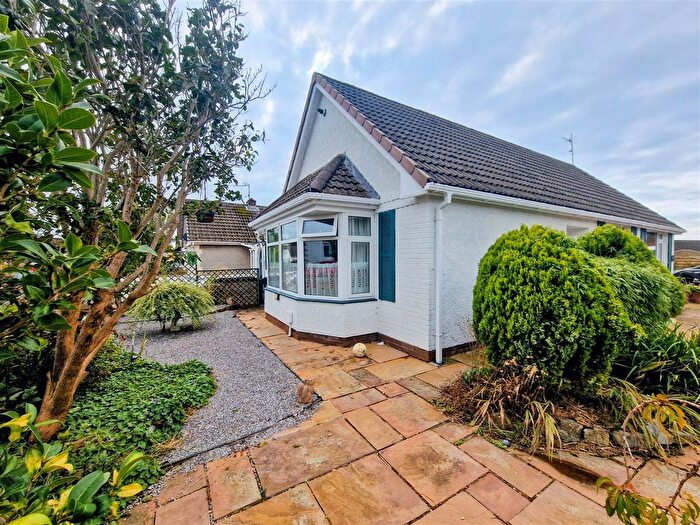
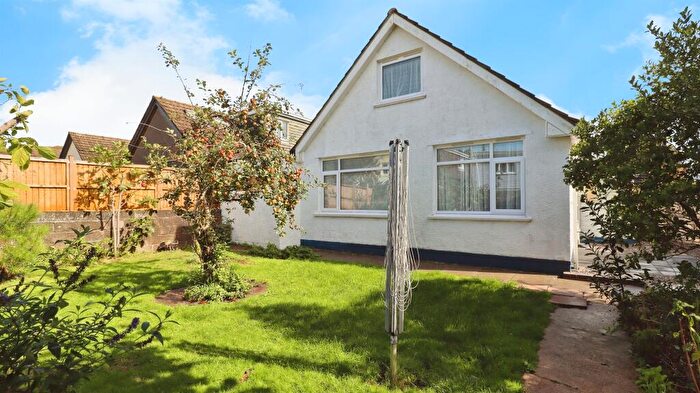
Properties for sale in Newton
Roads and Postcodes in Newton
Navigate through our locations to find the location of your next house in Newton, Porthcawl for sale or to rent.
| Streets | Postcodes |
|---|---|
| Acacia Avenue | CF36 5BJ |
| Aldenham Road | CF36 5PG |
| Alison Court | CF36 5SA |
| Arosfa Avenue | CF36 5AH |
| Ashgrove | CF36 5AW |
| Austin Avenue | CF36 5RS |
| Austin Close | CF36 5SN |
| Bay View Road | CF36 5NF CF36 5NG |
| Beach Road | CF36 5NE CF36 5NH |
| Beech Grove | CF36 5DP |
| Birch Walk | CF36 5AN |
| Brickyard | CF36 5PP |
| Bridgend Road | CF36 5RL CF36 5RN CF36 5SQ |
| Bryneglwys Avenue | CF36 5NN |
| Bryneglwys Gardens | CF36 5PR |
| Cedar Gardens | CF36 5AF |
| Cherry Tree Avenue | CF36 5RD |
| Chestnut Drive | CF36 5AD |
| Church Street | CF36 5NP CF36 5PD |
| Clevis Crescent | CF36 5NY CF36 5PA |
| Clevis Hill | CF36 5NT |
| Clevis Lane | CF36 5NS CF36 5NR |
| Clevisfield Avenue | CF36 5NU |
| Cleviston Gardens | CF36 5RW |
| Clos Y Mametz | CF36 5DJ |
| Cypress Gardens | CF36 5BZ |
| Danygraig Avenue | CF36 5AA CF36 5AE |
| Elder Drive | CF36 5RH |
| Elm Road | CF36 5AG |
| Ffordd Austin | CF36 5BF |
| Greyfriars House | CF36 5PJ |
| Hawthorn Place | CF36 5AS |
| Hazel Close | CF36 5RG |
| Heol Y Graig | CF36 5PB CF36 5PN |
| Holly Walk | CF36 5AP |
| Hookland Road | CF36 5SE CF36 5SF CF36 5SG |
| Juniper Close | CF36 5BX |
| Laburnum Drive | CF36 5UA |
| Larch Close | CF36 5AQ |
| Lime Tree Way | CF36 5AU |
| Linden Way | CF36 5AR |
| Manor Grove | CF36 5HD |
| Maple Walk | CF36 5AY |
| Mayfield Avenue | CF36 5NL |
| New Road | CF36 5BA CF36 5BE CF36 5PH CF36 5PL |
| New Road Court | CF36 5DQ |
| Newton Nottage Road | CF36 5PF CF36 5RP CF36 5RR CF36 5PE |
| Oakengates | CF36 5RE |
| Oaktree Drive | CF36 5BQ |
| Orchard Drive | CF36 5RA CF36 5RB CF36 5RF |
| Pine Close | CF36 5NX |
| Rowan Drive | CF36 5AT |
| St Annes Crescent | CF36 5BD |
| St Christophers Road | CF36 5RU CF36 5RY |
| St Johns Drive | CF36 5PW |
| St Marys Court | CF36 5SD |
| St Michaels Road | CF36 5SB |
| Sycamore Avenue | CF36 5AL |
| The Burrows | CF36 5AJ |
| The Firs | CF36 5AX |
| Tynycaeau Lane | CF36 5SU |
| Waun Lon | CF36 5RT |
| Willow Close | CF36 5AB |
| CF36 5SP CF36 5SY CF36 5SR CF36 5SS CF36 5ST |
Transport near Newton
- FAQ
- Price Paid By Year
- Property Type Price
Frequently asked questions about Newton
What is the average price for a property for sale in Newton?
The average price for a property for sale in Newton is £370,248. This amount is 11% higher than the average price in Porthcawl. There are 550 property listings for sale in Newton.
What streets have the most expensive properties for sale in Newton?
The streets with the most expensive properties for sale in Newton are The Firs at an average of £525,000, The Burrows at an average of £521,666 and Danygraig Avenue at an average of £511,049.
What streets have the most affordable properties for sale in Newton?
The streets with the most affordable properties for sale in Newton are Waun Lon at an average of £130,000, Acacia Avenue at an average of £207,500 and Oaktree Drive at an average of £218,333.
Which train stations are available in or near Newton?
Some of the train stations available in or near Newton are Pyle, Bridgend and Wildmill.
Property Price Paid in Newton by Year
The average sold property price by year was:
| Year | Average Sold Price | Price Change |
Sold Properties
|
|---|---|---|---|
| 2025 | £364,420 | -4% |
35 Properties |
| 2024 | £380,304 | 2% |
41 Properties |
| 2023 | £374,018 | 3% |
50 Properties |
| 2022 | £364,235 | 7% |
66 Properties |
| 2021 | £339,806 | 16% |
65 Properties |
| 2020 | £284,627 | 4% |
38 Properties |
| 2019 | £273,492 | 10% |
69 Properties |
| 2018 | £245,618 | -3% |
73 Properties |
| 2017 | £252,209 | 3% |
82 Properties |
| 2016 | £245,340 | 8% |
84 Properties |
| 2015 | £225,826 | -1% |
76 Properties |
| 2014 | £228,357 | -0,2% |
59 Properties |
| 2013 | £228,705 | 7% |
55 Properties |
| 2012 | £213,744 | 3% |
47 Properties |
| 2011 | £207,699 | 2% |
56 Properties |
| 2010 | £203,567 | -2% |
42 Properties |
| 2009 | £208,533 | -3% |
53 Properties |
| 2008 | £213,894 | -4% |
39 Properties |
| 2007 | £222,423 | 6% |
98 Properties |
| 2006 | £209,172 | 1% |
68 Properties |
| 2005 | £207,200 | 18% |
45 Properties |
| 2004 | £169,178 | 13% |
53 Properties |
| 2003 | £146,408 | 26% |
68 Properties |
| 2002 | £108,286 | 11% |
95 Properties |
| 2001 | £95,877 | 6% |
84 Properties |
| 2000 | £89,738 | 1% |
74 Properties |
| 1999 | £88,967 | 8% |
82 Properties |
| 1998 | £81,902 | -1% |
62 Properties |
| 1997 | £82,992 | 11% |
83 Properties |
| 1996 | £74,041 | 5% |
68 Properties |
| 1995 | £70,435 | - |
70 Properties |
Property Price per Property Type in Newton
Here you can find historic sold price data in order to help with your property search.
The average Property Paid Price for specific property types in the last three years are:
| Property Type | Average Sold Price | Sold Properties |
|---|---|---|
| Semi Detached House | £331,918.00 | 59 Semi Detached Houses |
| Detached House | £421,375.00 | 104 Detached Houses |
| Terraced House | £277,395.00 | 24 Terraced Houses |
| Flat | £204,800.00 | 5 Flats |

