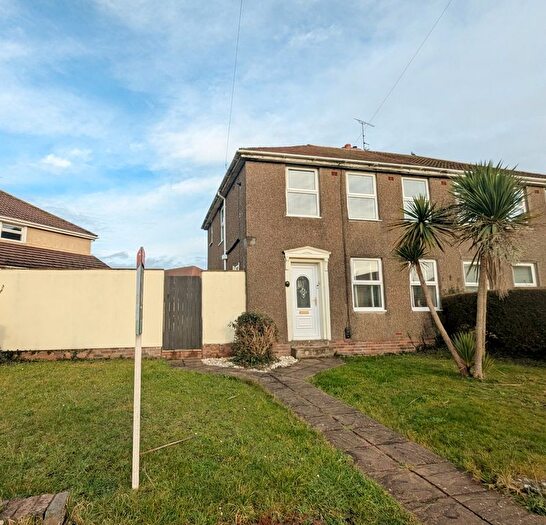
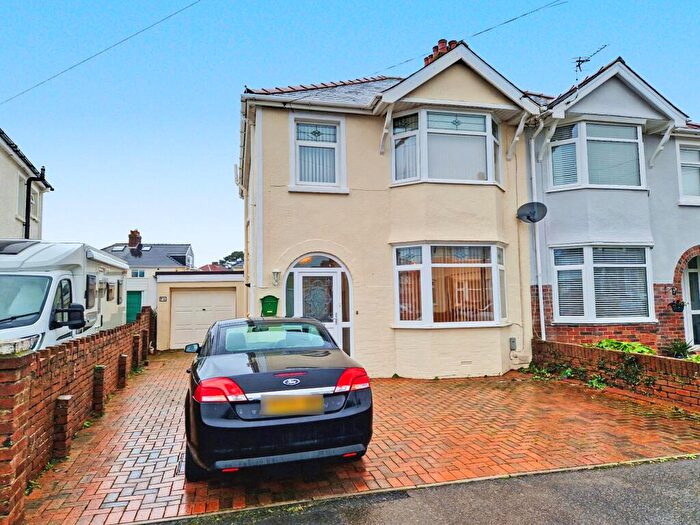
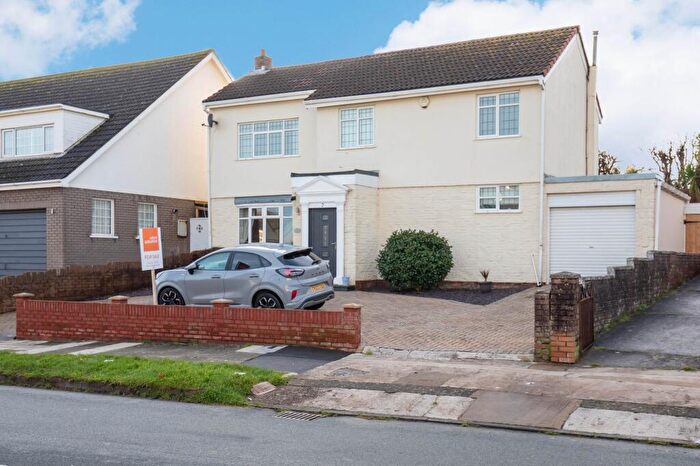
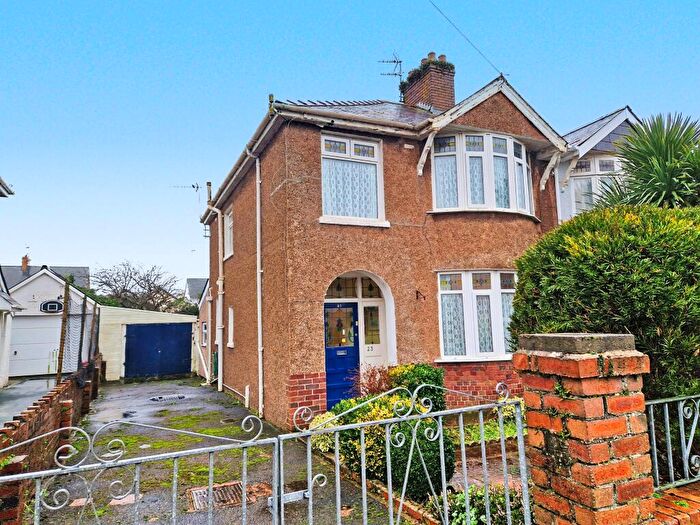
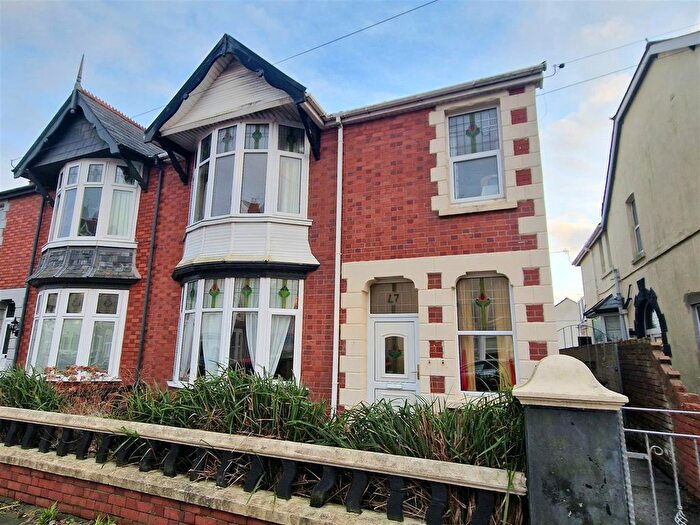
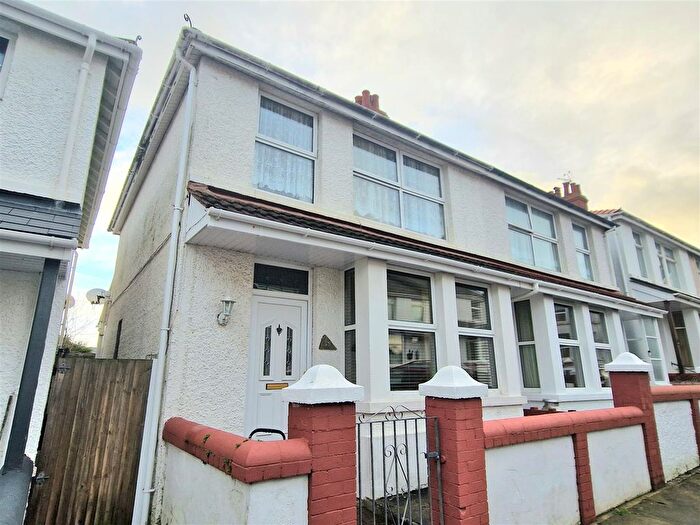
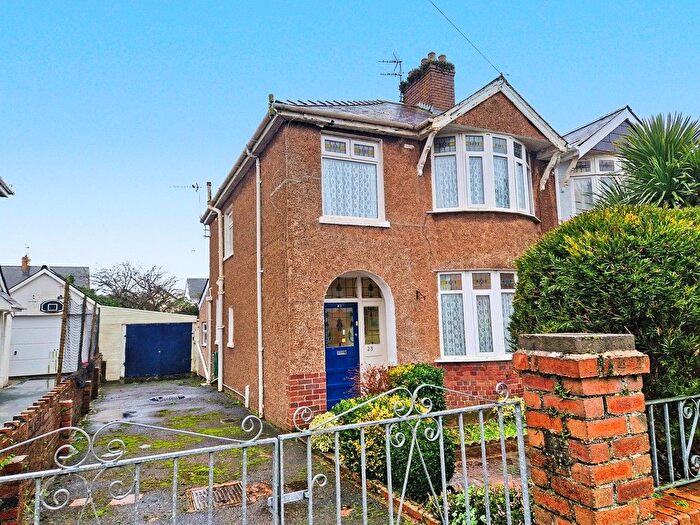
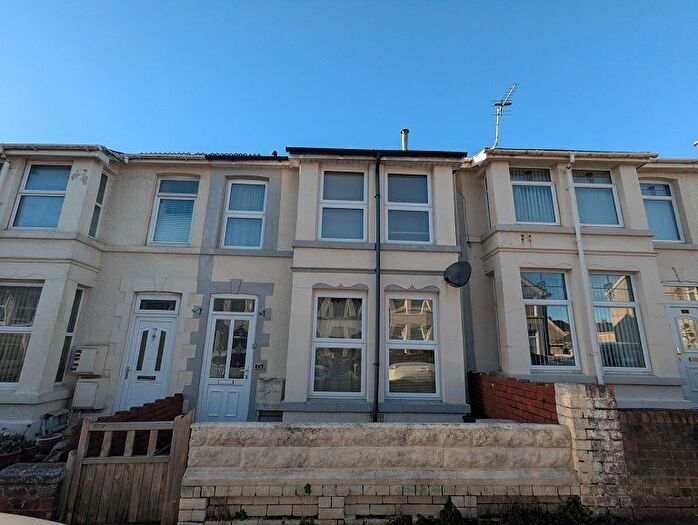
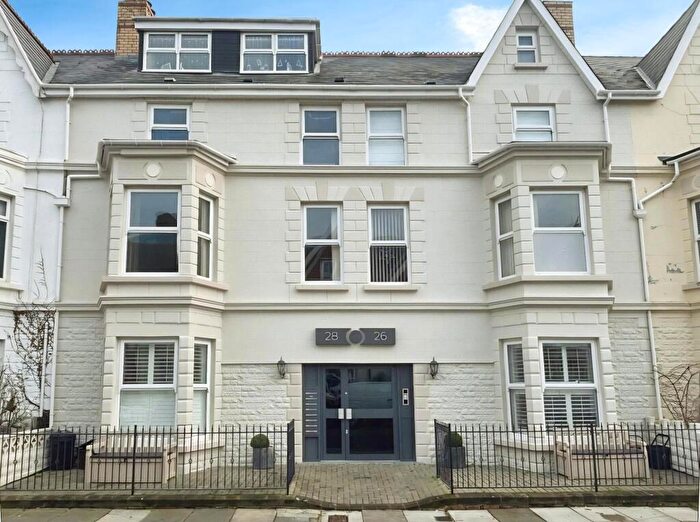
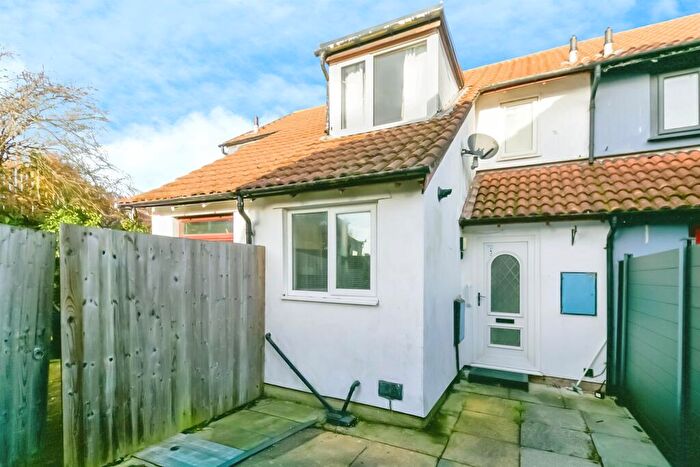
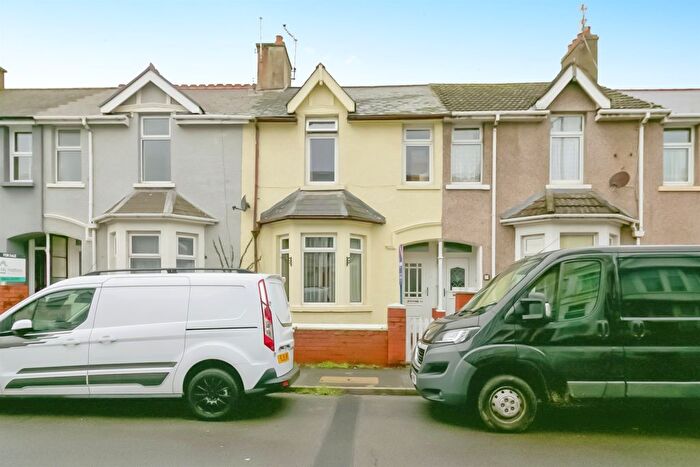
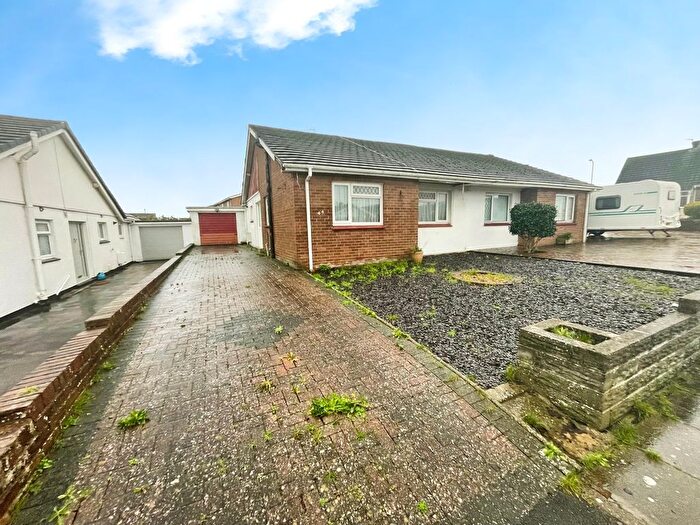
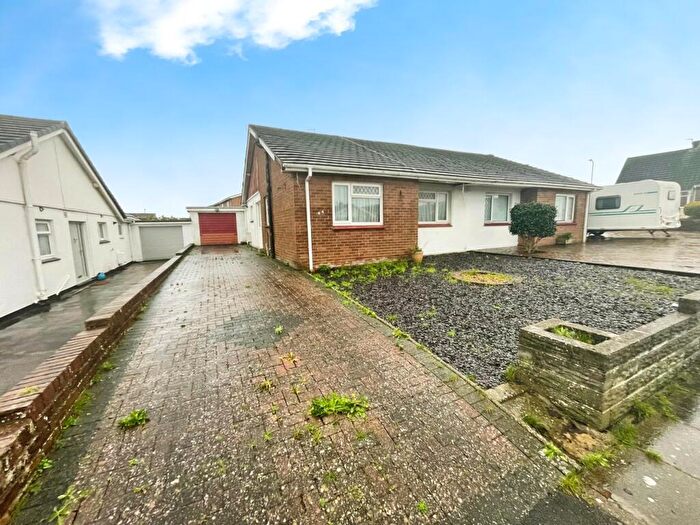
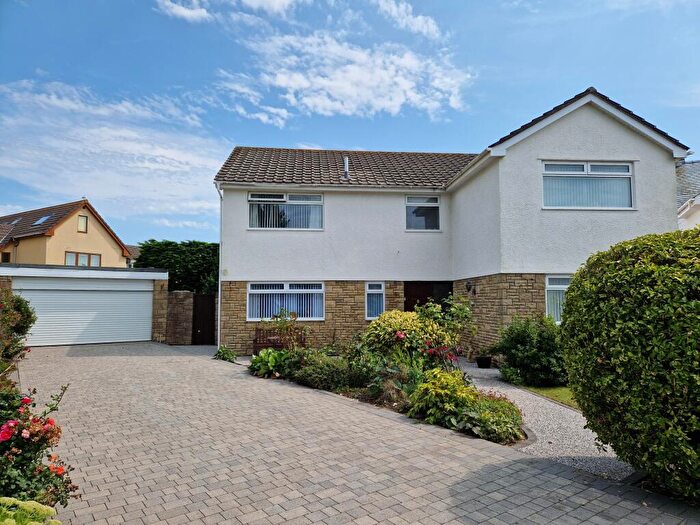
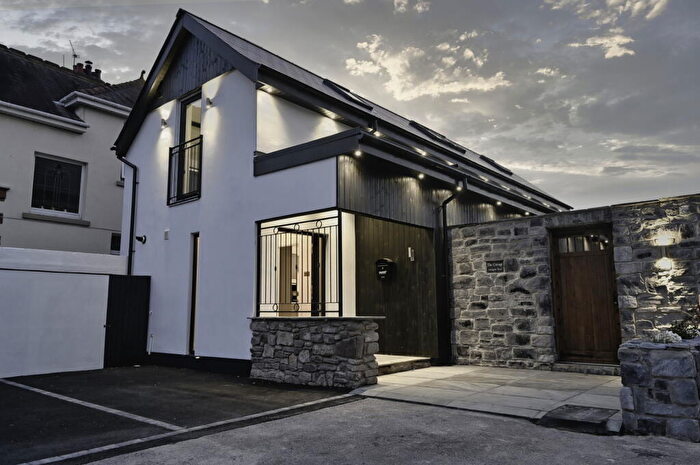
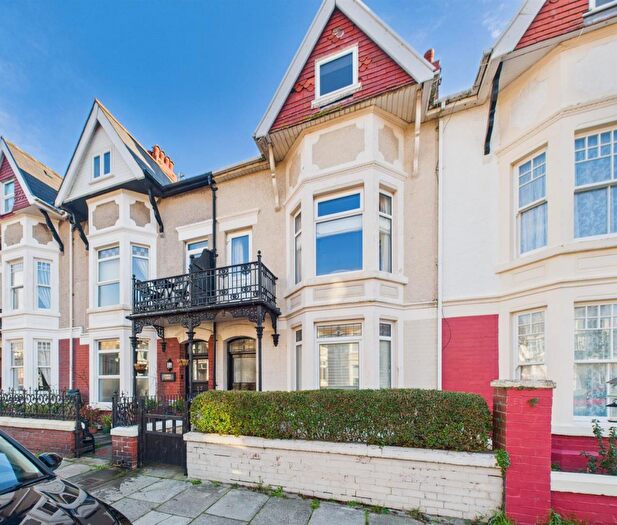
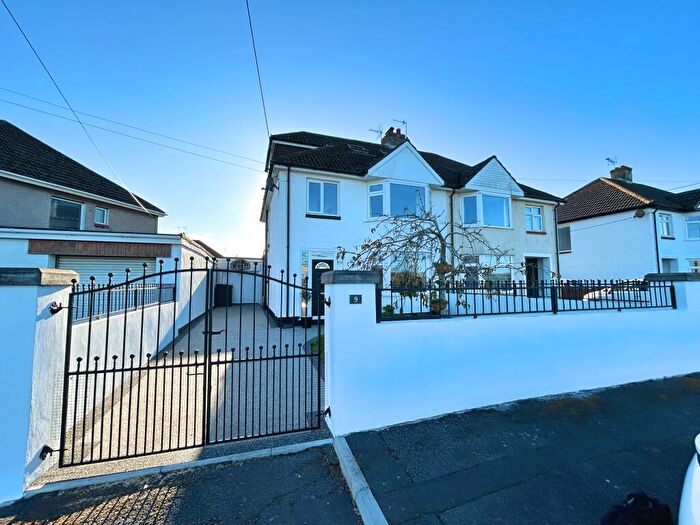
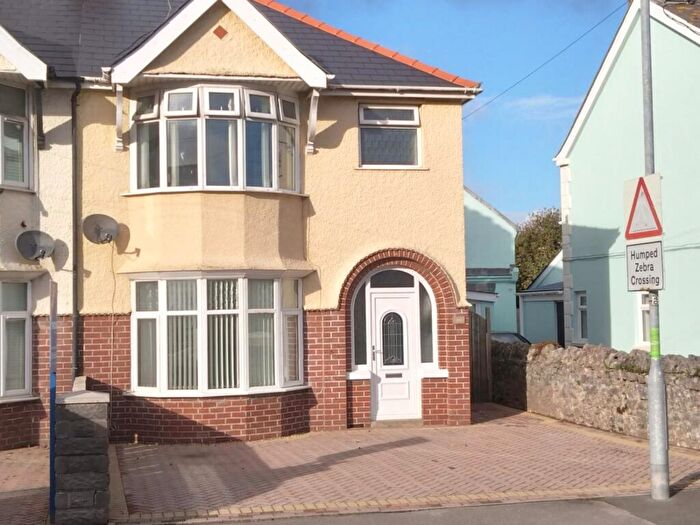
Houses for sale & to rent in Porthcawl East Central, Porthcawl
House Prices in Porthcawl East Central
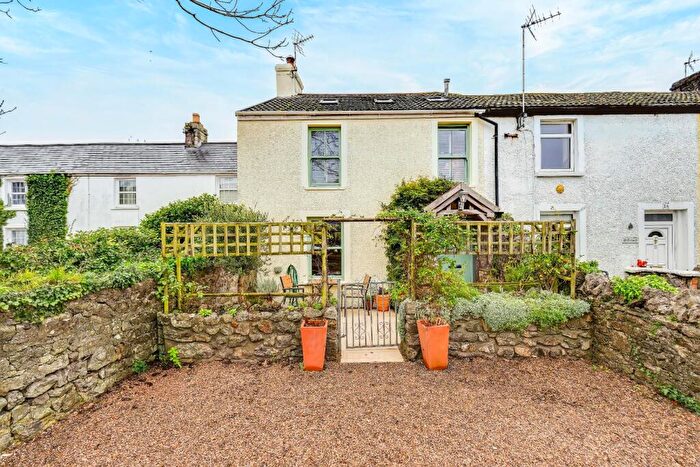
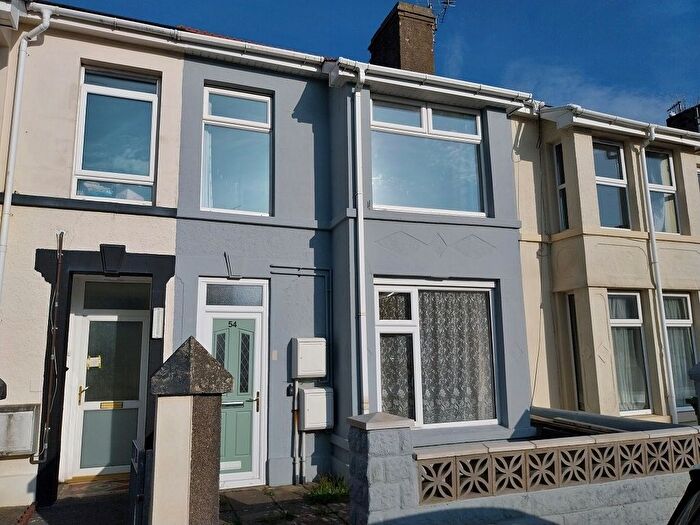
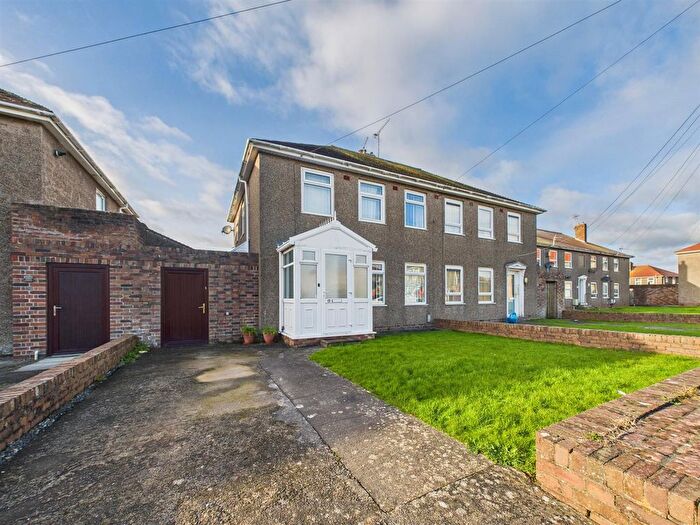
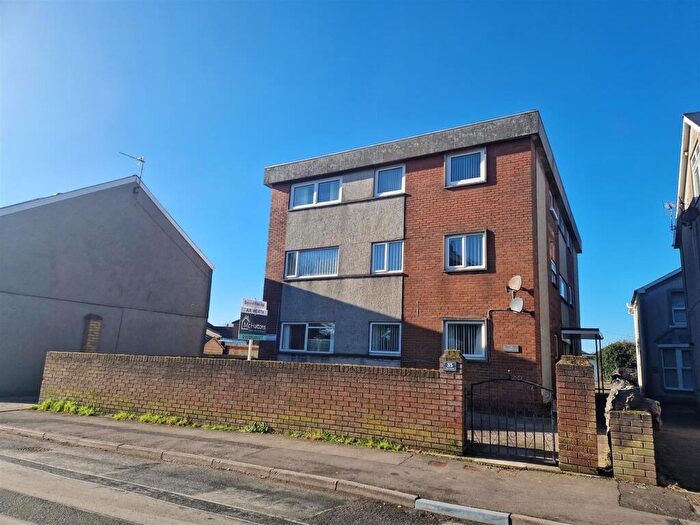
Properties in Porthcawl East Central have an average house price of £232,327.00 and had 168 Property Transactions within the last 3 years¹.
Porthcawl East Central is an area in Porthcawl, Pen-y-bont ar Ogwr - Bridgend with 1,516 households², where the most expensive property was sold for £455,000.00.
Properties for sale in Porthcawl East Central
Roads and Postcodes in Porthcawl East Central
Navigate through our locations to find the location of your next house in Porthcawl East Central, Porthcawl for sale or to rent.
| Streets | Postcodes |
|---|---|
| Brian Crescent | CF36 5LE |
| Bungalow Avenue | CF36 5BS |
| Cilparc | CF36 5ET |
| Eastern Promenade | CF36 5TS |
| Georgian Close | CF36 5NB |
| Ger Y Lyn | CF36 5ND |
| Glan Road | CF36 5DF |
| Greenways | CF36 5EP CF36 5ER |
| Heol Fair | CF36 5LA |
| Heol Y Goedwig | CF36 5DT CF36 5DU CF36 5DY |
| Hutchwns Terrace | CF36 5TN |
| Kings Hill Avenue | CF36 5LD |
| Lake View Close | CF36 5NA |
| Mackworth Road | CF36 5BP CF36 5BT CF36 5BY |
| Marlpit Lane | CF36 5EG |
| Meadow Lane | CF36 5EU CF36 5EY |
| Neville Road | CF36 5LW |
| New Road | CF36 5BG CF36 5BH CF36 5BL CF36 5BN CF36 5DD CF36 5DE CF36 5DG CF36 5DH CF36 5DL CF36 5DN CF36 5LU |
| Newton Nottage Road | CF36 5EA CF36 5EB CF36 5ED CF36 5EE |
| Nicholls Avenue | CF36 5LH CF36 5LL |
| Northways | CF36 5LB |
| Old Station Road | CF36 5TL |
| Pant Morfa | CF36 5EL CF36 5EN CF36 5DR |
| Parc Y Berllan | CF36 5HX |
| Poplar Avenue | CF36 5LG |
| Poplar Crescent | CF36 5LF |
| Poplar Mews | CF36 5LT |
| Pwll Y Waun | CF36 5HH CF36 5HL |
| Queens Avenue | CF36 5HP |
| Rhych Avenue | CF36 5DB |
| Sandy Lane | CF36 5BW |
| Sandymeers | CF36 5LP |
| St Davids Way | CF36 5HA CF36 5HB |
| Station Close | CF36 5TH |
| The Harbour | CF36 3XA CF36 3XD |
| The Mercies | CF36 5HN |
| Vernon Road | CF36 5LN |
| Vintin Lane | CF36 5LY |
| Vintin Terrace | CF36 5LS |
| Wellfield Avenue | CF36 5TP |
| Wellfield Crescent | CF36 5TR |
| Wellfield Villas | CF36 5TW |
| Wick Cottages | CF36 5LR |
| Woodland Avenue | CF36 5HR CF36 5HT CF36 5HU CF36 5HW CF36 5HY |
| Ynyslas | CF36 5EF |
| Zig Zag Lane | CF36 5EH |
| CF36 5ES CF36 5EW |
Transport near Porthcawl East Central
-
Pyle Station
-
Bridgend Station
-
Wildmill Station
-
Sarn Station
-
Tondu Station
-
Garth (Mid-Glamorgan) Station
-
Port Talbot Parkway Station
-
Maesteg (Ewenny Road) Station
-
Pencoed Station
-
Maesteg Station
- FAQ
- Price Paid By Year
- Property Type Price
Frequently asked questions about Porthcawl East Central
What is the average price for a property for sale in Porthcawl East Central?
The average price for a property for sale in Porthcawl East Central is £232,327. This amount is 31% lower than the average price in Porthcawl. There are 1,177 property listings for sale in Porthcawl East Central.
What streets have the most expensive properties for sale in Porthcawl East Central?
The streets with the most expensive properties for sale in Porthcawl East Central are Parc Y Berllan at an average of £344,333, Northways at an average of £325,000 and Heol Fair at an average of £316,800.
What streets have the most affordable properties for sale in Porthcawl East Central?
The streets with the most affordable properties for sale in Porthcawl East Central are Lake View Close at an average of £107,500, Eastern Promenade at an average of £122,500 and Glan Road at an average of £135,000.
Which train stations are available in or near Porthcawl East Central?
Some of the train stations available in or near Porthcawl East Central are Pyle, Bridgend and Wildmill.
Property Price Paid in Porthcawl East Central by Year
The average sold property price by year was:
| Year | Average Sold Price | Price Change |
Sold Properties
|
|---|---|---|---|
| 2025 | £233,058 | -2% |
30 Properties |
| 2024 | £237,507 | 2% |
57 Properties |
| 2023 | £233,435 | 3% |
31 Properties |
| 2022 | £225,295 | 10% |
50 Properties |
| 2021 | £202,943 | 9% |
66 Properties |
| 2020 | £184,515 | 1% |
46 Properties |
| 2019 | £183,465 | 13% |
48 Properties |
| 2018 | £160,267 | -1% |
56 Properties |
| 2017 | £161,962 | 1% |
66 Properties |
| 2016 | £160,780 | 6% |
41 Properties |
| 2015 | £150,461 | -4% |
63 Properties |
| 2014 | £156,069 | 14% |
48 Properties |
| 2013 | £134,733 | 2% |
42 Properties |
| 2012 | £131,596 | -5% |
33 Properties |
| 2011 | £138,828 | -10% |
33 Properties |
| 2010 | £152,477 | 4% |
33 Properties |
| 2009 | £146,571 | 15% |
42 Properties |
| 2008 | £124,828 | -27% |
35 Properties |
| 2007 | £158,940 | 10% |
56 Properties |
| 2006 | £143,279 | 16% |
71 Properties |
| 2005 | £119,939 | -1% |
53 Properties |
| 2004 | £120,899 | 22% |
61 Properties |
| 2003 | £94,901 | 23% |
86 Properties |
| 2002 | £73,497 | 6% |
97 Properties |
| 2001 | £68,904 | -6% |
79 Properties |
| 2000 | £73,243 | 26% |
68 Properties |
| 1999 | £54,388 | 3% |
47 Properties |
| 1998 | £52,809 | -0,4% |
49 Properties |
| 1997 | £53,014 | 8% |
34 Properties |
| 1996 | £48,926 | -7% |
36 Properties |
| 1995 | £52,166 | - |
31 Properties |
Property Price per Property Type in Porthcawl East Central
Here you can find historic sold price data in order to help with your property search.
The average Property Paid Price for specific property types in the last three years are:
| Property Type | Average Sold Price | Sold Properties |
|---|---|---|
| Semi Detached House | £258,885.00 | 87 Semi Detached Houses |
| Detached House | £328,333.00 | 6 Detached Houses |
| Terraced House | £224,209.00 | 50 Terraced Houses |
| Flat | £133,100.00 | 25 Flats |

