Houses for sale & to rent in Crickhowell, Crickhowell
House Prices in Crickhowell
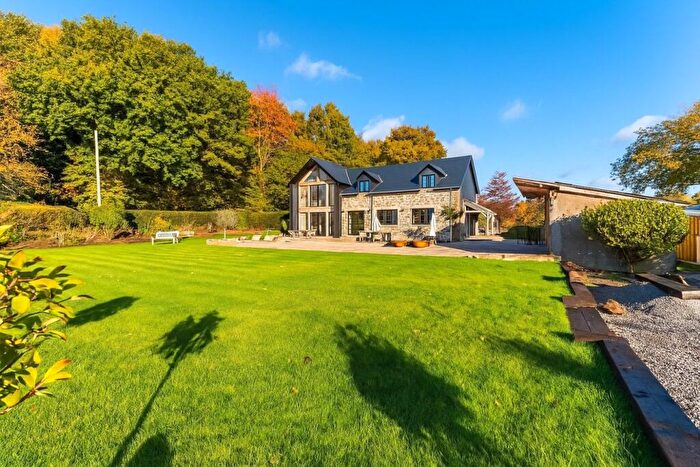
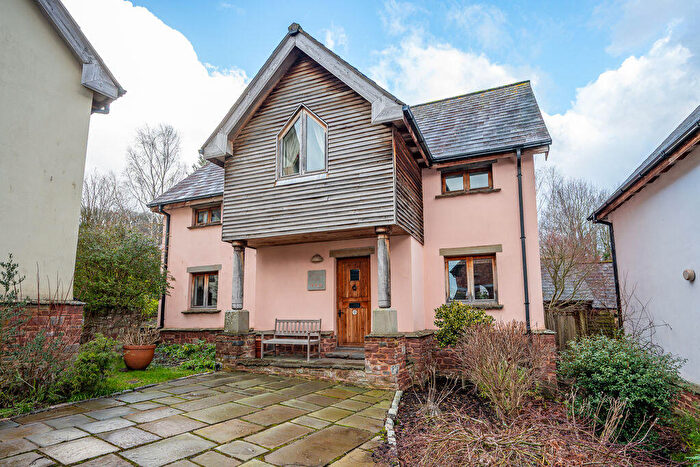
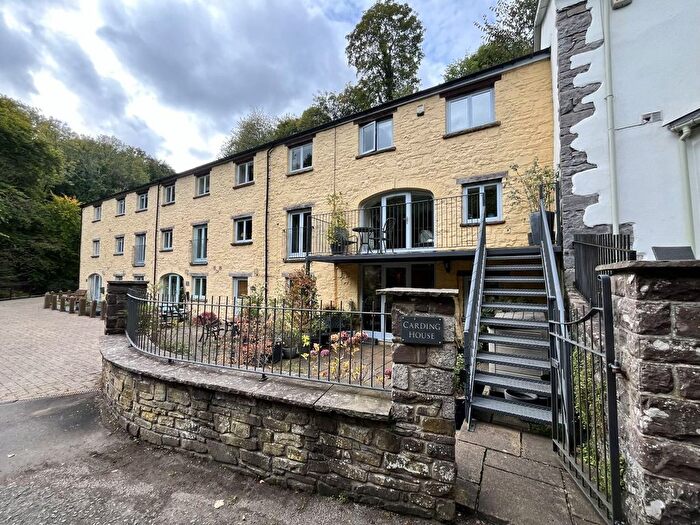
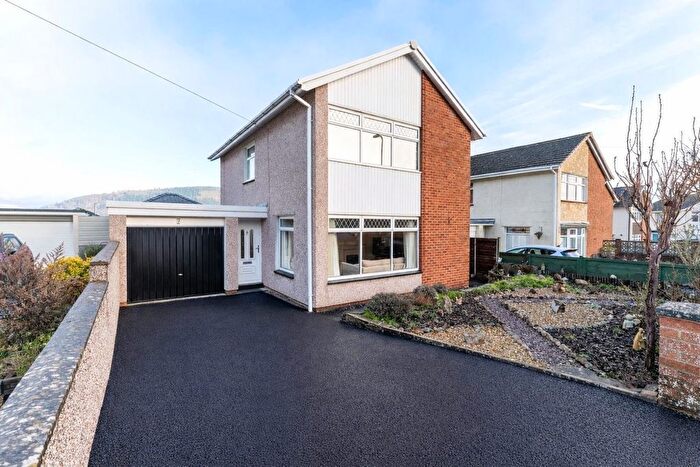
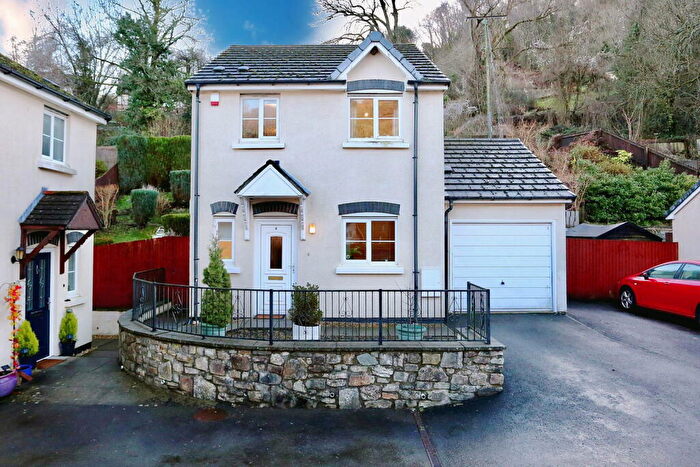
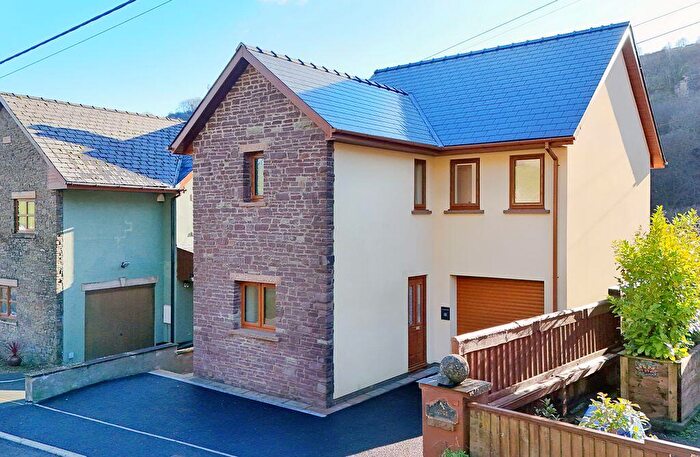
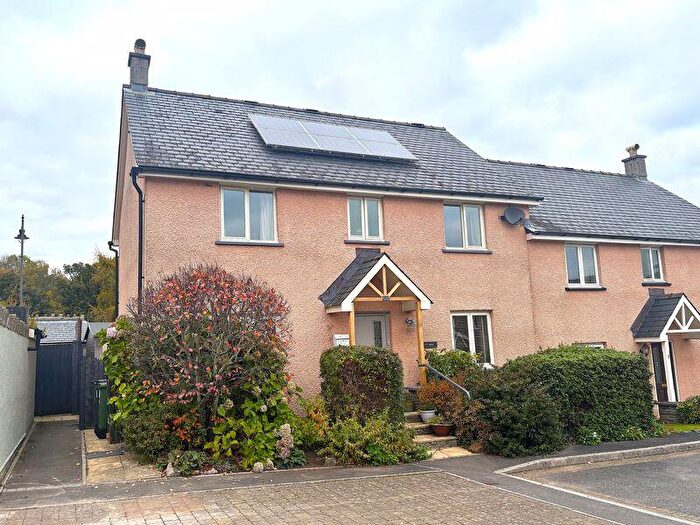
Properties in Crickhowell have an average house price of £454,190.00 and had 79 Property Transactions within the last 3 years¹.
Crickhowell is an area in Crickhowell, Powys - Powys with 1,251 households², where the most expensive property was sold for £1,050,815.00.
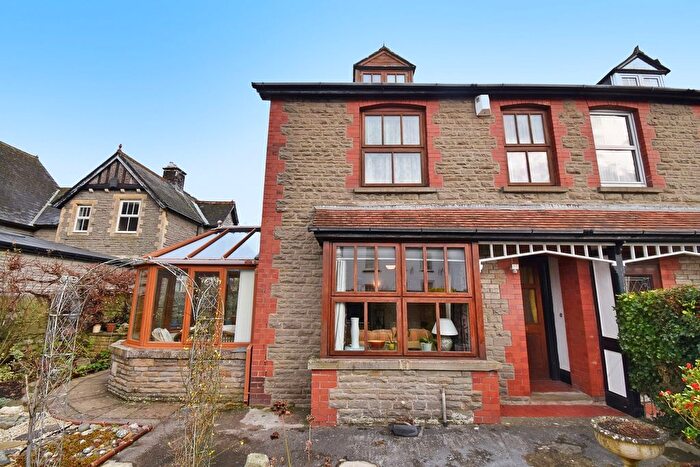
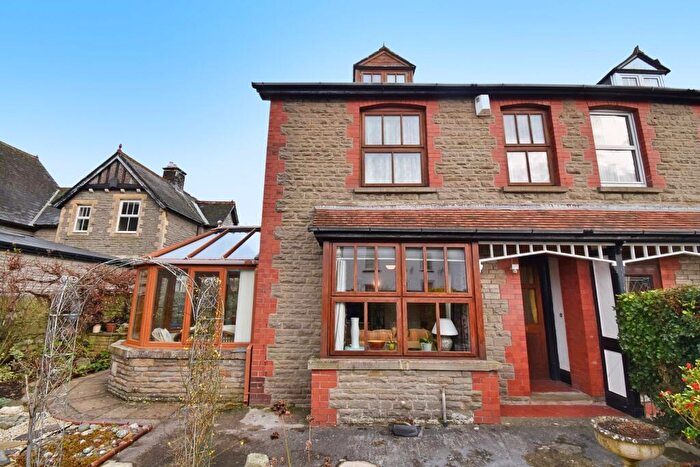
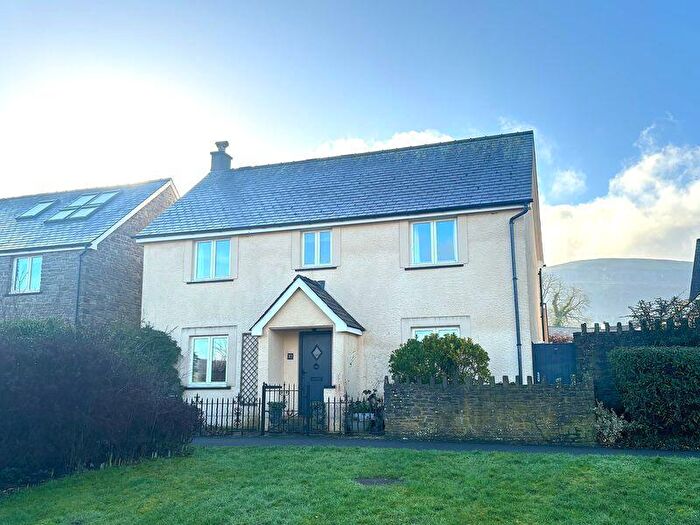
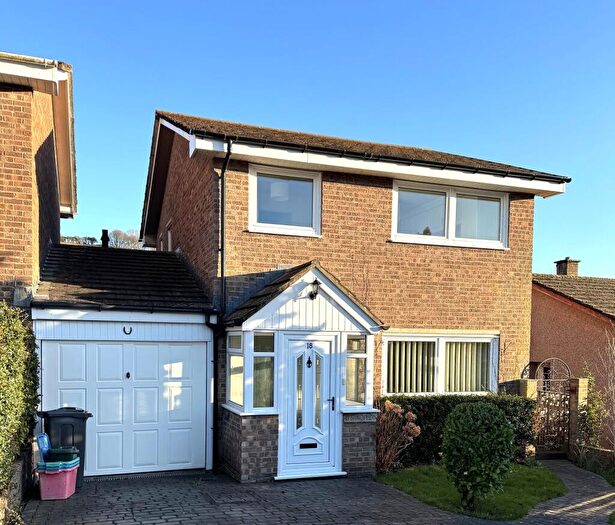
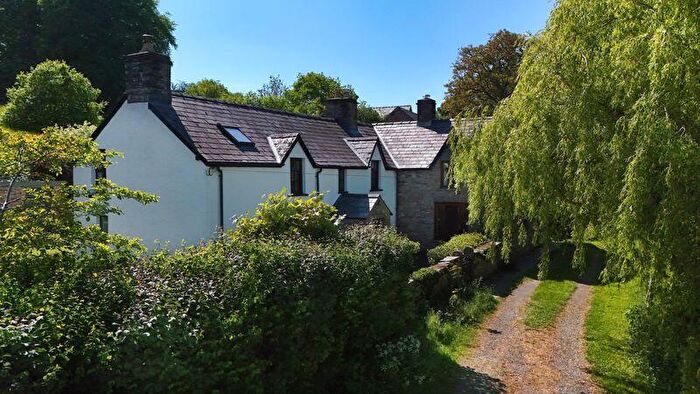
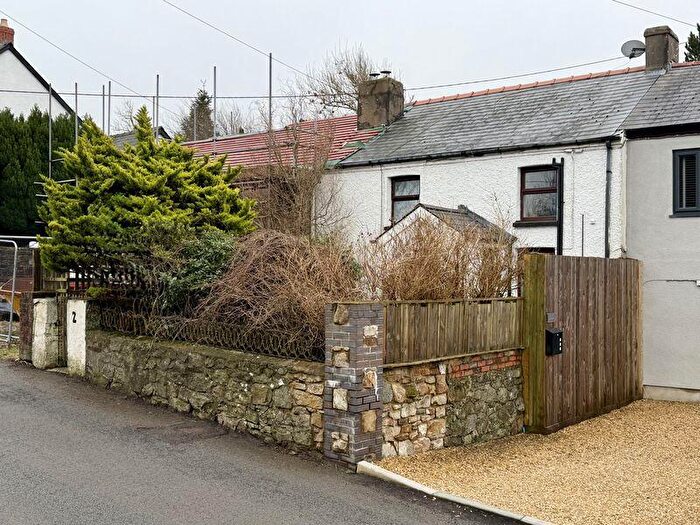
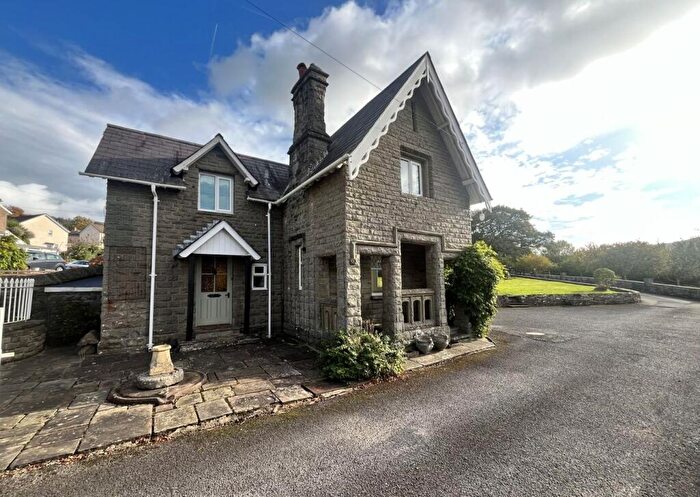
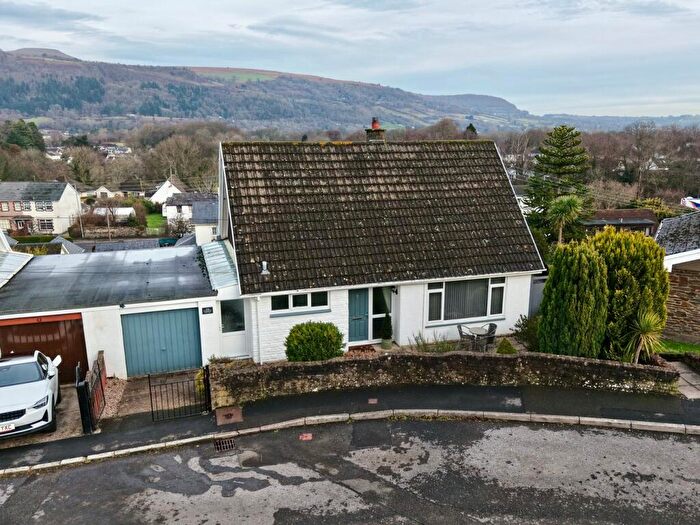
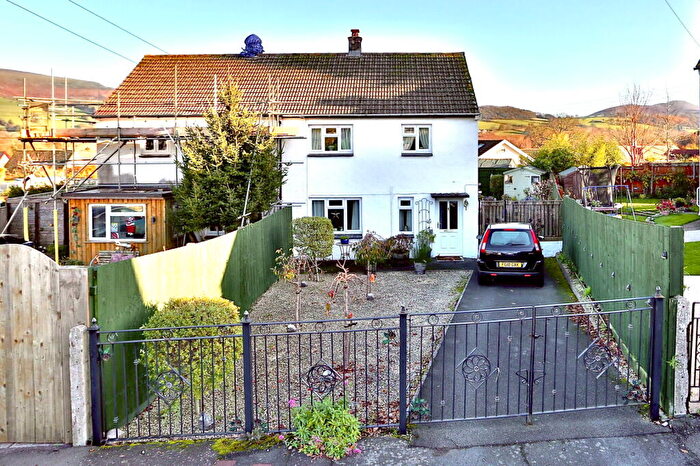
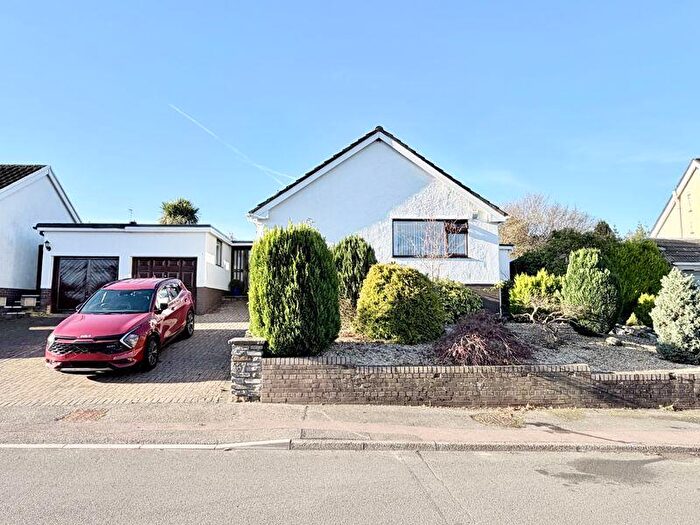
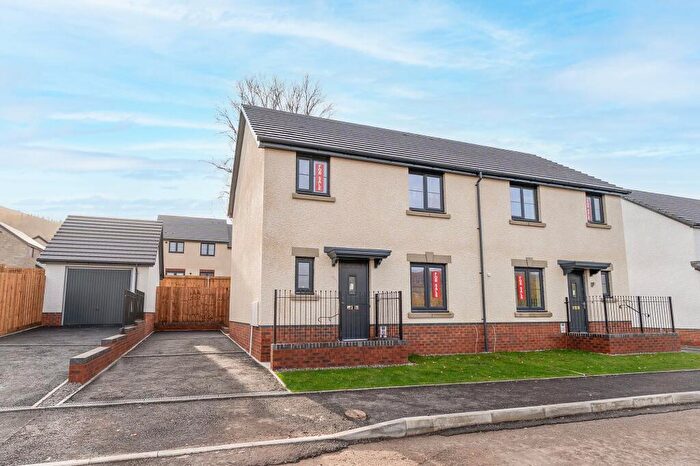
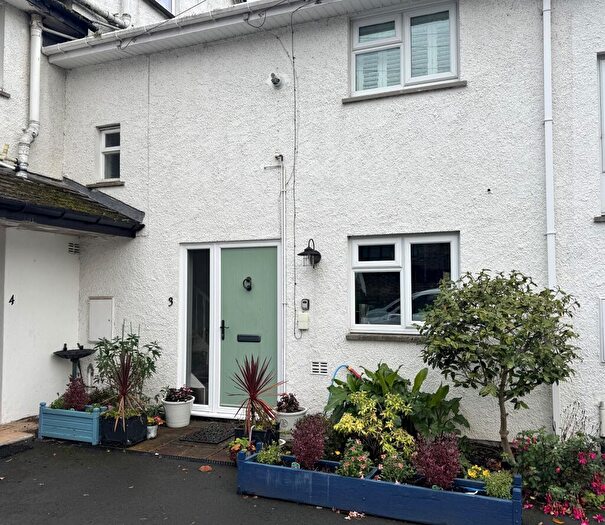
Properties for sale in Crickhowell
Roads and Postcodes in Crickhowell
Navigate through our locations to find the location of your next house in Crickhowell, Crickhowell for sale or to rent.
| Streets | Postcodes |
|---|---|
| Abergavenny Road | NP8 1ED |
| Beaufort Street | NP8 1AD NP8 1AG NP8 1AE NP8 1AJ NP8 1ER |
| Bellfountain Road | NP8 1SN NP8 1SL |
| Brecon Road | NP8 1DG NP8 1RB NP8 1SE NP8 1SF NP8 1DE NP8 1DL |
| Bridge Row | NP8 1EF |
| Bridge Street | NP8 1AR |
| Brookfields | NP8 1DJ |
| Brynant | NP8 1DP |
| Castle Road | NP8 1AP |
| Church Lane | NP8 1BB |
| Clarence Villas | NP8 1BN |
| Cwmbeth Close | NP8 1DX |
| Cwrt Newydd | NP8 1AQ |
| Dan Y Gollen | NP8 1TN |
| Danygrug | NP8 1DD |
| Darren View | NP8 1DS |
| Deanes Drive | NP8 1TE |
| Derwen Fawr | NP8 1DQ |
| Elms Hill | NP8 1TL |
| Elvicta Estates | NP8 1DF NP8 1EB |
| Everest Drive | NP8 1DH |
| Ffynnonau | NP8 1DA NP8 1DB |
| Glangrwyney Court | NP8 1ES |
| Great Oak Road | NP8 1SW |
| Greenhill Villas | NP8 1AL |
| Greenhill Way | NP8 1AF |
| High Street | NP8 1BD NP8 1BE NP8 1BH NP8 1BW |
| Lamb Lane | NP8 1AS |
| Latham Court | NP8 1DT |
| Llanbedr Road | NP8 1BT NP8 1BY NP8 1SP |
| Llangenny Lane | NP8 1AN |
| Martell Way | NP8 1TJ |
| Mill Street | NP8 1BA |
| Mountain View | NP8 1EZ |
| New Road | NP8 1AT NP8 1AU NP8 1AY |
| Oakfield Drive | NP8 1DR NP8 1DU |
| Old Abbey Place | NP8 1EH |
| Orchard Court | NP8 1BG |
| Orchard Lane | NP8 1BU |
| Pontfaen | NP8 1SJ |
| Post Office Row | NP8 1EG |
| Rectory Road | NP8 1DW |
| Rock Cottages | NP8 1EL |
| Silver Lane | NP8 1BJ |
| St Peters Close | NP8 1SQ |
| Standard Street | NP8 1BP |
| The Green | NP8 1EX |
| Tower Street | NP8 1BL NP8 1BQ |
| Upper House Farm | NP8 1BZ |
| Victoria Terrace | NP8 1DN |
| NP8 1EE NP8 1EN NP8 1ET NP8 1EW NP8 1EY NP8 1HA NP8 1HD NP8 1HE NP8 1SR NP8 1SY NP8 1TB NP8 1AW NP8 1BR NP8 1BX NP8 1DY NP8 1EU NP8 1HB NP8 1HF NP8 1QA NP8 1SS NP8 1ST NP8 1SU NP8 1TA NP8 1TD NP8 1TP |
Transport near Crickhowell
- FAQ
- Price Paid By Year
- Property Type Price
Frequently asked questions about Crickhowell
What is the average price for a property for sale in Crickhowell?
The average price for a property for sale in Crickhowell is £454,190. This amount is 2% higher than the average price in Crickhowell. There are 220 property listings for sale in Crickhowell.
What streets have the most expensive properties for sale in Crickhowell?
The streets with the most expensive properties for sale in Crickhowell are Cwrt Newydd at an average of £680,000, Orchard Lane at an average of £635,000 and The Green at an average of £570,750.
What streets have the most affordable properties for sale in Crickhowell?
The streets with the most affordable properties for sale in Crickhowell are Latham Court at an average of £220,000, Martell Way at an average of £236,450 and Brynant at an average of £239,500.
Which train stations are available in or near Crickhowell?
Some of the train stations available in or near Crickhowell are Abergavenny, Ebbw Vale Town and Ebbw Vale Parkway.
Property Price Paid in Crickhowell by Year
The average sold property price by year was:
| Year | Average Sold Price | Price Change |
Sold Properties
|
|---|---|---|---|
| 2025 | £478,771 | 9% |
23 Properties |
| 2024 | £435,242 | -5% |
32 Properties |
| 2023 | £455,898 | 2% |
24 Properties |
| 2022 | £446,382 | 4% |
39 Properties |
| 2021 | £427,857 | 26% |
47 Properties |
| 2020 | £316,627 | 17% |
32 Properties |
| 2019 | £262,148 | -17% |
26 Properties |
| 2018 | £305,949 | 3% |
53 Properties |
| 2017 | £296,016 | 10% |
54 Properties |
| 2016 | £267,056 | -0,2% |
29 Properties |
| 2015 | £267,500 | 15% |
36 Properties |
| 2014 | £227,602 | -11% |
44 Properties |
| 2013 | £253,169 | 4% |
29 Properties |
| 2012 | £243,879 | -14% |
30 Properties |
| 2011 | £276,968 | 1% |
24 Properties |
| 2010 | £275,308 | 8% |
25 Properties |
| 2009 | £253,893 | -16% |
31 Properties |
| 2008 | £294,190 | 11% |
21 Properties |
| 2007 | £263,162 | 11% |
58 Properties |
| 2006 | £233,748 | -5% |
39 Properties |
| 2005 | £244,441 | 14% |
34 Properties |
| 2004 | £210,614 | 12% |
40 Properties |
| 2003 | £184,989 | 17% |
82 Properties |
| 2002 | £152,915 | 18% |
47 Properties |
| 2001 | £124,917 | 11% |
54 Properties |
| 2000 | £111,541 | 10% |
45 Properties |
| 1999 | £100,199 | 14% |
35 Properties |
| 1998 | £85,675 | 10% |
36 Properties |
| 1997 | £77,079 | -14% |
53 Properties |
| 1996 | £87,851 | 22% |
40 Properties |
| 1995 | £68,733 | - |
27 Properties |
Property Price per Property Type in Crickhowell
Here you can find historic sold price data in order to help with your property search.
The average Property Paid Price for specific property types in the last three years are:
| Property Type | Average Sold Price | Sold Properties |
|---|---|---|
| Semi Detached House | £356,085.00 | 17 Semi Detached Houses |
| Detached House | £509,766.00 | 53 Detached Houses |
| Terraced House | £348,571.00 | 7 Terraced Houses |
| Flat | £185,000.00 | 2 Flats |

