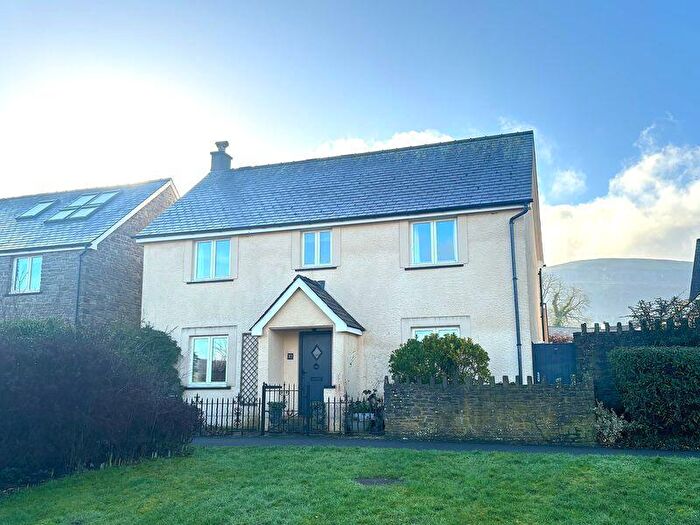
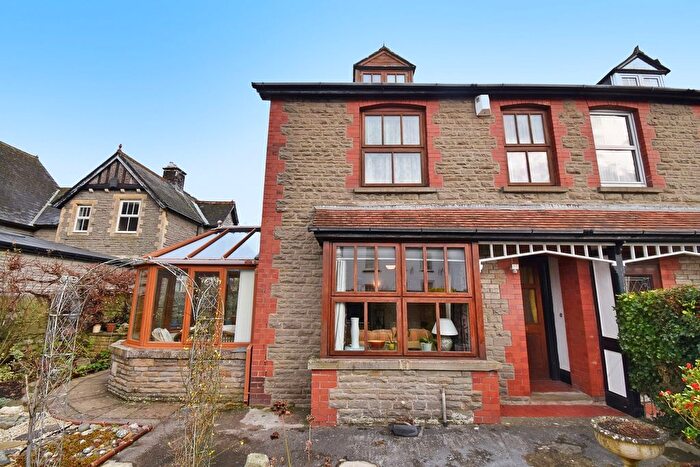
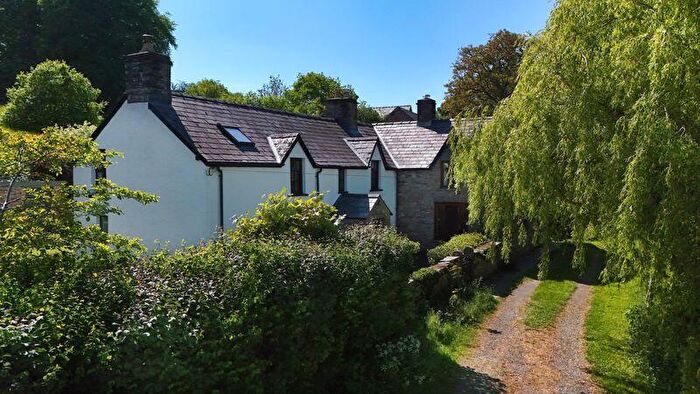
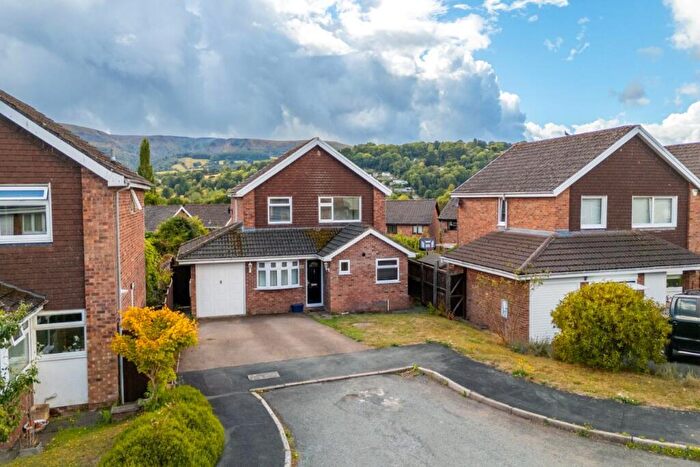
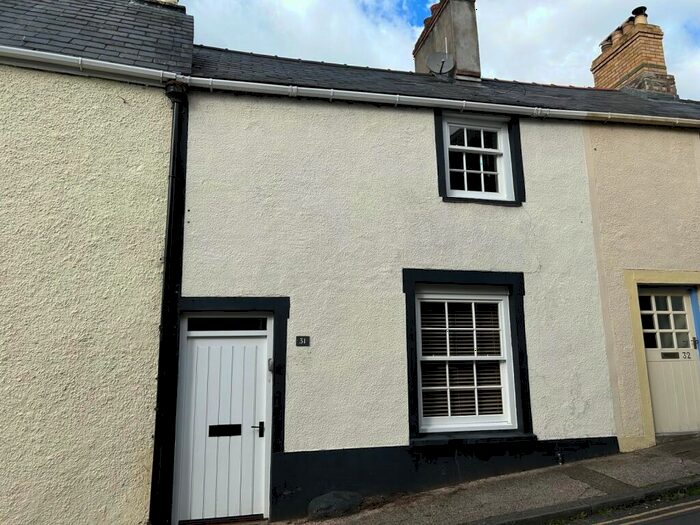
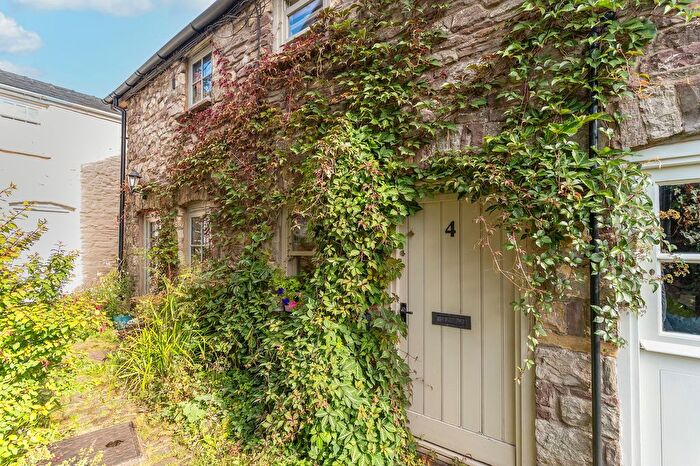
Houses for sale & to rent in Llangattock, Crickhowell
House Prices in Llangattock
Properties in Llangattock have an average house price of £427,442.00 and had 35 Property Transactions within the last 3 years¹.
Llangattock is an area in Crickhowell, Powys - Powys with 435 households², where the most expensive property was sold for £810,000.00.
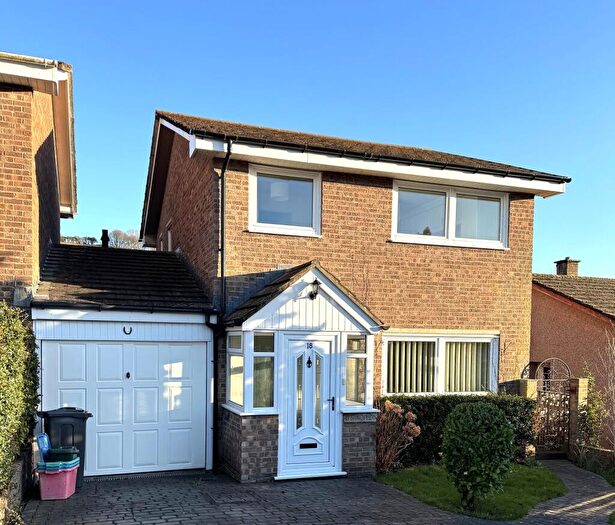
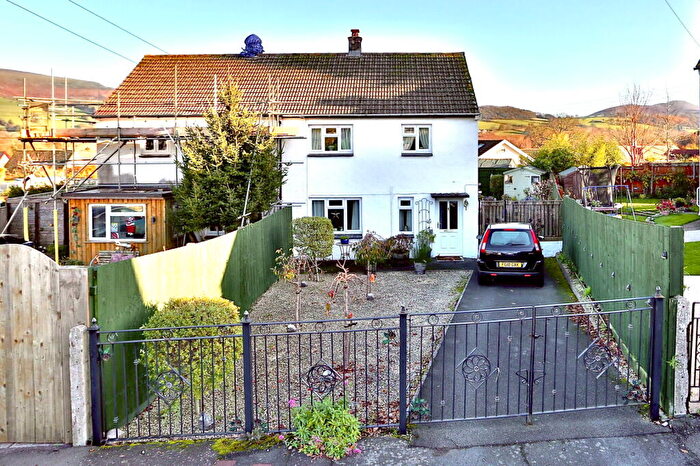
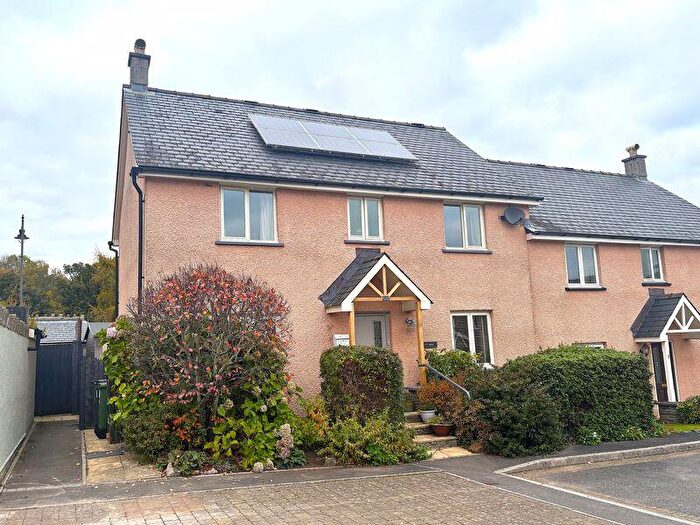
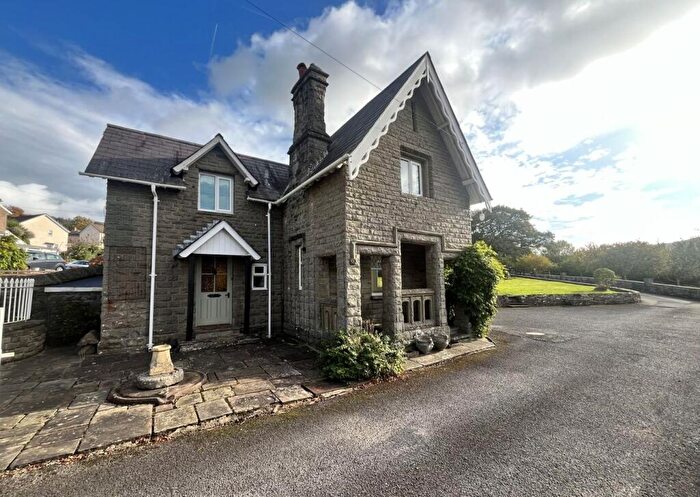
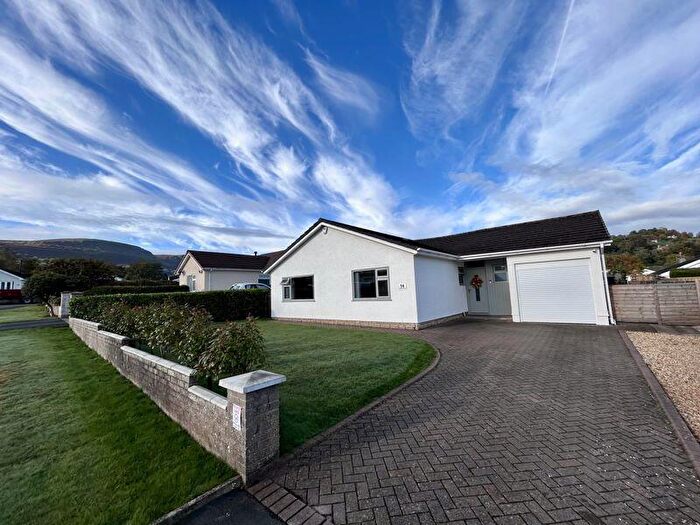
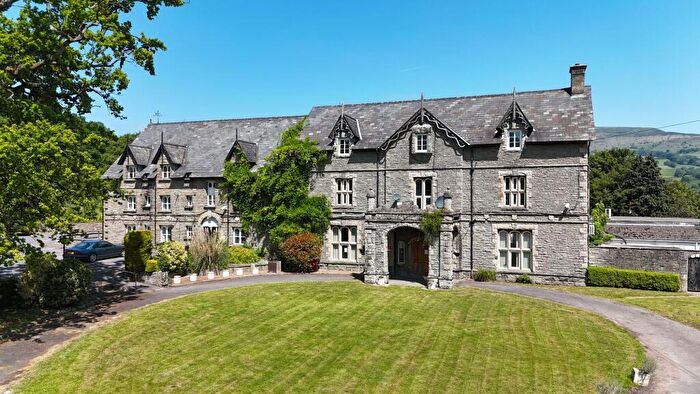
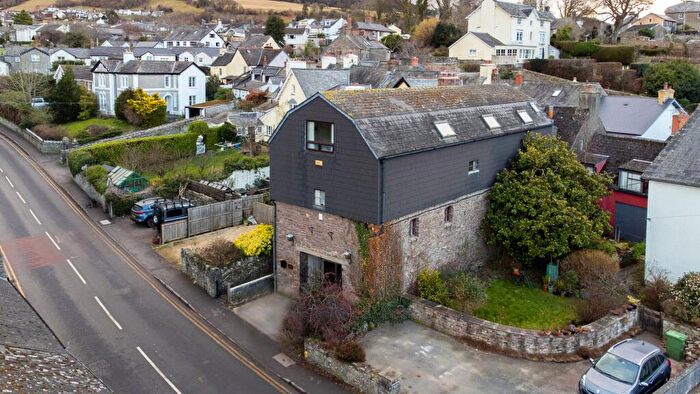
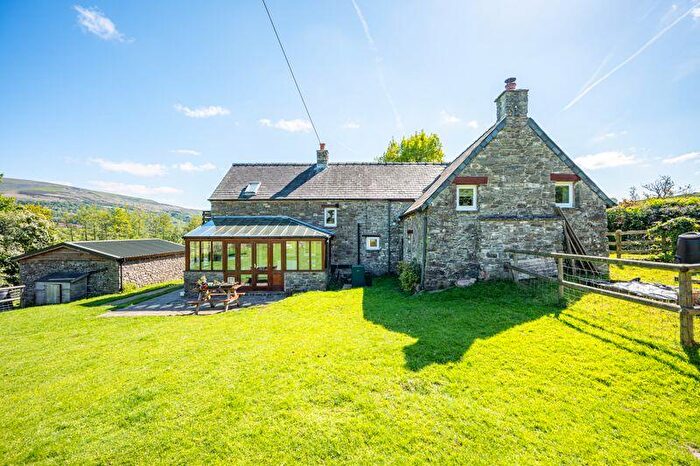
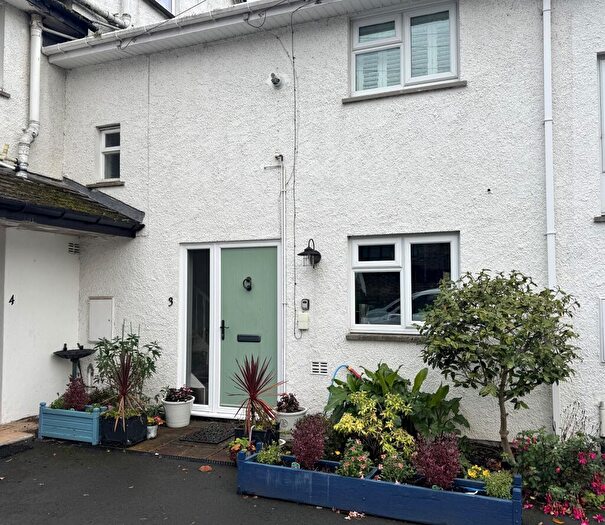
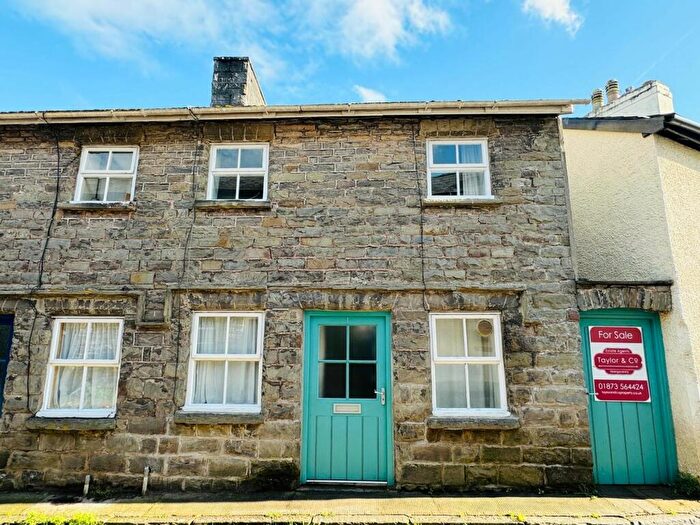
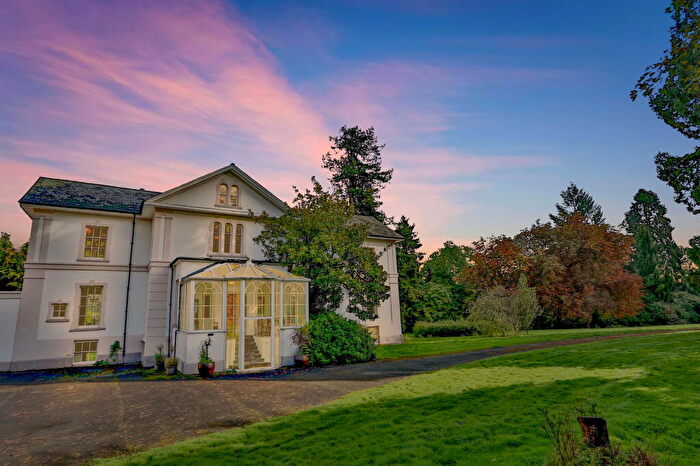
Properties for sale in Llangattock
Previously listed properties in Llangattock
Roads and Postcodes in Llangattock
Navigate through our locations to find the location of your next house in Llangattock, Crickhowell for sale or to rent.
| Streets | Postcodes |
|---|---|
| Beaufort Avenue | NP8 1PN |
| Beechwood Road | NP8 1PL |
| Canal Close | NP8 1LZ |
| Chapel Field | NP8 1LJ |
| Church View | NP8 1PQ |
| Clos Ciliau | NP8 1LA |
| Crown Cottages | NP8 1PG |
| Dan Y Parc | NP8 1HN |
| Glanonney Gardens | NP8 1HQ |
| Golden Square | NP8 1PF |
| Hillside | NP8 1LF NP8 1LG NP8 1LH |
| Hillside Road | NP8 1HU NP8 1EQ |
| Lime Trees Avenue | NP8 1LB |
| Lower Terrace | NP8 1PR |
| Onney Terrace | NP8 1PD |
| Park Drive | NP8 1PP |
| Plas Cottages | NP8 1PA |
| Plas Derwen | NP8 1HY |
| Rectory Close | NP8 1DZ |
| St Catwgs Close | NP8 1PJ |
| Swan Lane | NP8 1PE |
| Tan Dderwen | NP8 1LQ |
| The Dardy | NP8 1PS NP8 1PU |
| The Legar | NP8 1HH |
| Upper Terrace | NP8 1PT |
| NP8 1HL NP8 1HS NP8 1LD NP8 1LE NP8 1LW NP8 1PB NP8 1PH NP8 1PY NP8 1HG NP8 1HT NP8 1HW NP8 1LP NP8 1PW NP8 1PZ |
Transport near Llangattock
-
Ebbw Vale Town Station
-
Abergavenny Station
-
Ebbw Vale Parkway Station
-
Rhymney Station
-
Pontlottyn Station
-
Tir-Phil Station
- FAQ
- Price Paid By Year
- Property Type Price
Frequently asked questions about Llangattock
What is the average price for a property for sale in Llangattock?
The average price for a property for sale in Llangattock is £427,442. This amount is 4% lower than the average price in Crickhowell. There are 70 property listings for sale in Llangattock.
What streets have the most expensive properties for sale in Llangattock?
The streets with the most expensive properties for sale in Llangattock are Hillside at an average of £790,000, Park Drive at an average of £516,000 and Beaufort Avenue at an average of £501,400.
What streets have the most affordable properties for sale in Llangattock?
The streets with the most affordable properties for sale in Llangattock are The Legar at an average of £225,000, Tan Dderwen at an average of £257,500 and Plas Derwen at an average of £312,500.
Which train stations are available in or near Llangattock?
Some of the train stations available in or near Llangattock are Ebbw Vale Town, Abergavenny and Ebbw Vale Parkway.
Property Price Paid in Llangattock by Year
The average sold property price by year was:
| Year | Average Sold Price | Price Change |
Sold Properties
|
|---|---|---|---|
| 2025 | £437,111 | -9% |
9 Properties |
| 2024 | £475,750 | 18% |
10 Properties |
| 2023 | £391,812 | -31% |
16 Properties |
| 2022 | £512,692 | 33% |
13 Properties |
| 2021 | £345,273 | 4% |
20 Properties |
| 2020 | £332,282 | 17% |
11 Properties |
| 2019 | £275,083 | 7% |
12 Properties |
| 2018 | £255,628 | -9% |
14 Properties |
| 2017 | £279,247 | -14% |
11 Properties |
| 2016 | £319,291 | 36% |
12 Properties |
| 2015 | £204,595 | -86% |
10 Properties |
| 2014 | £379,607 | 26% |
14 Properties |
| 2013 | £282,064 | 2% |
24 Properties |
| 2012 | £277,500 | 15% |
8 Properties |
| 2011 | £235,455 | -10% |
11 Properties |
| 2010 | £258,750 | -4% |
10 Properties |
| 2009 | £269,136 | 17% |
11 Properties |
| 2008 | £222,653 | -23% |
13 Properties |
| 2007 | £274,376 | 7% |
17 Properties |
| 2006 | £255,063 | 2% |
15 Properties |
| 2005 | £248,955 | 4% |
21 Properties |
| 2004 | £238,475 | 22% |
25 Properties |
| 2003 | £185,111 | 32% |
17 Properties |
| 2002 | £125,919 | -30% |
13 Properties |
| 2001 | £164,102 | 8% |
19 Properties |
| 2000 | £151,432 | 21% |
23 Properties |
| 1999 | £119,746 | 16% |
14 Properties |
| 1998 | £101,100 | 3% |
15 Properties |
| 1997 | £97,916 | 12% |
13 Properties |
| 1996 | £86,166 | -8% |
6 Properties |
| 1995 | £92,964 | - |
14 Properties |
Property Price per Property Type in Llangattock
Here you can find historic sold price data in order to help with your property search.
The average Property Paid Price for specific property types in the last three years are:
| Property Type | Average Sold Price | Sold Properties |
|---|---|---|
| Semi Detached House | £330,000.00 | 6 Semi Detached Houses |
| Detached House | £521,238.00 | 21 Detached Houses |
| Terraced House | £254,312.00 | 8 Terraced Houses |

