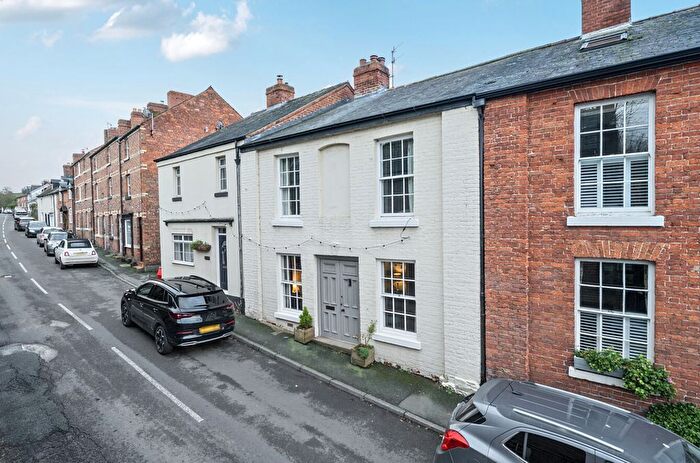
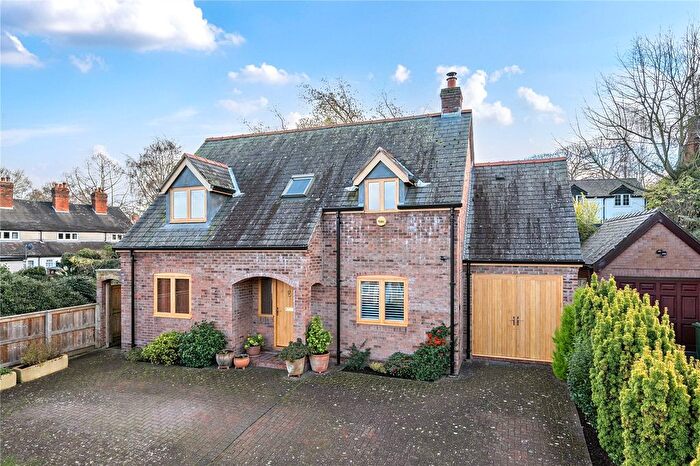
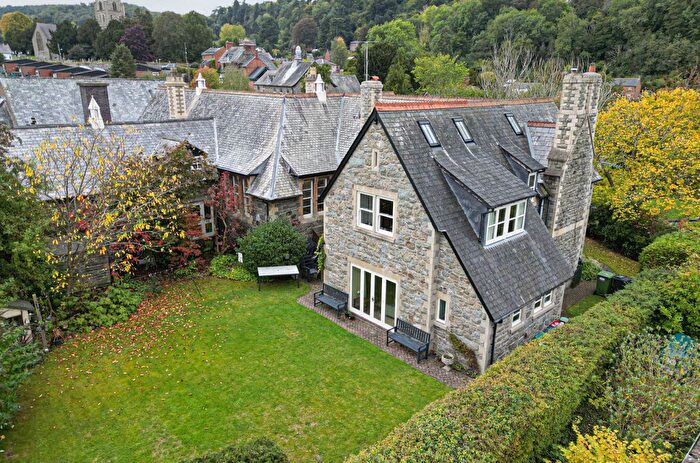
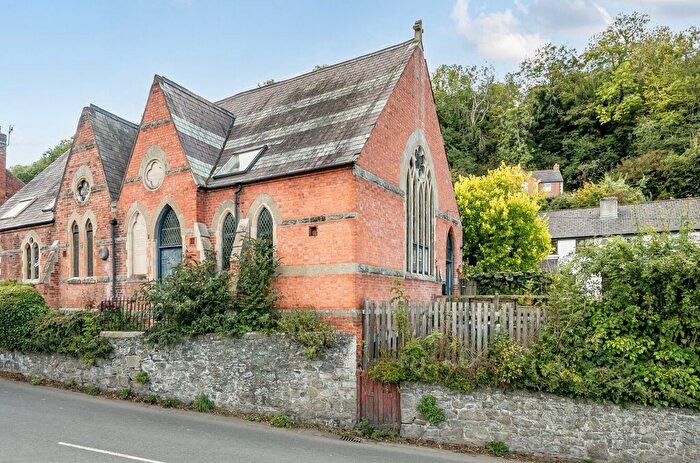
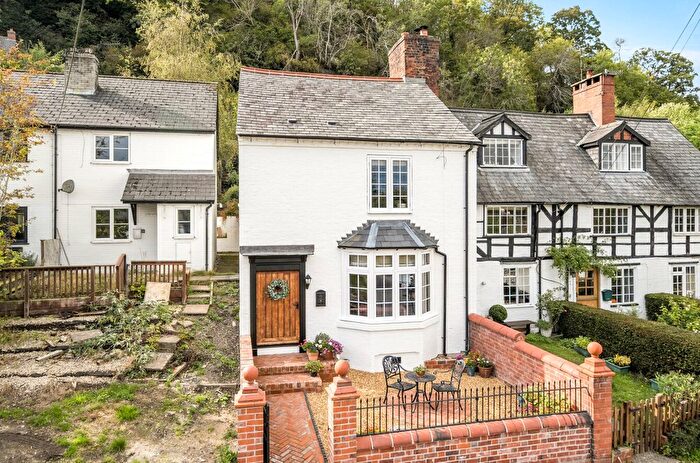
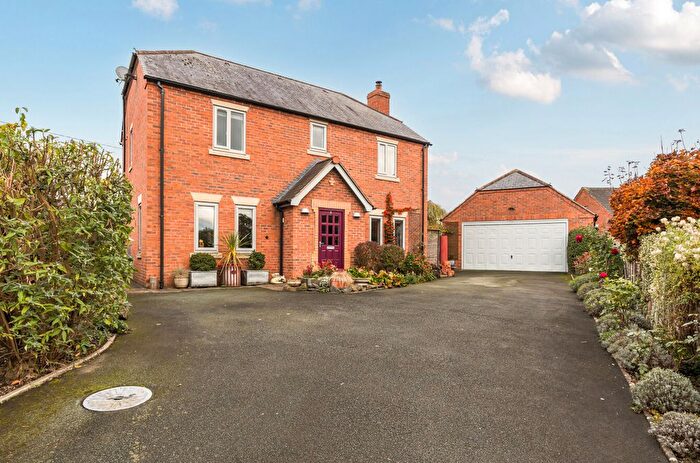
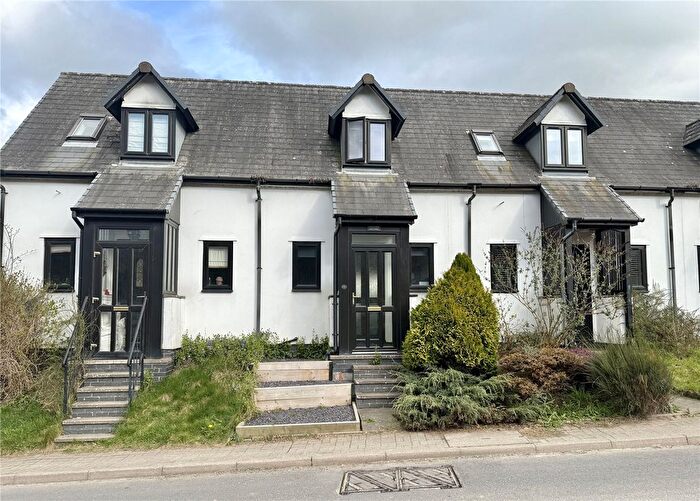
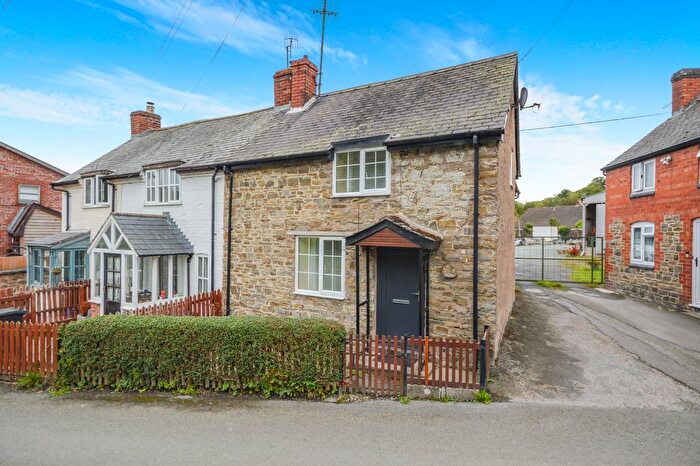
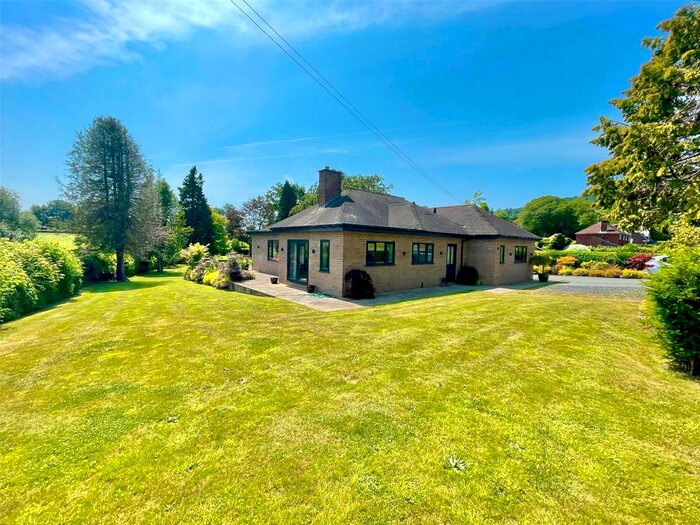
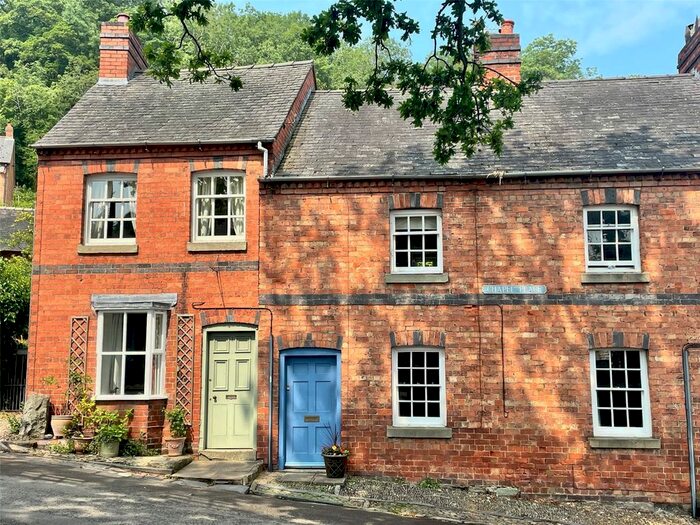
Houses for sale & to rent in Montgomery, Montgomery
House Prices in Montgomery
Properties in Montgomery have an average house price of £277,806.00 and had 58 Property Transactions within the last 3 years¹.
Montgomery is an area in Montgomery, Powys - Powys with 629 households², where the most expensive property was sold for £580,000.00.
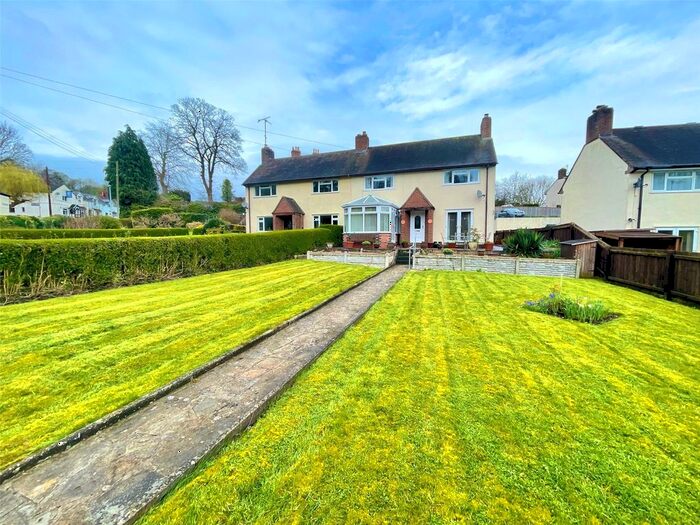
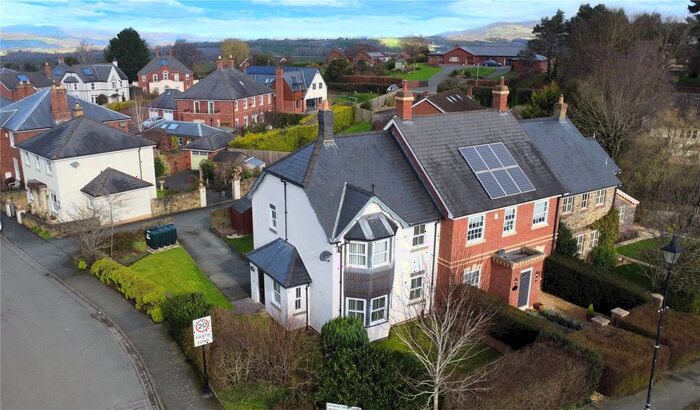
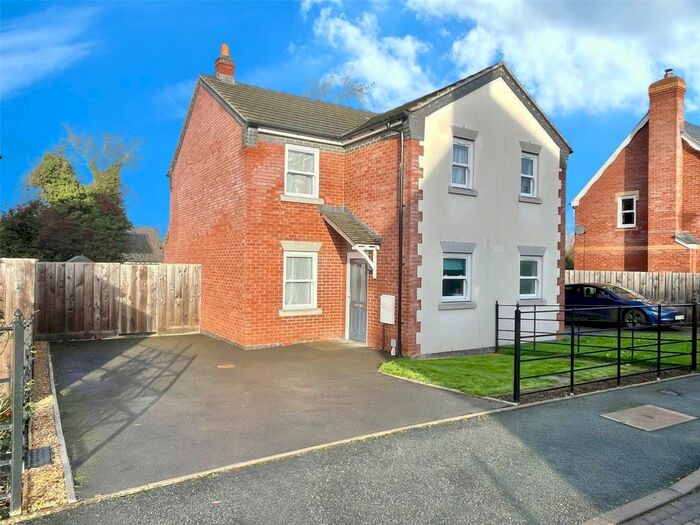
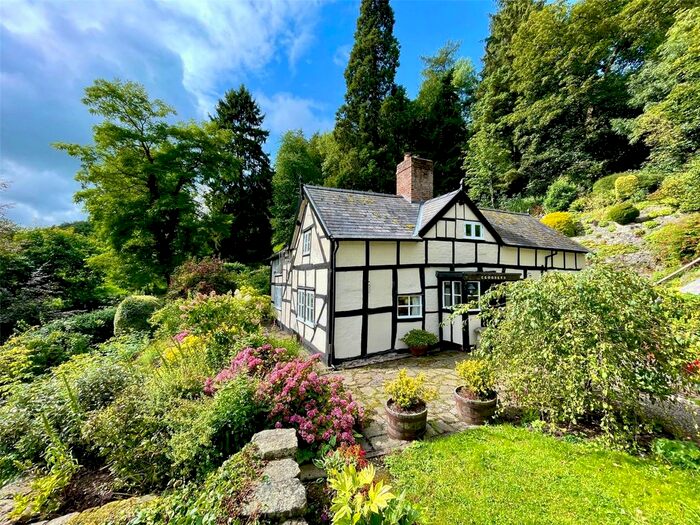
Previously listed properties in Montgomery
Roads and Postcodes in Montgomery
Navigate through our locations to find the location of your next house in Montgomery, Montgomery for sale or to rent.
| Streets | Postcodes |
|---|---|
| Alexandria Terrace | SY15 6QN |
| Arthur Street | SY15 6RA |
| Arthurs Gate | SY15 6QU |
| Back Lane | SY15 6ER |
| Broad Street | SY15 6PH SY15 6PN |
| Burdett Row | SY15 6PP |
| Caerhowel Meadows | SY15 6JF |
| Castle Street | SY15 6PW |
| Castle Terrace | SY15 6PB |
| Castle View | SY15 6QS |
| Chapel Place | SY15 6QZ |
| Chirbury Gate | SY15 6RL |
| Chirbury Road | SY15 6QH SY15 6QJ SY15 6QP SY15 6QQ SY15 6QW |
| Church Bank | SY15 6PU SY15 6PX |
| Clive Terrace | SY15 6QL |
| Corndon Drive | SY15 6RE |
| Cross Houses | SY15 6QG |
| Cwminkin | SY15 6HH |
| Ernley Drive | SY15 6UR |
| Harrison Drive | SY15 6JB |
| Hen Domen | SY15 6EZ SY15 6HB SY15 6HD SY15 6HA |
| Hendomen Drive | SY15 6RB |
| Kerry Road | SY15 6PD SY15 6PE |
| Kerry Street | SY15 6PG |
| Lions Bank | SY15 6PT |
| Lymore View | SY15 6RJ |
| Maldwyn Way | SY15 6RD |
| Manor House Close | SY15 6UN |
| Market Square | SY15 6PA |
| Mortimer Road | SY15 6UP |
| New Road | SY15 6UJ |
| Old Gaol Road | SY15 6QR |
| Pen Y Bryn Cottage | SY15 6HZ |
| Plough Bank | SY15 6QE |
| Pool Road | SY15 6EX SY15 6QY SY15 6EU SY15 6EY SY15 6QT |
| Pound | SY15 6QF |
| Princes Street | SY15 6PY SY15 6PZ |
| Rhodfar Castell | SY15 6ES |
| Rose Cottages | SY15 6QX |
| Rowes Terrace | SY15 6QD |
| School Bank | SY15 6QB |
| School Lane | SY15 6QA |
| Severn Close | SY15 6JE |
| Tan Y Mur | SY15 6PR SY15 6PS |
| Verlon Close | SY15 6SH |
| Well Street | SY15 6PF |
| SY15 6HE SY15 6HF SY15 6HW SY15 6TY SY15 6HG SY15 6HJ SY15 6HL SY15 6HN SY15 6HP SY15 6HQ SY15 6JA SY15 6UL |
Transport near Montgomery
-
Welshpool Station
-
Newtown Station
-
Caersws Station
-
Knucklas Station
-
Church Stretton Station
-
Llangynllo Station
-
Broome Station
- FAQ
- Price Paid By Year
- Property Type Price
Frequently asked questions about Montgomery
What is the average price for a property for sale in Montgomery?
The average price for a property for sale in Montgomery is £277,806. This amount is 0.46% lower than the average price in Montgomery. There are 55 property listings for sale in Montgomery.
What streets have the most expensive properties for sale in Montgomery?
The streets with the most expensive properties for sale in Montgomery are Hen Domen at an average of £575,000, Severn Close at an average of £545,000 and Ernley Drive at an average of £470,000.
What streets have the most affordable properties for sale in Montgomery?
The streets with the most affordable properties for sale in Montgomery are Verlon Close at an average of £145,000, Rowes Terrace at an average of £146,000 and Manor House Close at an average of £165,166.
Which train stations are available in or near Montgomery?
Some of the train stations available in or near Montgomery are Welshpool, Newtown and Caersws.
Property Price Paid in Montgomery by Year
The average sold property price by year was:
| Year | Average Sold Price | Price Change |
Sold Properties
|
|---|---|---|---|
| 2025 | £293,891 | -2% |
23 Properties |
| 2024 | £300,708 | 23% |
18 Properties |
| 2023 | £231,794 | -6% |
17 Properties |
| 2022 | £245,341 | -10% |
24 Properties |
| 2021 | £270,785 | 24% |
27 Properties |
| 2020 | £205,389 | -4% |
14 Properties |
| 2019 | £214,480 | -7% |
25 Properties |
| 2018 | £230,520 | 14% |
32 Properties |
| 2017 | £199,214 | -12% |
17 Properties |
| 2016 | £222,302 | 6% |
19 Properties |
| 2015 | £209,054 | 2% |
29 Properties |
| 2014 | £204,143 | -6% |
24 Properties |
| 2013 | £217,087 | 20% |
19 Properties |
| 2012 | £172,993 | -8% |
18 Properties |
| 2011 | £186,268 | 0,2% |
24 Properties |
| 2010 | £185,947 | -1% |
21 Properties |
| 2009 | £187,067 | 4% |
23 Properties |
| 2008 | £180,000 | -22% |
9 Properties |
| 2007 | £220,163 | 22% |
15 Properties |
| 2006 | £172,241 | -8% |
33 Properties |
| 2005 | £186,604 | -1% |
24 Properties |
| 2004 | £187,834 | 25% |
26 Properties |
| 2003 | £140,377 | 16% |
33 Properties |
| 2002 | £117,662 | 30% |
29 Properties |
| 2001 | £82,029 | -5% |
28 Properties |
| 2000 | £86,235 | 24% |
32 Properties |
| 1999 | £65,905 | -5% |
30 Properties |
| 1998 | £69,456 | 6% |
27 Properties |
| 1997 | £65,050 | 9% |
26 Properties |
| 1996 | £59,404 | 27% |
20 Properties |
| 1995 | £43,090 | - |
11 Properties |
Property Price per Property Type in Montgomery
Here you can find historic sold price data in order to help with your property search.
The average Property Paid Price for specific property types in the last three years are:
| Property Type | Average Sold Price | Sold Properties |
|---|---|---|
| Semi Detached House | £238,100.00 | 15 Semi Detached Houses |
| Detached House | £377,829.00 | 22 Detached Houses |
| Terraced House | £201,380.00 | 21 Terraced Houses |

