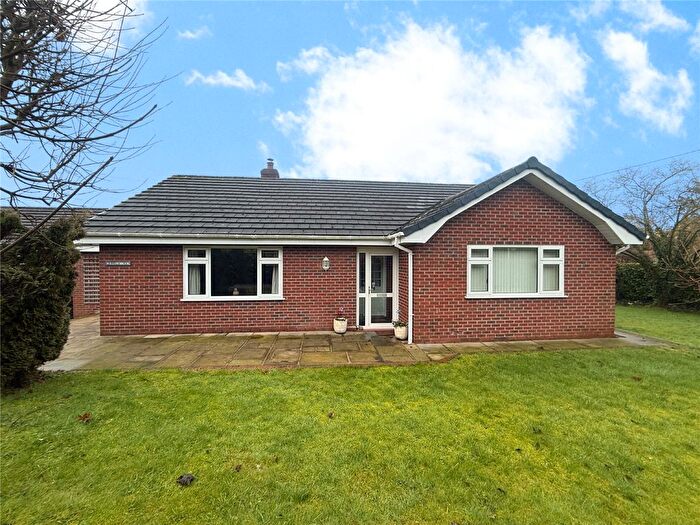
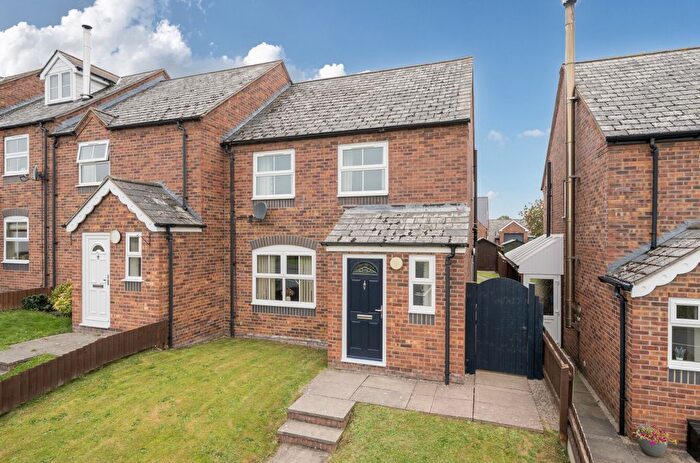
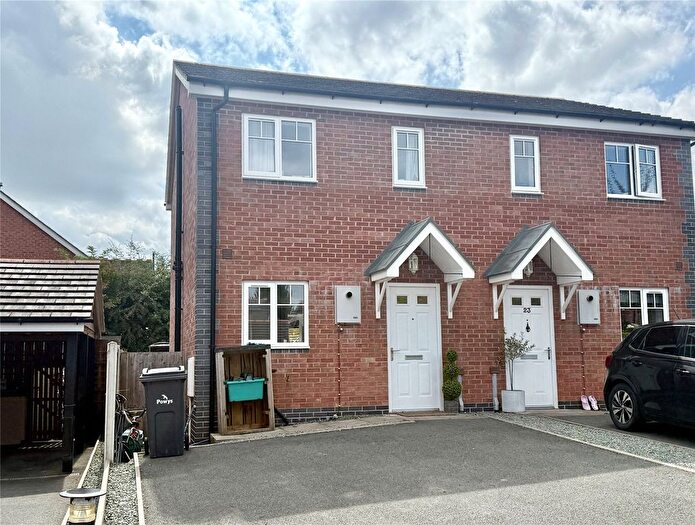
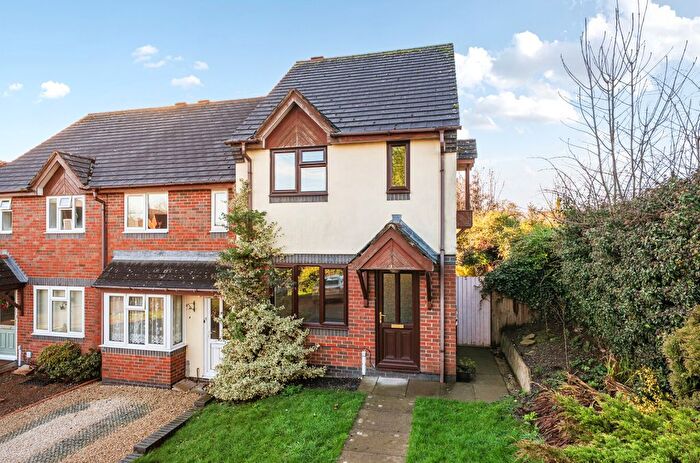
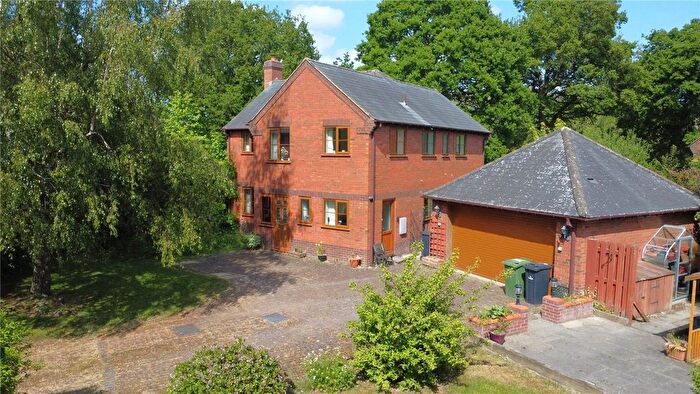
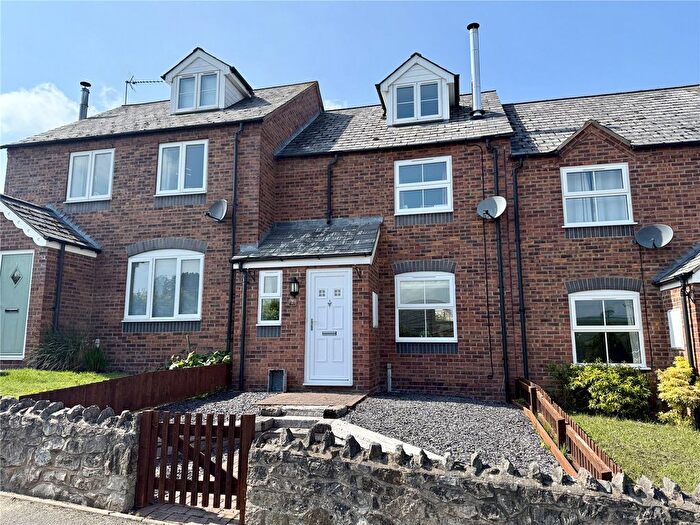
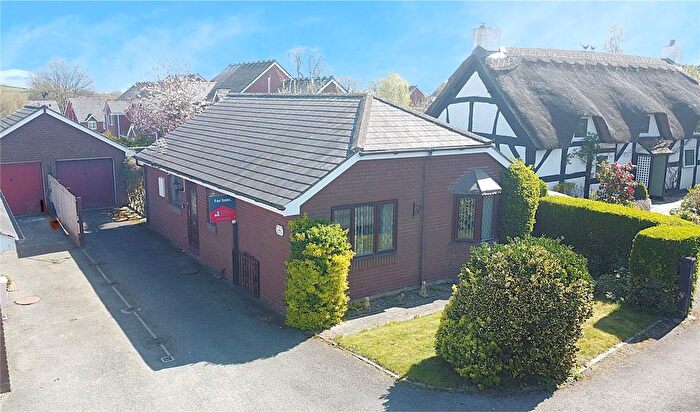
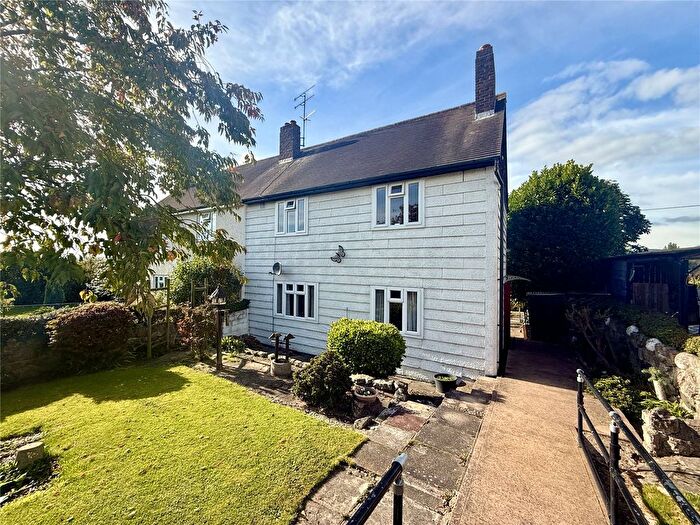
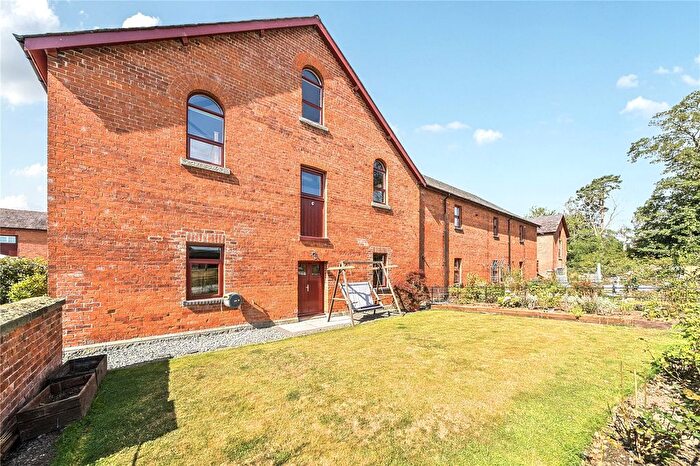
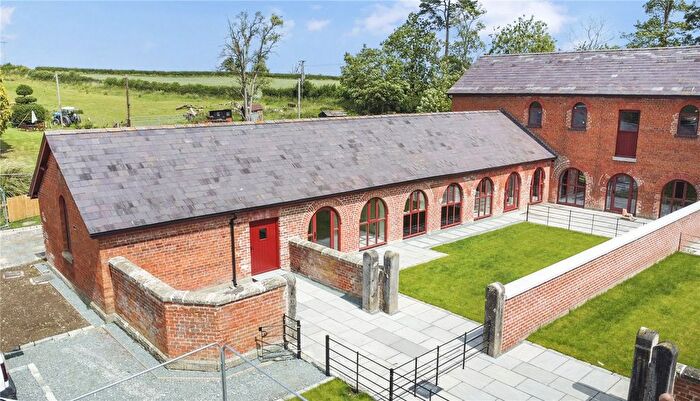
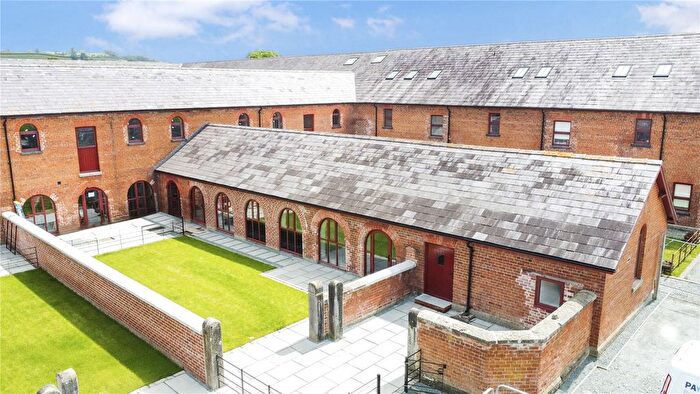
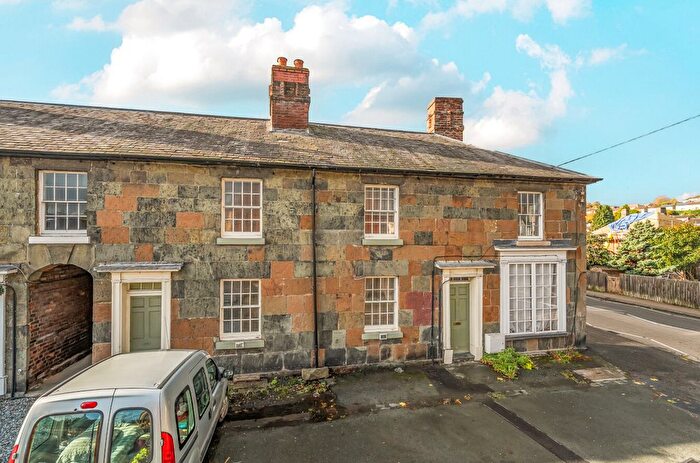
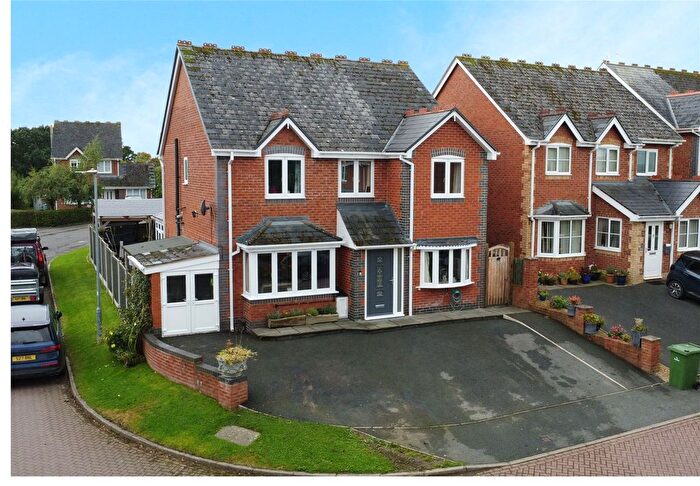
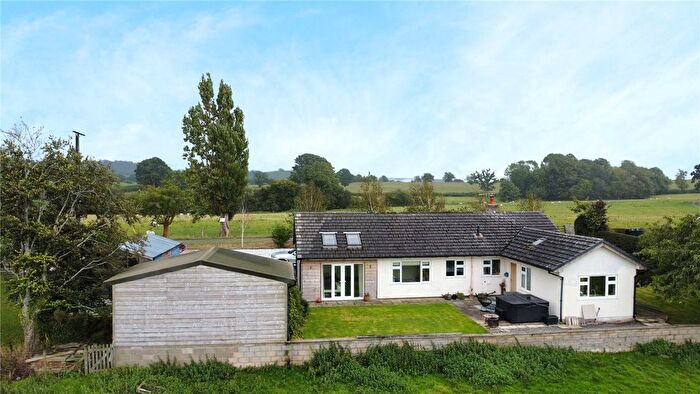
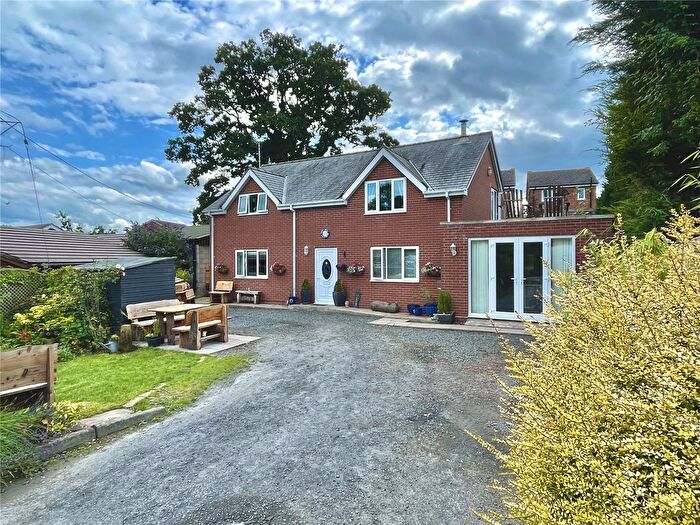
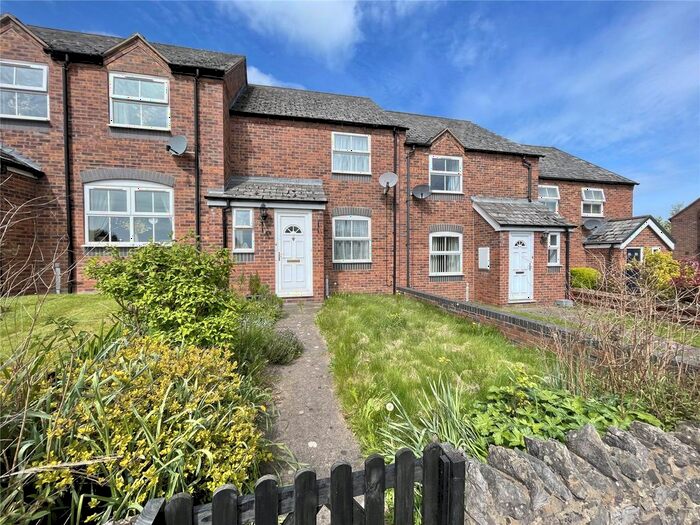
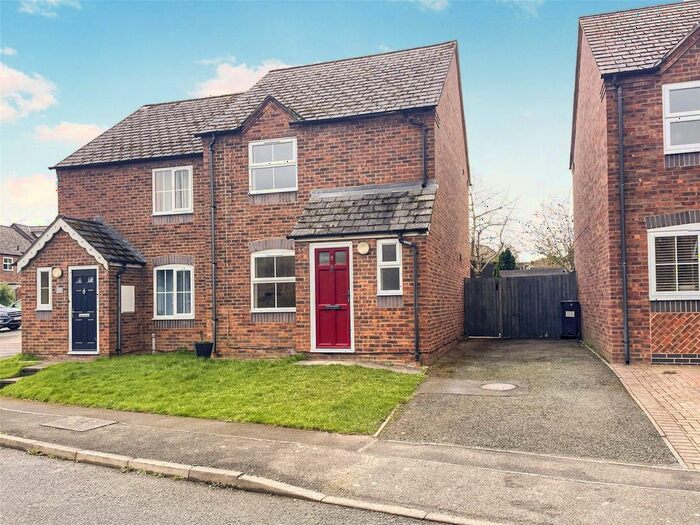
Houses for sale & to rent in Forden, Welshpool
House Prices in Forden
Properties in Forden have an average house price of £294,498.00 and had 55 Property Transactions within the last 3 years¹.
Forden is an area in Welshpool, Powys - Powys with 601 households², where the most expensive property was sold for £605,000.00.
Properties for sale in Forden
Previously listed properties in Forden
Roads and Postcodes in Forden
Navigate through our locations to find the location of your next house in Forden, Welshpool for sale or to rent.
| Streets | Postcodes |
|---|---|
| Bytakes Cottages | SY21 8HQ |
| Camlad Drive | SY21 8NY |
| Church Farm Close | SY21 8FD |
| Heatherwood | SY21 8LQ |
| Heritage Green | SY21 8LH |
| Kingswood | SY21 8TS SY21 8TT |
| Leighton Road | SY21 8LU |
| Maes Y Felin | SY21 8NT |
| Pentre Berllan | SY21 8GA |
| Poplar Drive | SY21 8JG |
| Redwood Close | SY21 8JH |
| Redwood Terrace | SY21 8LG |
| Springfields | SY21 8LR |
| St Michaels Crescent | SY21 8NF SY21 8NQ |
| The Pentre | SY21 8HW |
| Trelystan | SY21 8HX SY21 8HZ SY21 8JA SY21 8HY SY21 8LB SY21 8LD |
| Waterloo Fields | SY21 8LF |
| Withy Avenue | SY21 8NJ |
| Withy Close | SY21 8PA |
| Withy Court | SY21 8PT |
| SY21 8HH SY21 8HJ SY21 8HL SY21 8HN SY21 8HP SY21 8HR SY21 8HS SY21 8JZ SY21 8LA SY21 8LE SY21 8LJ SY21 8LN SY21 8LP SY21 8LS SY21 8LT SY21 8LW SY21 8LX SY21 8LZ SY21 8NA SY21 8NB SY21 8NE SY21 8NH SY21 8NL SY21 8NN SY21 8NR SY21 8NU SY21 8RT SY21 8RX SY21 8RY SY21 8RZ SY21 8TP SY21 8TR SY21 8FA SY21 8HT SY21 8HU SY21 8JJ SY21 8LL SY21 8LY SY21 8ND SY21 8NG SY21 8NP SY21 8NW SY21 8NX SY21 8NZ SY21 8RU SY21 8TU |
Transport near Forden
- FAQ
- Price Paid By Year
- Property Type Price
Frequently asked questions about Forden
What is the average price for a property for sale in Forden?
The average price for a property for sale in Forden is £294,498. This amount is 14% higher than the average price in Welshpool. There are 173 property listings for sale in Forden.
What streets have the most expensive properties for sale in Forden?
The streets with the most expensive properties for sale in Forden are Trelystan at an average of £595,000, Poplar Drive at an average of £511,250 and Church Farm Close at an average of £331,000.
What streets have the most affordable properties for sale in Forden?
The streets with the most affordable properties for sale in Forden are St Michaels Crescent at an average of £104,000, Springfields at an average of £181,000 and Waterloo Fields at an average of £189,687.
Which train stations are available in or near Forden?
Some of the train stations available in or near Forden are Welshpool, Newtown and Church Stretton.
Property Price Paid in Forden by Year
The average sold property price by year was:
| Year | Average Sold Price | Price Change |
Sold Properties
|
|---|---|---|---|
| 2025 | £297,937 | 5% |
16 Properties |
| 2024 | £283,009 | -8% |
21 Properties |
| 2023 | £304,844 | -13% |
18 Properties |
| 2022 | £343,875 | 13% |
16 Properties |
| 2021 | £298,429 | 13% |
29 Properties |
| 2020 | £260,244 | 20% |
25 Properties |
| 2019 | £207,963 | -15% |
36 Properties |
| 2018 | £240,155 | 9% |
23 Properties |
| 2017 | £219,676 | -37% |
17 Properties |
| 2016 | £300,818 | 34% |
11 Properties |
| 2015 | £199,878 | -2% |
21 Properties |
| 2014 | £204,835 | -10% |
21 Properties |
| 2013 | £226,338 | 19% |
22 Properties |
| 2012 | £182,205 | -26% |
10 Properties |
| 2011 | £229,034 | 2% |
13 Properties |
| 2010 | £224,321 | 28% |
14 Properties |
| 2009 | £161,282 | -42% |
14 Properties |
| 2008 | £228,797 | 11% |
20 Properties |
| 2007 | £204,375 | -19% |
18 Properties |
| 2006 | £244,183 | 29% |
30 Properties |
| 2005 | £172,887 | 17% |
27 Properties |
| 2004 | £143,247 | 0,4% |
17 Properties |
| 2003 | £142,605 | 36% |
30 Properties |
| 2002 | £90,969 | 18% |
22 Properties |
| 2001 | £74,184 | 0,4% |
19 Properties |
| 2000 | £73,877 | 3% |
51 Properties |
| 1999 | £71,351 | -2% |
21 Properties |
| 1998 | £72,694 | 17% |
19 Properties |
| 1997 | £60,435 | -21% |
21 Properties |
| 1996 | £73,110 | 25% |
5 Properties |
| 1995 | £54,545 | - |
27 Properties |
Property Price per Property Type in Forden
Here you can find historic sold price data in order to help with your property search.
The average Property Paid Price for specific property types in the last three years are:
| Property Type | Average Sold Price | Sold Properties |
|---|---|---|
| Semi Detached House | £200,870.00 | 10 Semi Detached Houses |
| Detached House | £340,783.00 | 36 Detached Houses |
| Terraced House | £213,388.00 | 9 Terraced Houses |

