
Houses for sale & to rent in Welshpool Castle, Welshpool
House Prices in Welshpool Castle
Properties in Welshpool Castle have an average house price of £181k and had 29 Property Transactions within the last 3 years¹.
Welshpool Castle is an area in Welshpool, Powys - Powys with 747 households², where the most expensive property was sold for £365k.
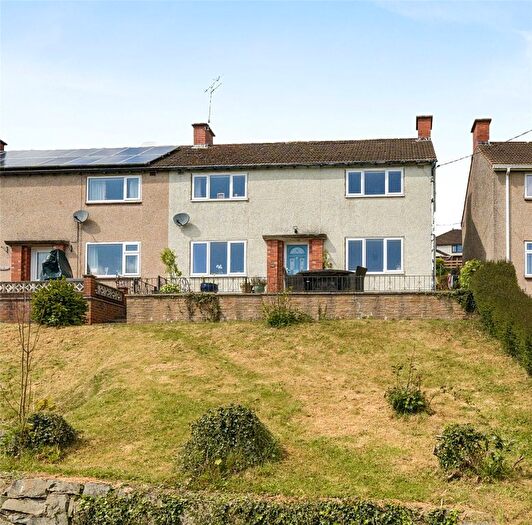
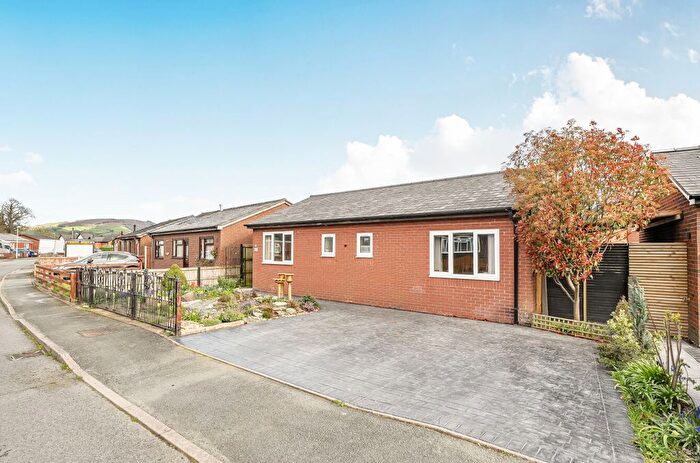
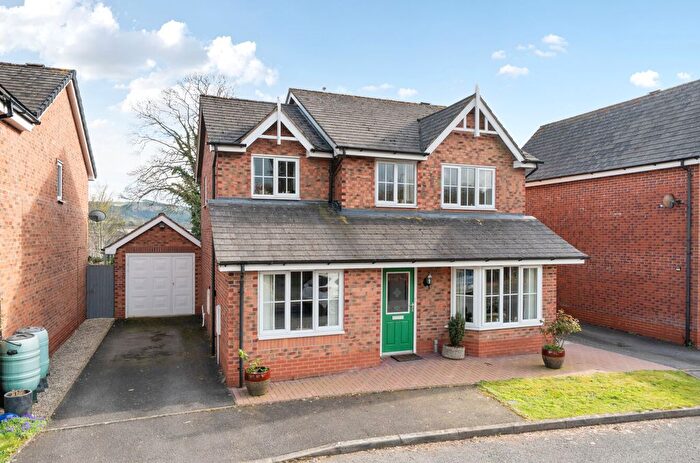
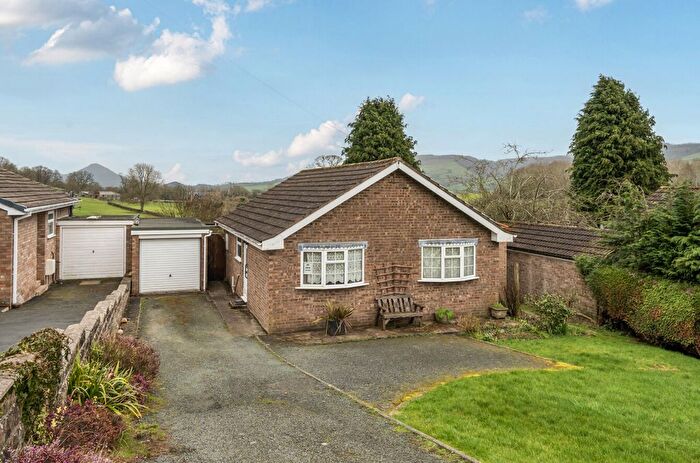
Properties for sale in Welshpool Castle
Previously listed properties in Welshpool Castle
![]()
If you are looking to sell your house, let it out, or receive a property valuation, an expert can help you.
Click the button below to get started.

Roads and Postcodes in Welshpool Castle
Navigate through our locations to find the location of your next house in Welshpool Castle, Welshpool for sale or to rent.
Transport near Welshpool Castle
-
 Welshpool Station
 -
Newtown Station
-
Caersws Station
-
Church Stretton Station
-
Gobowen Station
-
Shrewsbury Station
-
Broome Station
-
Craven Arms Station
-
Chirk Station
- FAQ
- Price Paid By Year
- Property Type Price
Frequently asked questions about Welshpool Castle
What is the average price for a property for sale in Welshpool Castle?
The average price for a property for sale in Welshpool Castle is £180,982. This amount is 30% lower than the average price in Welshpool. There are 114 property listings for sale in Welshpool Castle.
What streets have the most expensive properties for sale in Welshpool Castle?
The streets with the most expensive properties for sale in Welshpool Castle are Severn Lane at an average of £256,000, Oldford Lane at an average of £235,000 and Berriew Road at an average of £235,000.
What streets have the most affordable properties for sale in Welshpool Castle?
The streets with the most affordable properties for sale in Welshpool Castle are Mount Street at an average of £111,428, New Street at an average of £114,250 and Prince Of Wales Drive at an average of £115,000.
Which train stations are available in or near Welshpool Castle?
Some of the train stations available in or near Welshpool Castle are Welshpool, Newtown and Caersws.
Property Price Paid in Welshpool Castle by Year
The average sold property price by year was:
| Year | Average Sold Price | Price Change |
Sold Properties
|
|---|---|---|---|
| 2025 | £169,590 | -18% |
11 Properties |
| 2024 | £199,875 | 11% |
8 Properties |
| 2023 | £178,400 | -26% |
10 Properties |
| 2022 | £224,454 | 24% |
11 Properties |
| 2021 | £170,166 | 25% |
18 Properties |
| 2020 | £127,944 | -13% |
9 Properties |
| 2019 | £144,166 | -3% |
9 Properties |
| 2018 | £148,500 | 4% |
8 Properties |
| 2017 | £142,777 | 12% |
9 Properties |
| 2016 | £125,312 | -13% |
8 Properties |
| 2015 | £141,519 | -76% |
13 Properties |
| 2014 | £249,000 | 54% |
4 Properties |
| 2013 | £114,000 | 8% |
5 Properties |
| 2012 | £105,357 | -15% |
7 Properties |
| 2011 | £121,409 | 8% |
11 Properties |
| 2010 | £112,170 | 23% |
13 Properties |
| 2009 | £86,833 | -48% |
6 Properties |
| 2008 | £128,636 | -44% |
11 Properties |
| 2007 | £184,600 | 21% |
10 Properties |
| 2006 | £146,669 | 16% |
13 Properties |
| 2005 | £123,825 | 10% |
11 Properties |
| 2004 | £111,950 | 20% |
10 Properties |
| 2003 | £89,447 | 19% |
22 Properties |
| 2002 | £72,458 | -3% |
18 Properties |
| 2001 | £74,825 | -2% |
12 Properties |
| 2000 | £76,236 | 18% |
19 Properties |
| 1999 | £62,619 | 24% |
15 Properties |
| 1998 | £47,431 | 3% |
11 Properties |
| 1997 | £45,958 | -0,3% |
12 Properties |
| 1996 | £46,096 | 21% |
13 Properties |
| 1995 | £36,540 | - |
11 Properties |
Property Price per Property Type in Welshpool Castle
Here you can find historic sold price data in order to help with your property search.
The average Property Paid Price for specific property types in the last three years are:
| Property Type | Average Sold Price | Sold Properties |
|---|---|---|
| Semi Detached House | £176,583.00 | 6 Semi Detached Houses |
| Detached House | £302,800.00 | 5 Detached Houses |
| Terraced House | £152,352.00 | 17 Terraced Houses |
| Flat | £85,000.00 | 1 Flat |