
Houses for sale & to rent in Llantrisant Town, Pontypridd
House Prices in Llantrisant Town
Properties in Llantrisant Town have an average house price of £285,393.00 and had 31 Property Transactions within the last 3 years¹.
Llantrisant Town is an area in Pontypridd, Rhondda Cynon Taf - Rhondda Cynon Taf with 233 households², where the most expensive property was sold for £395,000.00.
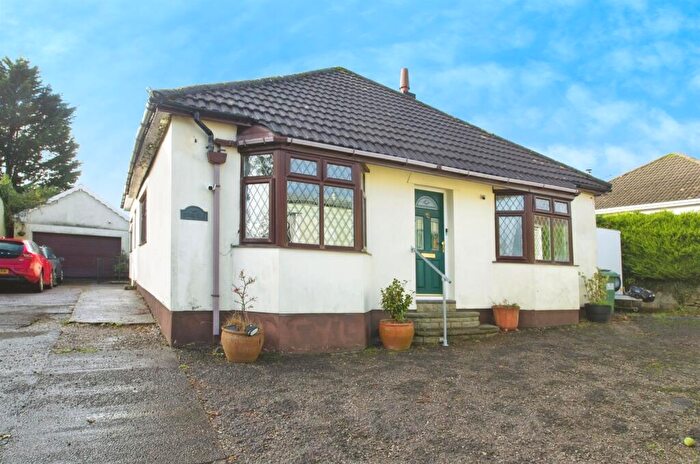
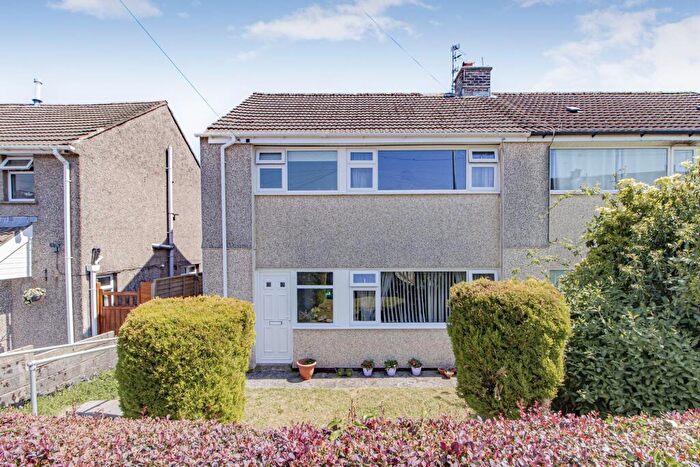
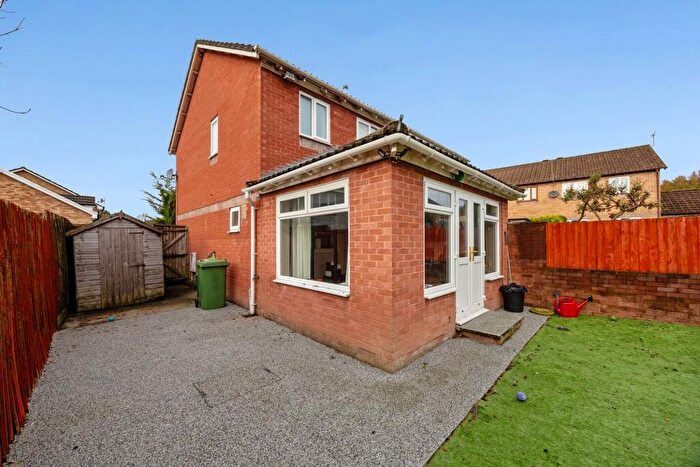
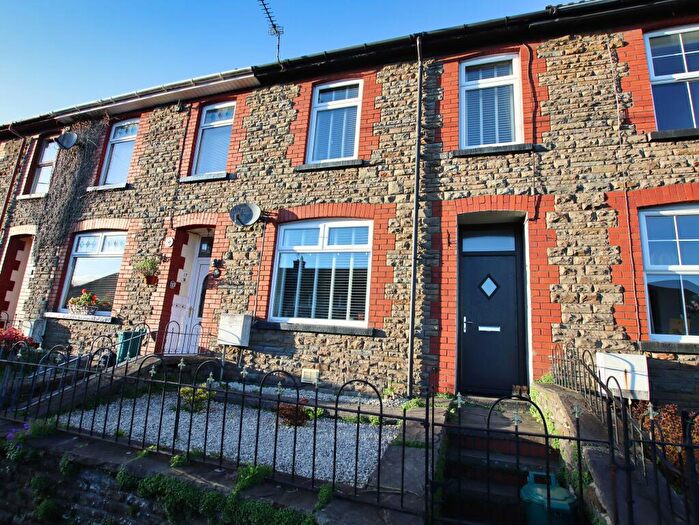
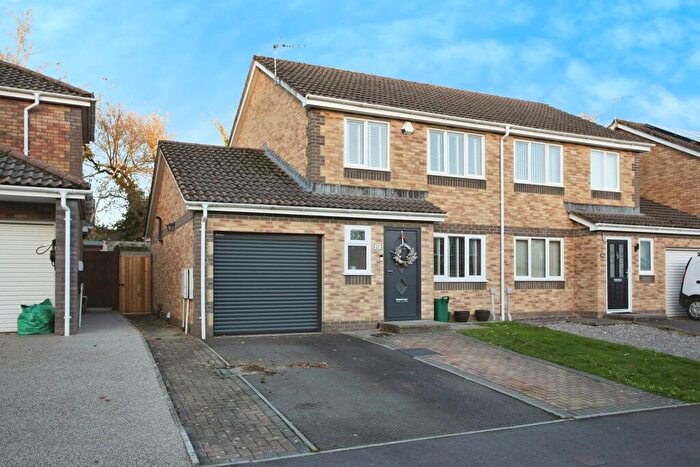
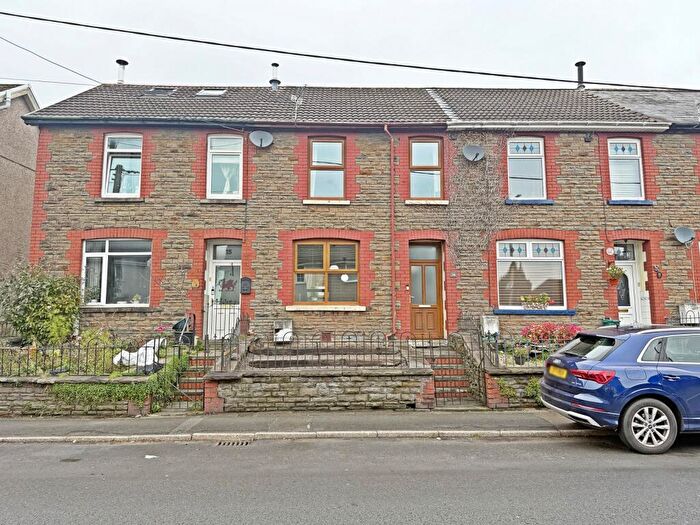
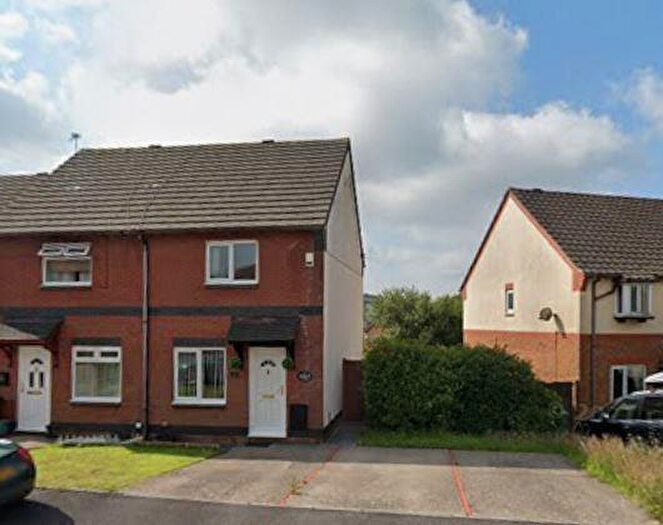
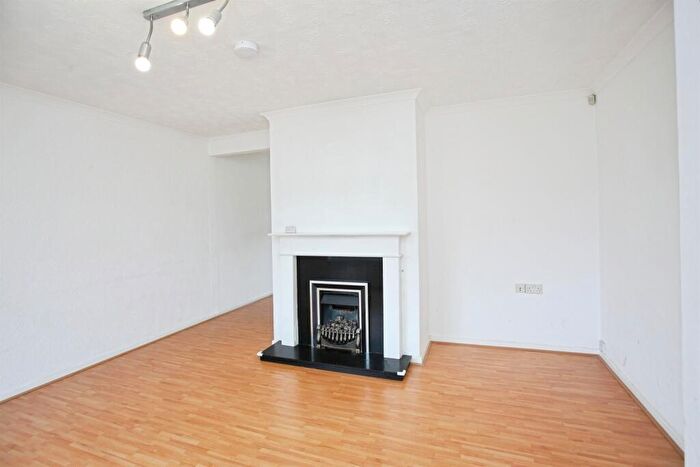
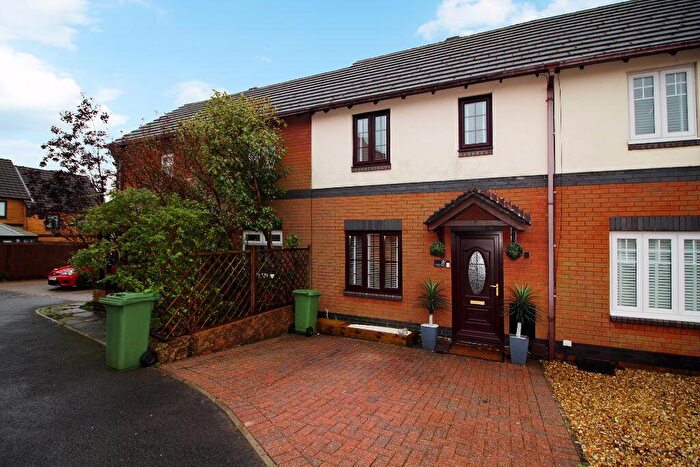
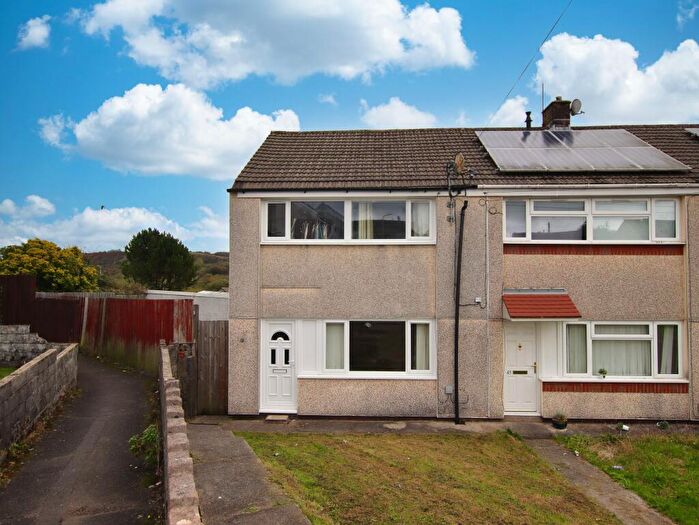
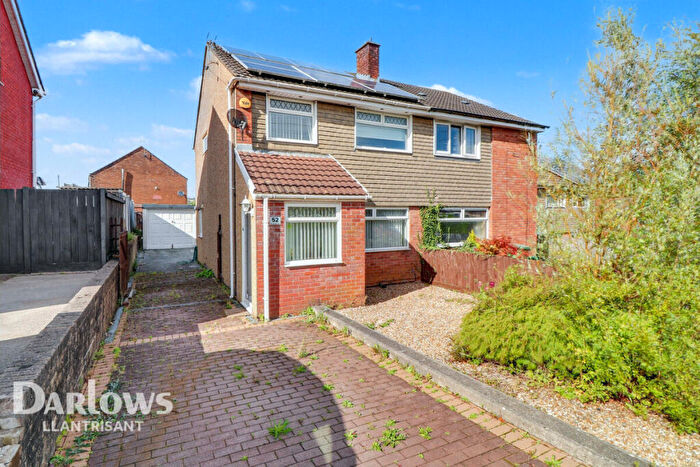
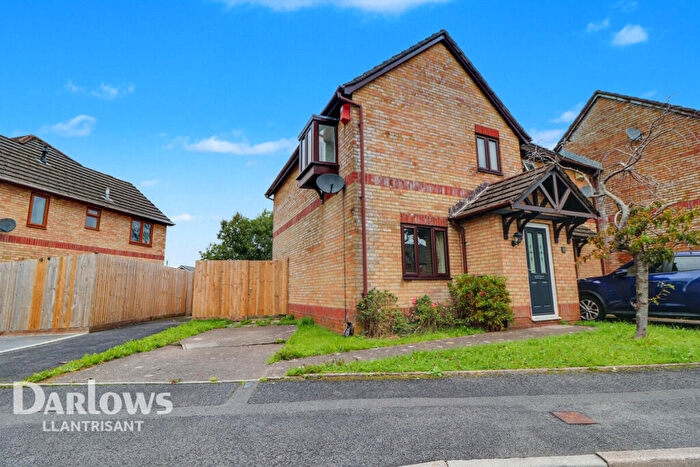
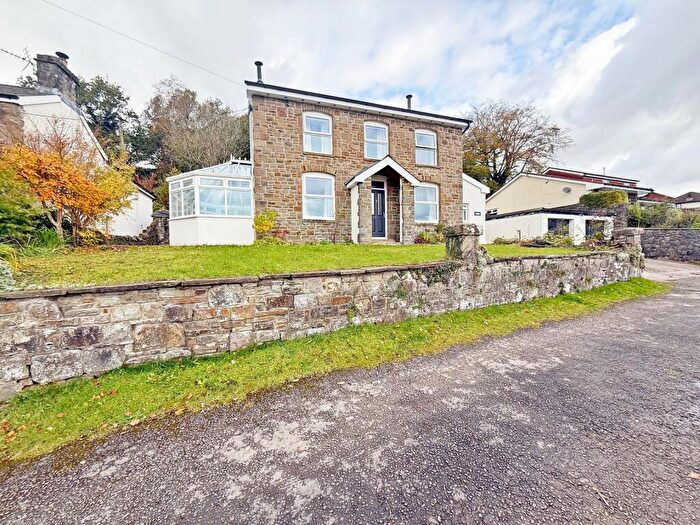
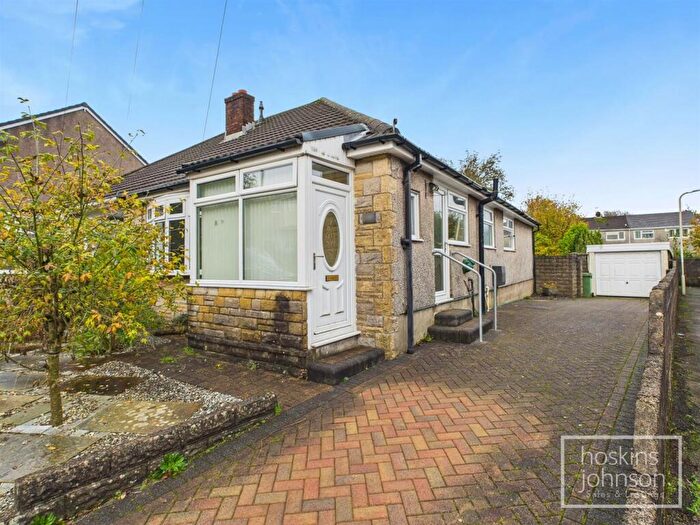
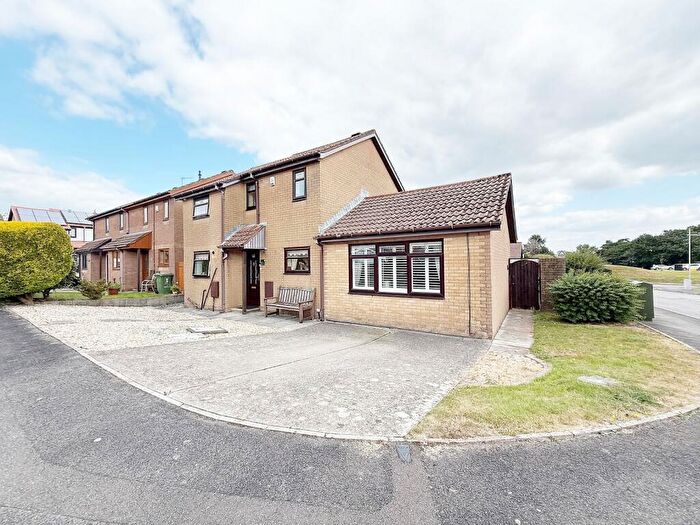
Properties for sale in Llantrisant Town
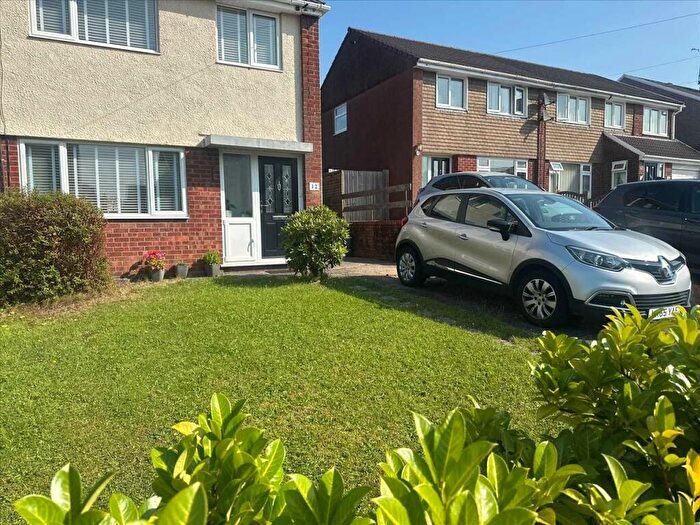
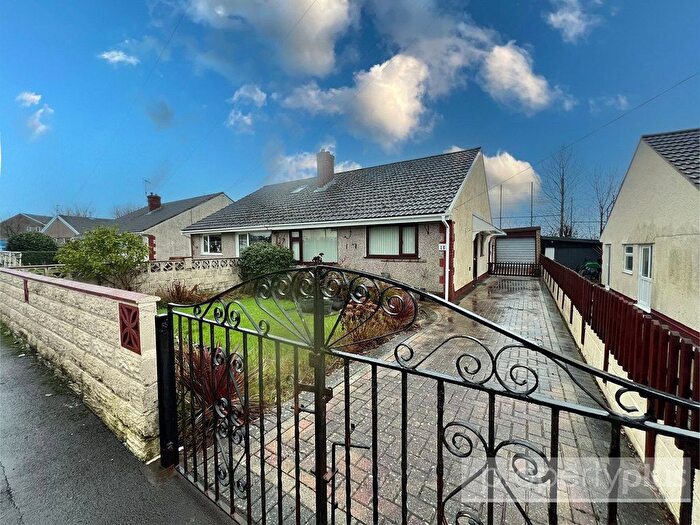

![]()
If you are looking to sell your house, let it out, or receive a property valuation, an expert can help you.
Click the button below to get started.


Roads and Postcodes in Llantrisant Town
Navigate through our locations to find the location of your next house in Llantrisant Town, Pontypridd for sale or to rent.
| Streets | Postcodes |
|---|---|
| Cae Garw | CF38 2TQ |
| Clos Cefn Glas | CF38 2BS |
| Clos Collwyn | CF38 2DX |
| Clos Dyfodwg | CF38 2TP |
| Clos Y Carw | CF38 2BP |
| Ffordd Glas Y Dorlan | CF38 2BZ |
| Ffordd Gwynno | CF38 2TR |
| Heol Isaf | CF38 2TJ |
| Heol Rhosyn | CF38 2TH |
| CF38 1RH |
Transport near Llantrisant Town

- FAQ
- Price Paid By Year
- Property Type Price
Frequently asked questions about Llantrisant Town
What is the average price for a property for sale in Llantrisant Town?
The average price for a property for sale in Llantrisant Town is £285,393. This amount is 56% higher than the average price in Pontypridd. There are 730 property listings for sale in Llantrisant Town.
What streets have the most expensive properties for sale in Llantrisant Town?
The streets with the most expensive properties for sale in Llantrisant Town are Clos Cefn Glas at an average of £303,750, Cae Garw at an average of £300,833 and Clos Y Carw at an average of £289,983.
What streets have the most affordable properties for sale in Llantrisant Town?
The streets with the most affordable properties for sale in Llantrisant Town are Clos Dyfodwg at an average of £251,000, Ffordd Glas Y Dorlan at an average of £283,600 and Ffordd Gwynno at an average of £286,421.
Which train stations are available in or near Llantrisant Town?
Some of the train stations available in or near Llantrisant Town are Trefforest Estate, Pontyclun and Trefforest.
Property Price Paid in Llantrisant Town by Year
The average sold property price by year was:
| Year | Average Sold Price | Price Change |
Sold Properties
|
|---|---|---|---|
| 2025 | £258,000 | -17% |
5 Properties |
| 2024 | £301,105 | 7% |
9 Properties |
| 2023 | £279,370 | -7% |
12 Properties |
| 2022 | £298,960 | 14% |
5 Properties |
| 2021 | £257,687 | 16% |
8 Properties |
| 2020 | £215,426 | 1% |
15 Properties |
| 2019 | £212,940 | -6% |
10 Properties |
| 2018 | £226,388 | 14% |
9 Properties |
| 2017 | £194,023 | -5% |
19 Properties |
| 2016 | £202,869 | 11% |
13 Properties |
| 2015 | £180,065 | 19% |
22 Properties |
| 2014 | £145,079 | -7% |
12 Properties |
| 2013 | £155,312 | -8% |
8 Properties |
| 2012 | £167,318 | 11% |
11 Properties |
| 2011 | £149,406 | 2% |
8 Properties |
| 2010 | £146,878 | 2% |
8 Properties |
| 2009 | £144,071 | -18% |
7 Properties |
| 2008 | £169,709 | 4% |
16 Properties |
| 2007 | £163,641 | 7% |
37 Properties |
| 2006 | £152,669 | -12% |
30 Properties |
| 2005 | £171,654 | 18% |
22 Properties |
| 2004 | £140,469 | 14% |
21 Properties |
| 2003 | £120,870 | 8% |
34 Properties |
| 2002 | £110,603 | 6% |
30 Properties |
| 2001 | £103,769 | 7% |
26 Properties |
| 2000 | £96,761 | 7% |
26 Properties |
| 1999 | £89,966 | - |
3 Properties |
Property Price per Property Type in Llantrisant Town
Here you can find historic sold price data in order to help with your property search.
The average Property Paid Price for specific property types in the last three years are:
| Property Type | Average Sold Price | Sold Properties |
|---|---|---|
| Semi Detached House | £238,533.00 | 15 Semi Detached Houses |
| Terraced House | £288,750.00 | 2 Terraced Houses |
| Detached House | £335,121.00 | 14 Detached Houses |