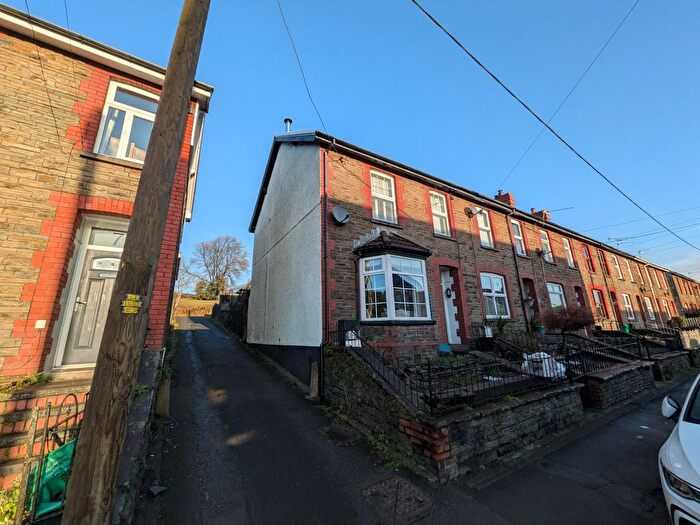
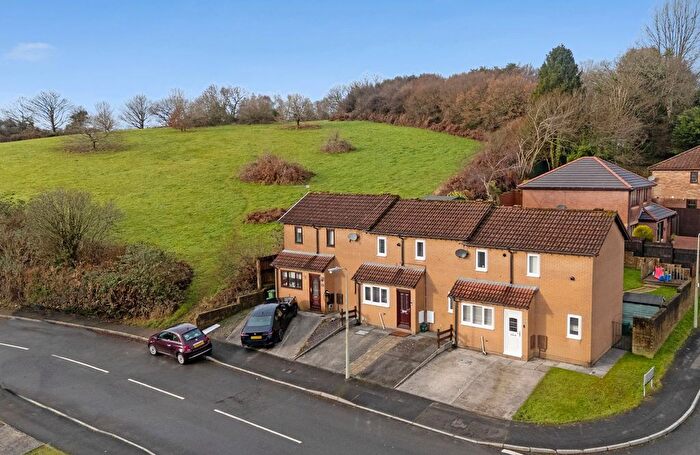
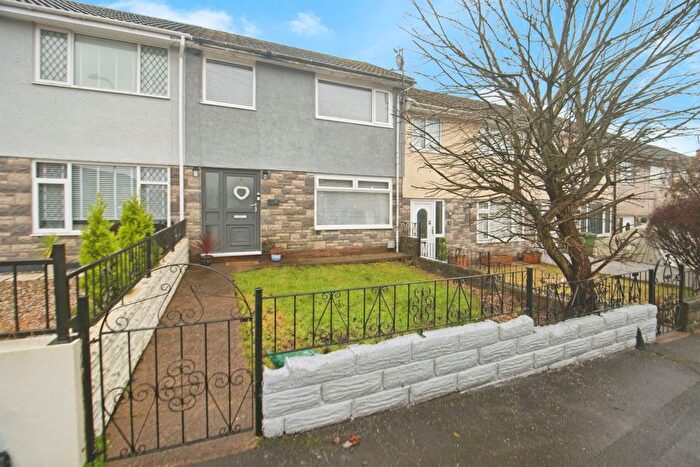
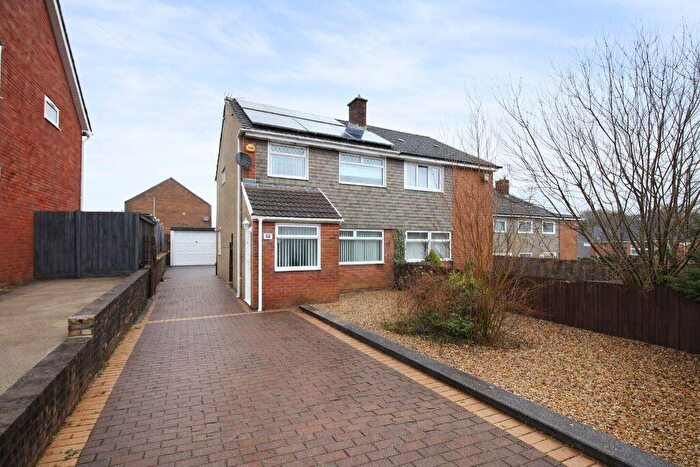
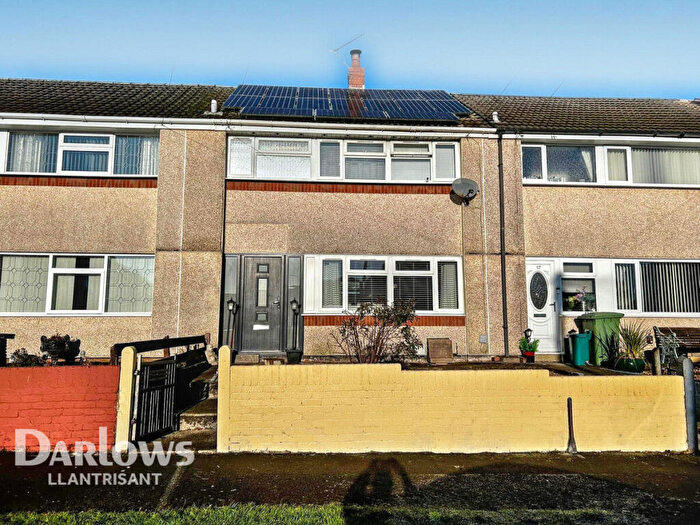
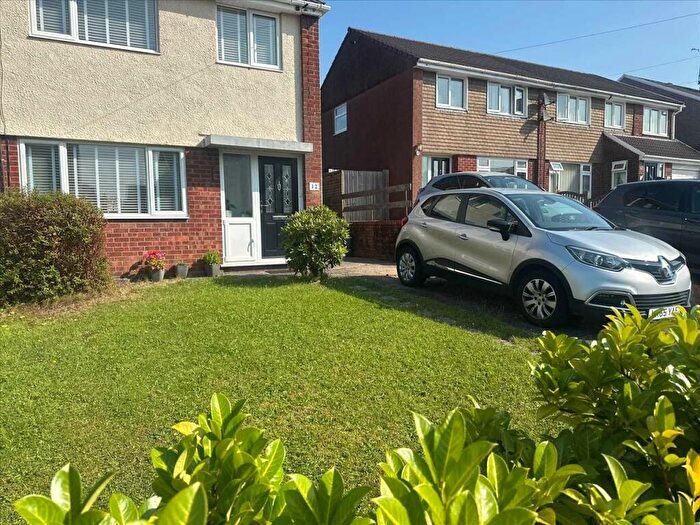
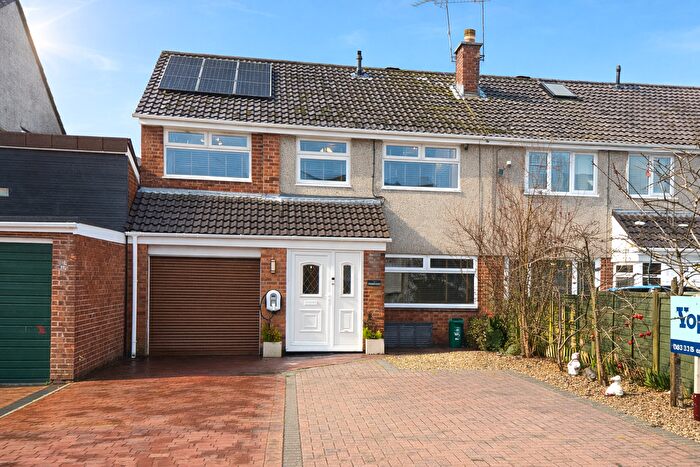
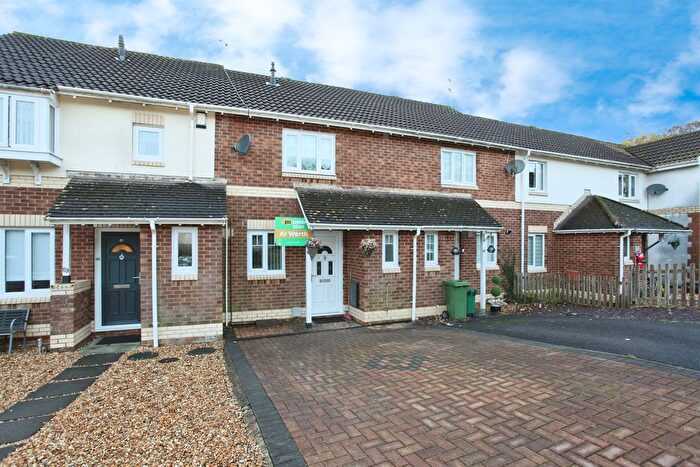
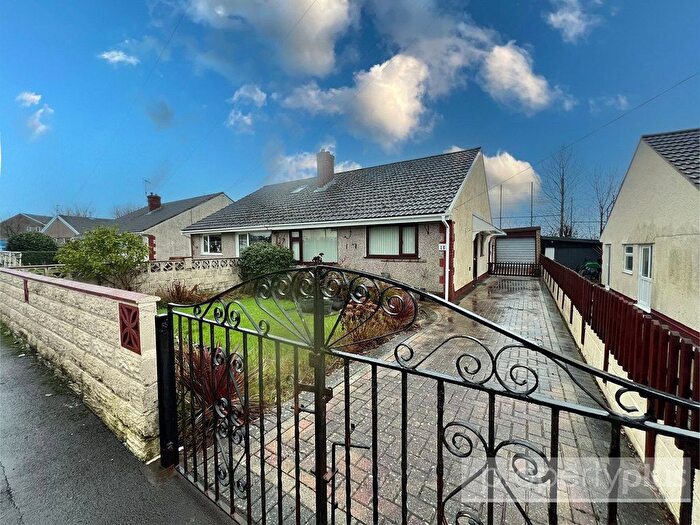
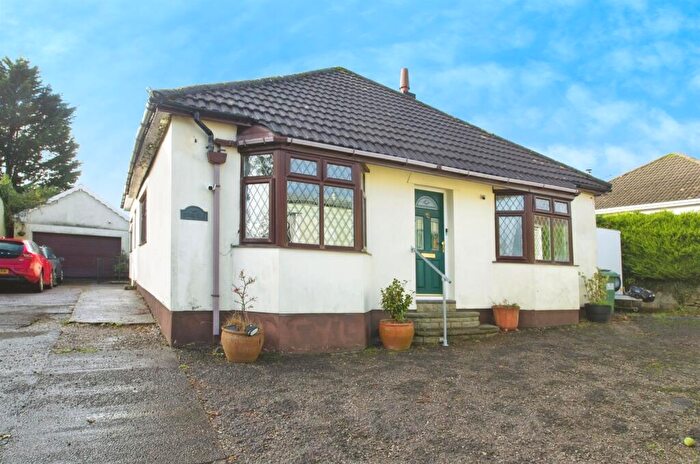
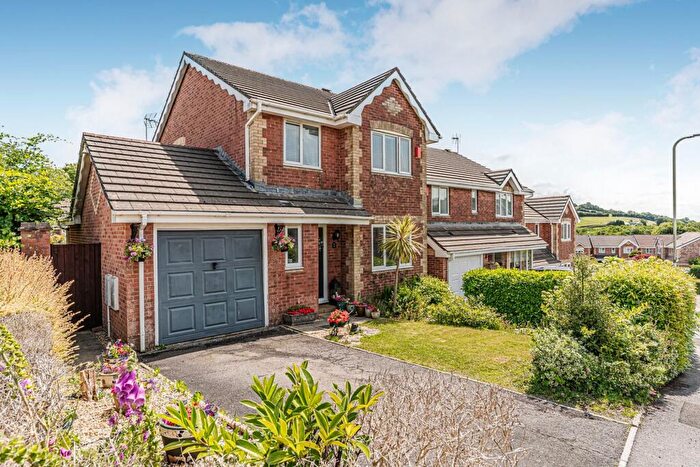
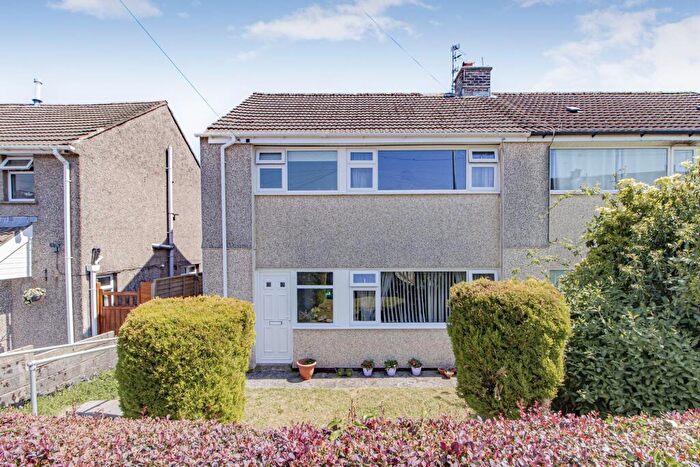
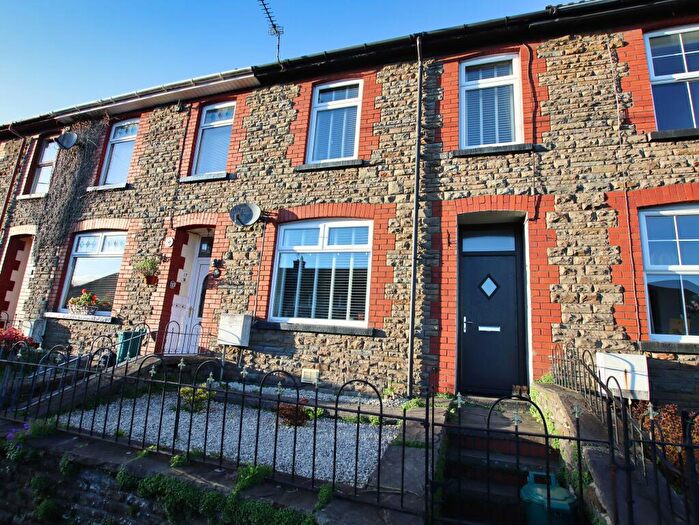
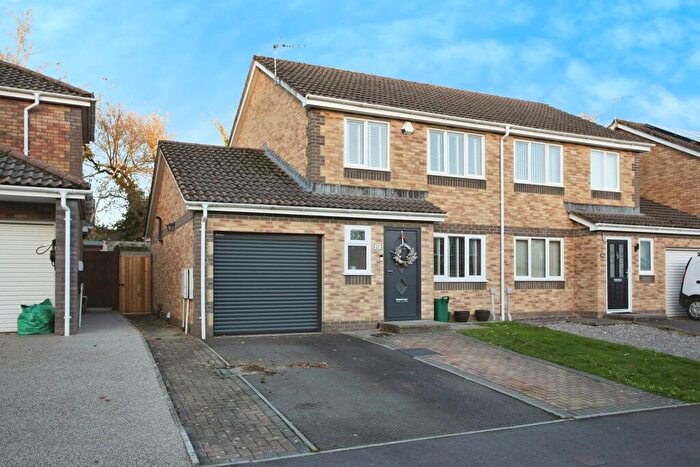
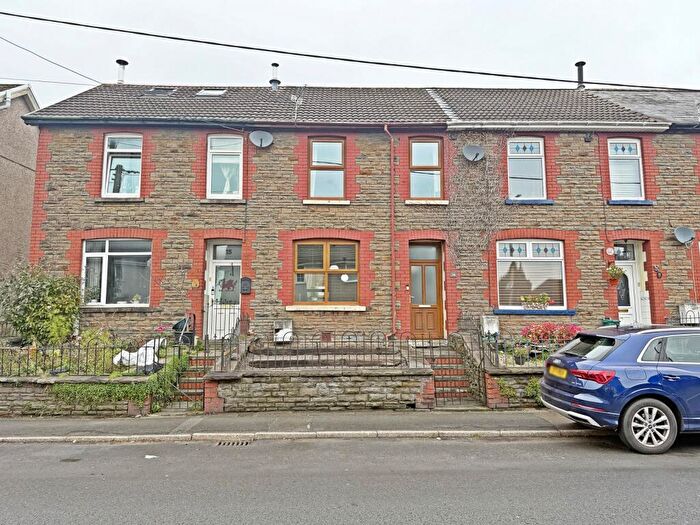
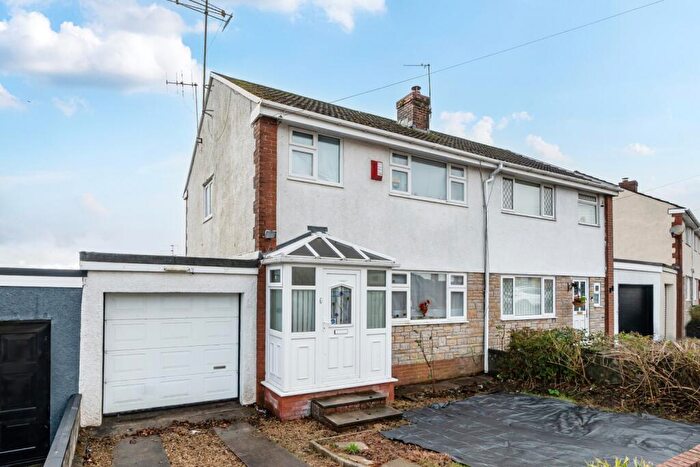
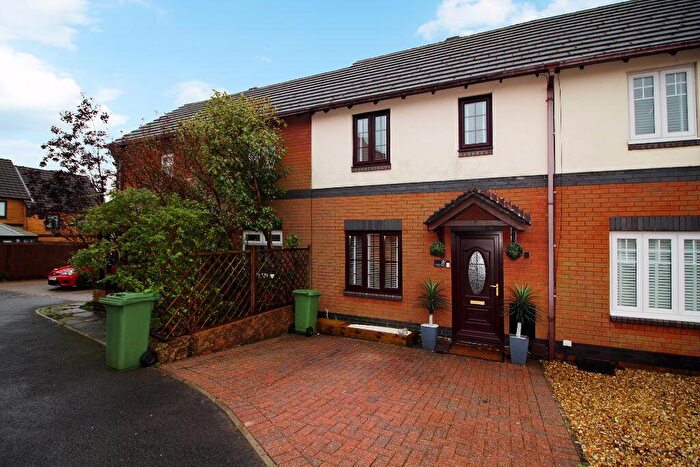
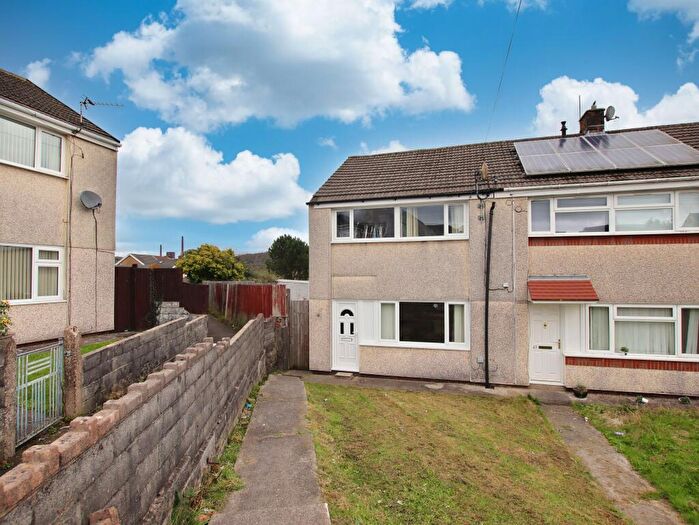
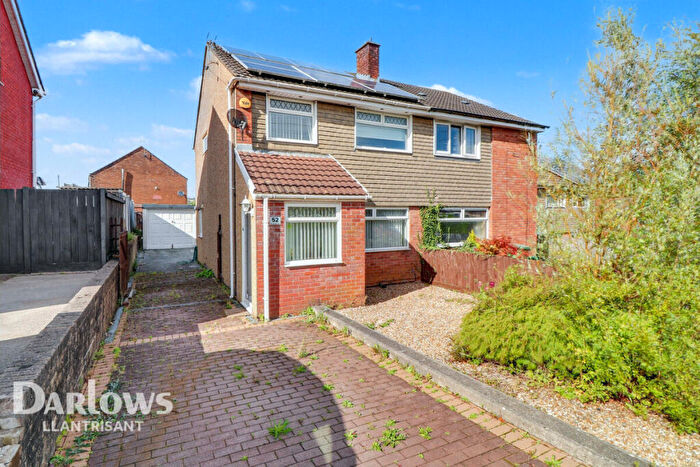
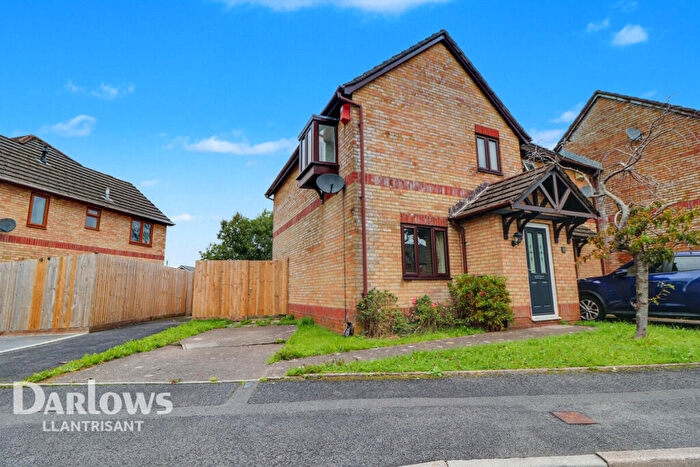
Houses for sale & to rent in Tyn-y-nant, Pontypridd
House Prices in Tyn-y-nant
Properties in Tyn-y-nant have an average house price of £178,081.00 and had 123 Property Transactions within the last 3 years¹.
Tyn-y-nant is an area in Pontypridd, Rhondda Cynon Taf - Rhondda Cynon Taf with 1,430 households², where the most expensive property was sold for £310,000.00.
Properties for sale in Tyn-y-nant
Roads and Postcodes in Tyn-y-nant
Navigate through our locations to find the location of your next house in Tyn-y-nant, Pontypridd for sale or to rent.
| Streets | Postcodes |
|---|---|
| Ael Y Bryn | CF38 2AL |
| Bryn Derw | CF38 2AN |
| Calderton Road | CF38 2LL |
| Caldicott Close | CF38 2LE |
| Caldwell Close | CF38 2LG |
| Camperly Close | CF38 2LF |
| Campton Place | CF38 2RT |
| Cargill Close | CF38 2RU |
| Carlton Crescent | CF38 2RS |
| Carshalton Road | CF38 2LH |
| Carswell Place | CF38 2RY |
| Castleford Close | CF38 2RW |
| Cavendish Place | CF38 2RP |
| Centenary Court | CF38 2DL |
| Chalfont Close | CF38 2SA |
| Chalvington Close | CF38 2RR |
| Claverton Close | CF38 2SB |
| Colbourne Road | CF38 2LN |
| Commercial Street | CF38 2DB CF38 2DD |
| Common Approach | CF38 2BL |
| Crawford Close | CF38 2SD |
| Fair View | CF38 2DE |
| Forest Road | CF38 2DP |
| Garth View | CF38 2BY |
| Gospel Court | CF38 2JQ |
| Gwaunmiskin Road | CF38 2BA |
| Heol Coroniad | CF38 2AT |
| Heol Ida | CF38 2AR |
| Heol Y Beddau | CF38 2AG |
| Hill View | CF38 2DS |
| Kennedy Close | CF38 2DF |
| Liddon Court | CF38 2GF |
| Mildred Close | CF38 2AQ |
| Mildred Street | CF38 2AP CF38 2AW |
| Miskin Court | CF38 2FD |
| Moorland Crescent | CF38 2DN CF38 2DW |
| Parish Road | CF38 2BT CF38 2BU |
| Penycoedcae Road | CF38 2AF |
| Pleasant View | CF38 2DT |
| Tan Y Bryn | CF38 2AS |
| Trem Y Cwm | CF38 2EA |
| Tynant Road | CF38 2DA |
| Upton Place | CF38 2DR |
| Wellfield | CF38 2BW |
| Wellfield Mews | CF38 2BX |
| Windsor Gardens | CF38 2PS |
| Woodland Road | CF38 2DG CF38 2SE |
| CF38 2PU CF38 2PY |
Transport near Tyn-y-nant
- FAQ
- Price Paid By Year
- Property Type Price
Frequently asked questions about Tyn-y-nant
What is the average price for a property for sale in Tyn-y-nant?
The average price for a property for sale in Tyn-y-nant is £178,081. This amount is 3% lower than the average price in Pontypridd. There are 736 property listings for sale in Tyn-y-nant.
What streets have the most expensive properties for sale in Tyn-y-nant?
The streets with the most expensive properties for sale in Tyn-y-nant are Castleford Close at an average of £252,250, Camperly Close at an average of £250,000 and Caldwell Close at an average of £250,000.
What streets have the most affordable properties for sale in Tyn-y-nant?
The streets with the most affordable properties for sale in Tyn-y-nant are Kennedy Close at an average of £111,166, Moorland Crescent at an average of £130,250 and Heol Y Beddau at an average of £140,000.
Which train stations are available in or near Tyn-y-nant?
Some of the train stations available in or near Tyn-y-nant are Trefforest, Trefforest Estate and Pontyclun.
Property Price Paid in Tyn-y-nant by Year
The average sold property price by year was:
| Year | Average Sold Price | Price Change |
Sold Properties
|
|---|---|---|---|
| 2025 | £184,089 | -0,3% |
19 Properties |
| 2024 | £184,620 | 6% |
36 Properties |
| 2023 | £174,360 | 1% |
26 Properties |
| 2022 | £172,060 | 6% |
42 Properties |
| 2021 | £162,312 | 7% |
41 Properties |
| 2020 | £151,264 | 9% |
28 Properties |
| 2019 | £137,035 | 5% |
44 Properties |
| 2018 | £130,271 | 4% |
55 Properties |
| 2017 | £125,710 | 10% |
40 Properties |
| 2016 | £112,589 | -7% |
32 Properties |
| 2015 | £120,032 | -3% |
31 Properties |
| 2014 | £123,133 | 13% |
42 Properties |
| 2013 | £106,998 | 8% |
27 Properties |
| 2012 | £98,065 | 11% |
22 Properties |
| 2011 | £87,197 | -27% |
24 Properties |
| 2010 | £110,338 | 2% |
17 Properties |
| 2009 | £107,820 | -5% |
17 Properties |
| 2008 | £112,975 | -0,4% |
13 Properties |
| 2007 | £113,456 | 2% |
44 Properties |
| 2006 | £111,444 | 11% |
45 Properties |
| 2005 | £99,241 | 8% |
35 Properties |
| 2004 | £91,525 | 17% |
50 Properties |
| 2003 | £76,045 | 30% |
59 Properties |
| 2002 | £53,135 | 6% |
49 Properties |
| 2001 | £50,109 | 10% |
47 Properties |
| 2000 | £44,932 | 8% |
41 Properties |
| 1999 | £41,477 | 1% |
27 Properties |
| 1998 | £40,988 | 11% |
38 Properties |
| 1997 | £36,627 | -8% |
39 Properties |
| 1996 | £39,622 | -9% |
45 Properties |
| 1995 | £43,189 | - |
40 Properties |
Property Price per Property Type in Tyn-y-nant
Here you can find historic sold price data in order to help with your property search.
The average Property Paid Price for specific property types in the last three years are:
| Property Type | Average Sold Price | Sold Properties |
|---|---|---|
| Semi Detached House | £200,627.00 | 57 Semi Detached Houses |
| Detached House | £283,750.00 | 4 Detached Houses |
| Terraced House | £150,535.00 | 62 Terraced Houses |

