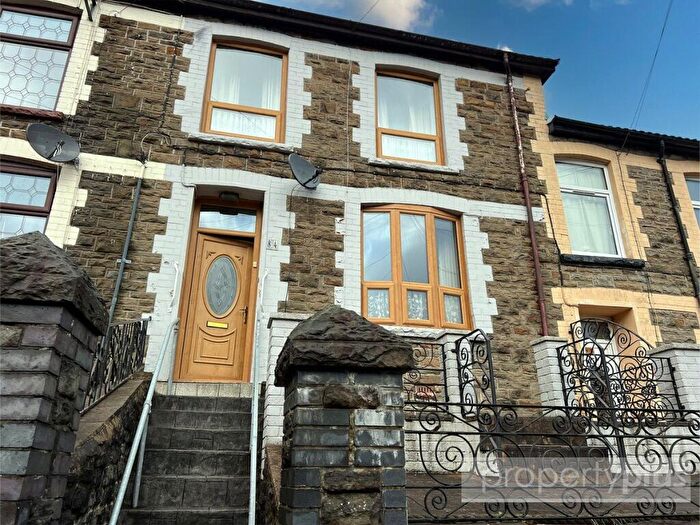
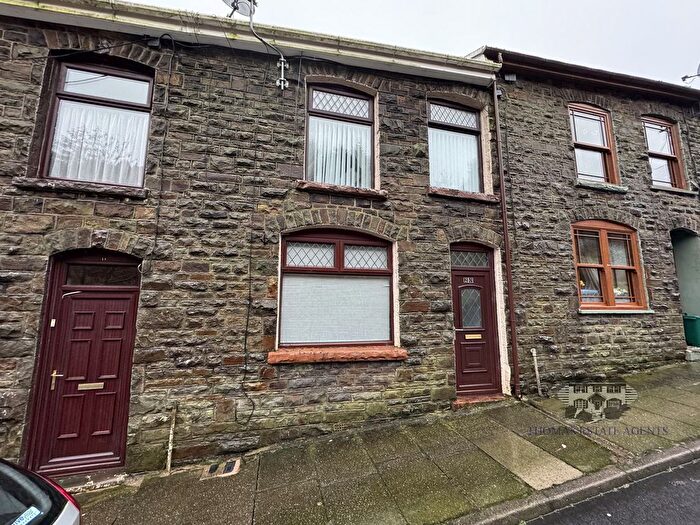
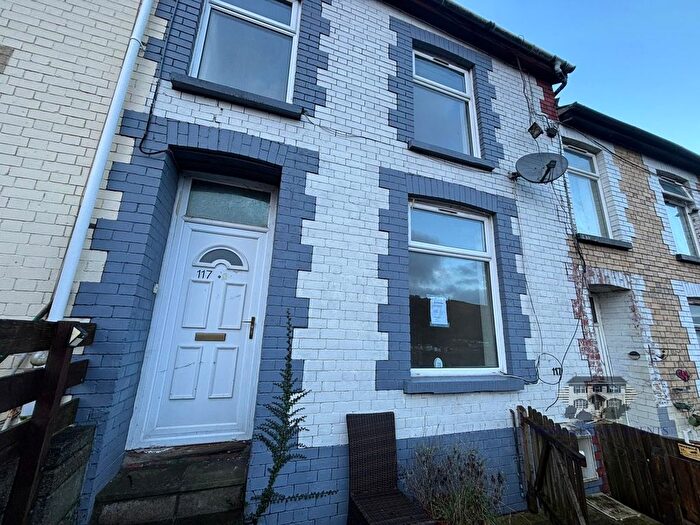
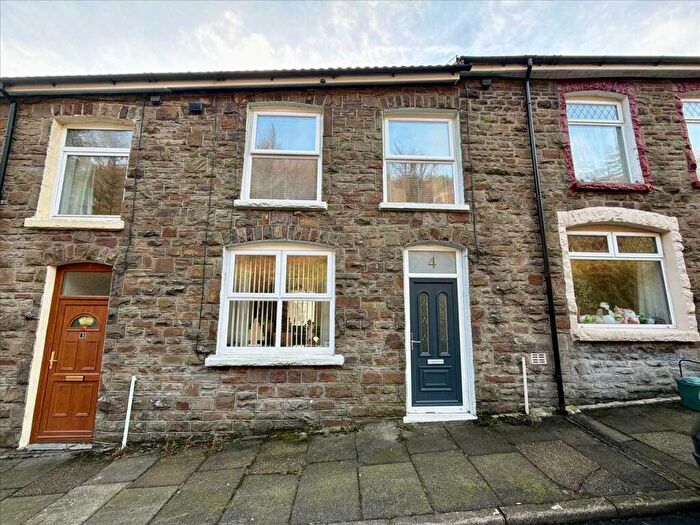
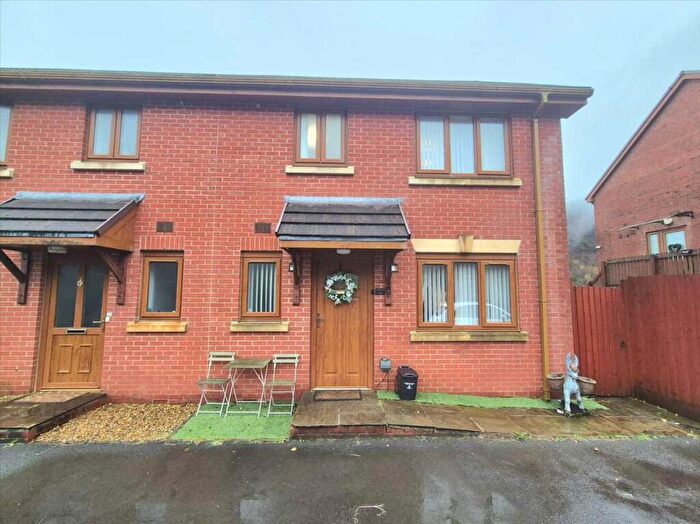
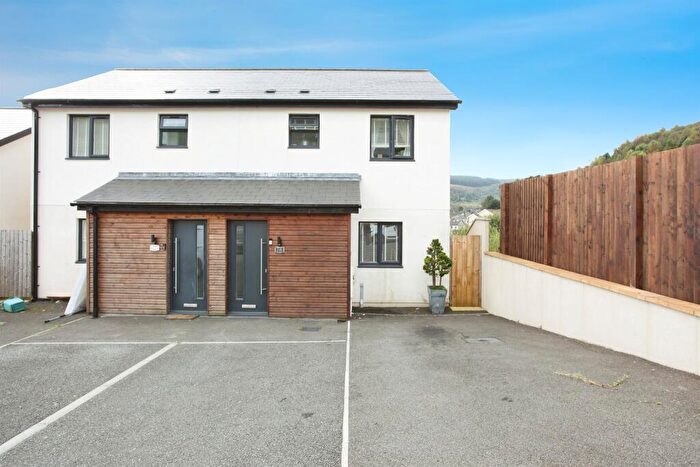
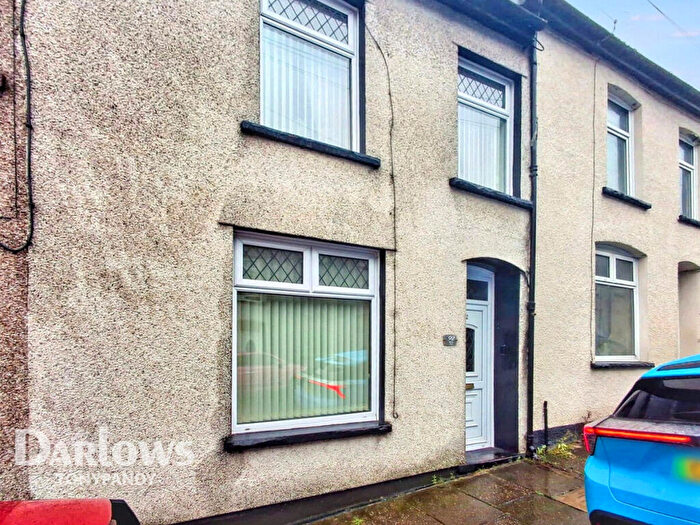
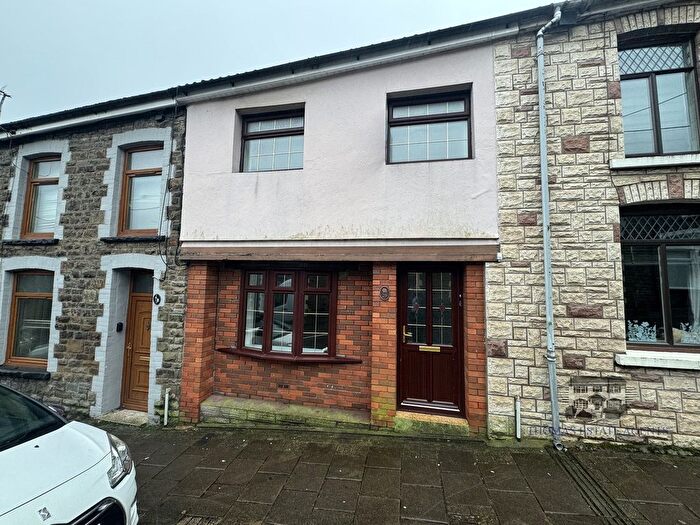
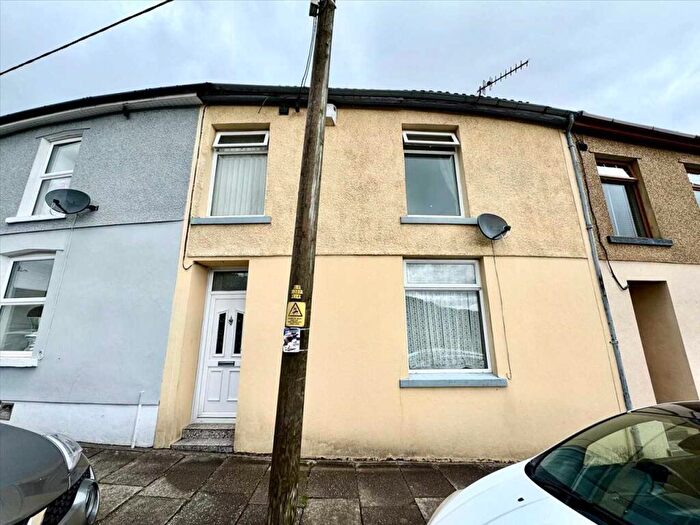
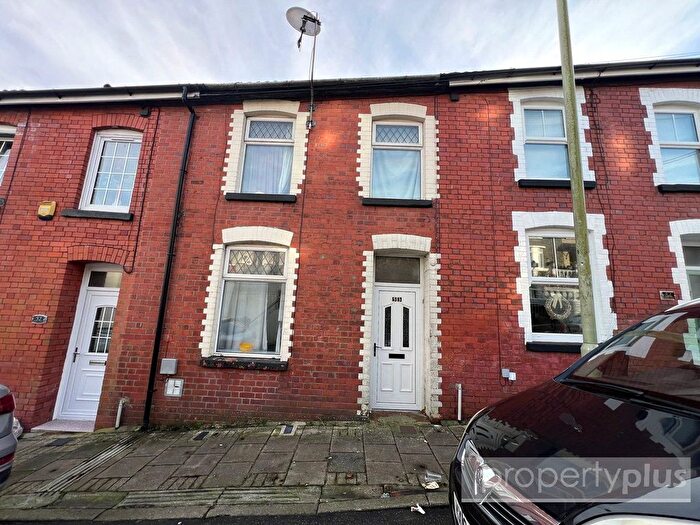
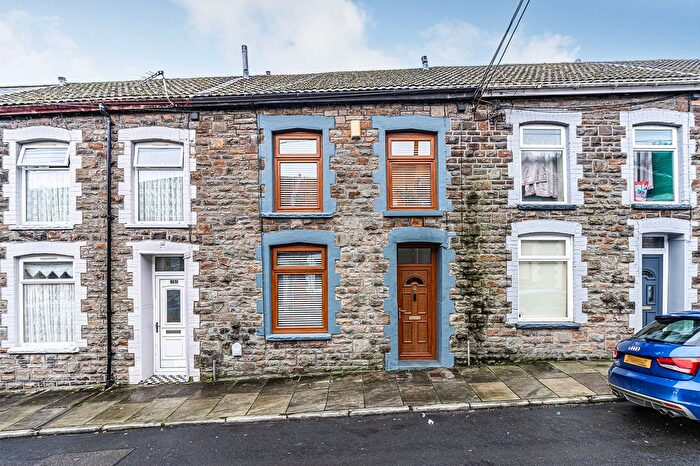
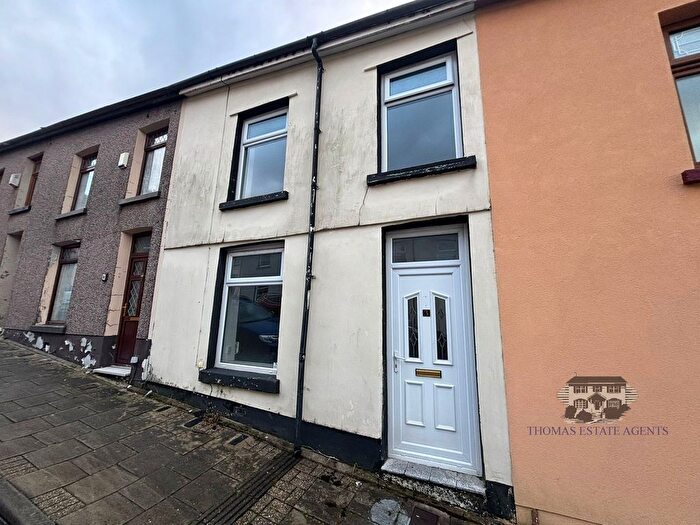
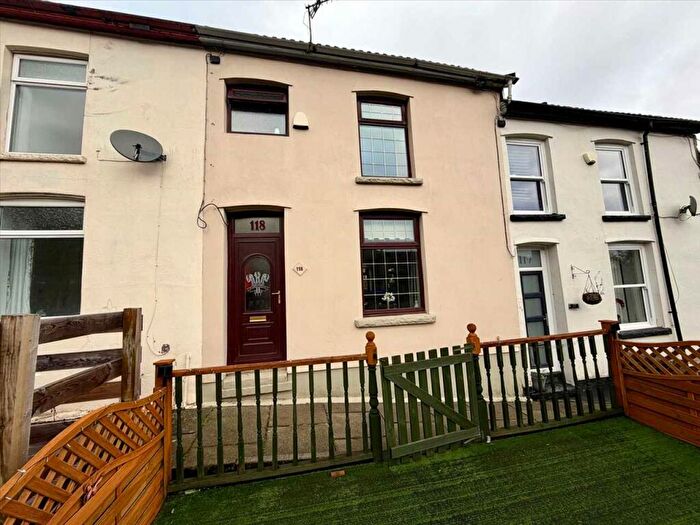
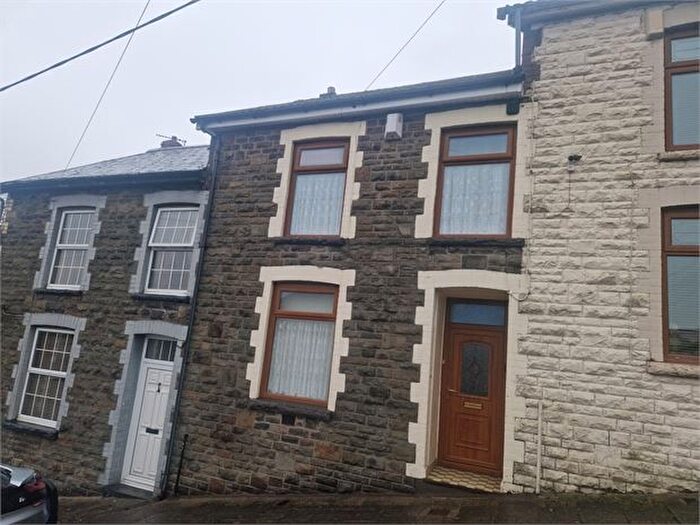
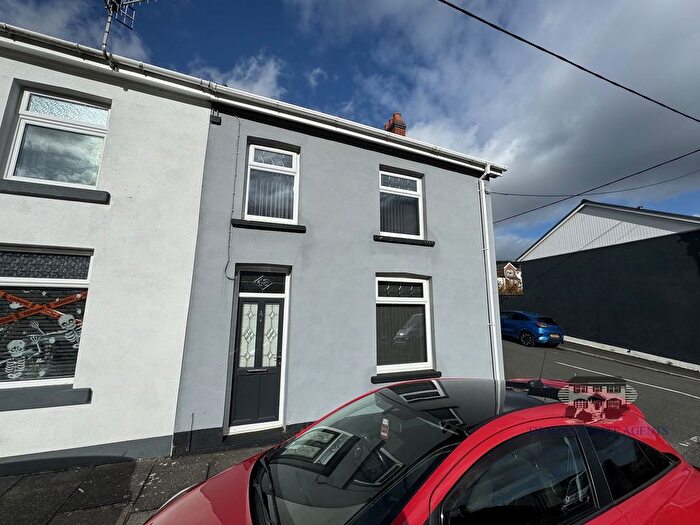
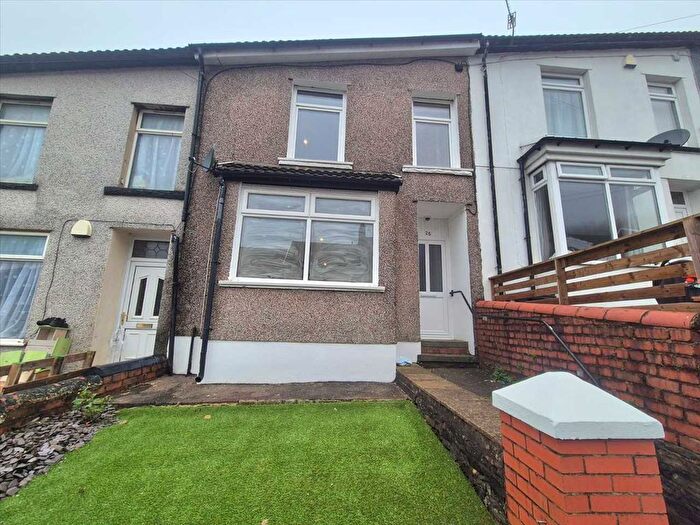
Houses for sale & to rent in Cwm Clydach, Tonypandy
House Prices in Cwm Clydach
Properties in Cwm Clydach have an average house price of £95,917.00 and had 223 Property Transactions within the last 3 years¹.
Cwm Clydach is an area in Tonypandy, Rhondda Cynon Taf - Rhondda Cynon Taf with 1,180 households², where the most expensive property was sold for £215,000.00.
Properties for sale in Cwm Clydach
Previously listed properties in Cwm Clydach
Roads and Postcodes in Cwm Clydach
Navigate through our locations to find the location of your next house in Cwm Clydach, Tonypandy for sale or to rent.
| Streets | Postcodes |
|---|---|
| Adams Street | CF40 2DU |
| Belle Vue | CF40 2DR |
| Bryn Terrace | CF40 2RY |
| Brynheulog Terrace | CF40 2BX |
| Brynhyfryd Street | CF40 2DY CF40 2DZ |
| Bryntawel Terrace | CF40 2EE |
| Cambrian Industrial Park | CF40 2XX CF40 2XY CF40 2ZA CF40 9YF CF40 9ZW CF40 9ZX CF40 9ZY |
| Cambrian View | CF40 2BG |
| Clydach Road | CF40 2BD CF40 2DG CF40 2DQ |
| Court Street | CF40 2RL CF40 2RN |
| Cross Street | CF40 2EA |
| East Street | CF40 2RU |
| Emlyn Terrace | CF40 2BL |
| Evans Terrace | CF40 2EB CF40 2ED |
| Francis Street | CF40 2DX |
| Glan Y Llyn | CF40 2BA |
| Glyn Terrace | CF40 2EG |
| High Street | CF40 2BH CF40 2BJ |
| Howard Street | CF40 2BP CF40 2BW |
| Jones Street | CF40 2BY CF40 2BZ |
| Maddox Street | CF40 2RR CF40 2RS |
| Marian Street | CF40 2DL CF40 2DN CF40 2DW |
| Morton Terrace | CF40 2DP |
| North Terrace | CF40 2RP CF40 2RW |
| Oak Street | CF40 2DT |
| Park Street | CF40 2BS CF40 2BT CF40 2BU |
| Pleasant Terrace | CF40 2DS |
| Railway Terrace | CF40 2DA |
| Sunny Bank | CF40 2RT |
| Taff Terrace | CF40 2BE |
| Wern Street | CF40 2BN CF40 2BQ CF40 2DH CF40 2DJ |
| CF39 9XF CF40 2RZ CF40 9AD CF40 9BL CF40 9BS CF40 9BT |
Transport near Cwm Clydach
-
Llwynypia Station
-
Tonypandy Station
-
Ystrad Rhondda Station
-
Ton Pentre Station
-
Dinas (Rhondda) Station
-
Treorchy Station
- FAQ
- Price Paid By Year
- Property Type Price
Frequently asked questions about Cwm Clydach
What is the average price for a property for sale in Cwm Clydach?
The average price for a property for sale in Cwm Clydach is £95,917. This amount is 17% lower than the average price in Tonypandy. There are 422 property listings for sale in Cwm Clydach.
What streets have the most expensive properties for sale in Cwm Clydach?
The streets with the most expensive properties for sale in Cwm Clydach are Cambrian View at an average of £195,497, Brynheulog Terrace at an average of £155,000 and Railway Terrace at an average of £150,650.
What streets have the most affordable properties for sale in Cwm Clydach?
The streets with the most affordable properties for sale in Cwm Clydach are Francis Street at an average of £65,200, North Terrace at an average of £70,000 and Oak Street at an average of £80,499.
Which train stations are available in or near Cwm Clydach?
Some of the train stations available in or near Cwm Clydach are Llwynypia, Tonypandy and Ystrad Rhondda.
Property Price Paid in Cwm Clydach by Year
The average sold property price by year was:
| Year | Average Sold Price | Price Change |
Sold Properties
|
|---|---|---|---|
| 2025 | £94,304 | -10% |
31 Properties |
| 2024 | £104,198 | 10% |
58 Properties |
| 2023 | £93,784 | 2% |
65 Properties |
| 2022 | £91,690 | 5% |
69 Properties |
| 2021 | £87,154 | 21% |
84 Properties |
| 2020 | £68,888 | -3% |
55 Properties |
| 2019 | £70,866 | 11% |
60 Properties |
| 2018 | £63,256 | 4% |
56 Properties |
| 2017 | £60,624 | 13% |
47 Properties |
| 2016 | £52,780 | -21% |
41 Properties |
| 2015 | £63,684 | 18% |
62 Properties |
| 2014 | £52,498 | 16% |
47 Properties |
| 2013 | £44,119 | -34% |
33 Properties |
| 2012 | £58,978 | -3% |
25 Properties |
| 2011 | £60,762 | 17% |
19 Properties |
| 2010 | £50,421 | -2% |
19 Properties |
| 2009 | £51,390 | -36% |
37 Properties |
| 2008 | £69,815 | -4% |
46 Properties |
| 2007 | £72,803 | 18% |
67 Properties |
| 2006 | £59,689 | 7% |
68 Properties |
| 2005 | £55,556 | 18% |
75 Properties |
| 2004 | £45,327 | 13% |
82 Properties |
| 2003 | £39,532 | 41% |
71 Properties |
| 2002 | £23,217 | -3% |
55 Properties |
| 2001 | £23,987 | 21% |
44 Properties |
| 2000 | £18,954 | -40% |
48 Properties |
| 1999 | £26,530 | 25% |
35 Properties |
| 1998 | £19,872 | -28% |
39 Properties |
| 1997 | £25,472 | -12% |
31 Properties |
| 1996 | £28,609 | 18% |
15 Properties |
| 1995 | £23,448 | - |
28 Properties |
Property Price per Property Type in Cwm Clydach
Here you can find historic sold price data in order to help with your property search.
The average Property Paid Price for specific property types in the last three years are:
| Property Type | Average Sold Price | Sold Properties |
|---|---|---|
| Semi Detached House | £162,111.00 | 13 Semi Detached Houses |
| Terraced House | £91,780.00 | 209 Terraced Houses |
| Detached House | £100,000.00 | 1 Detached House |

