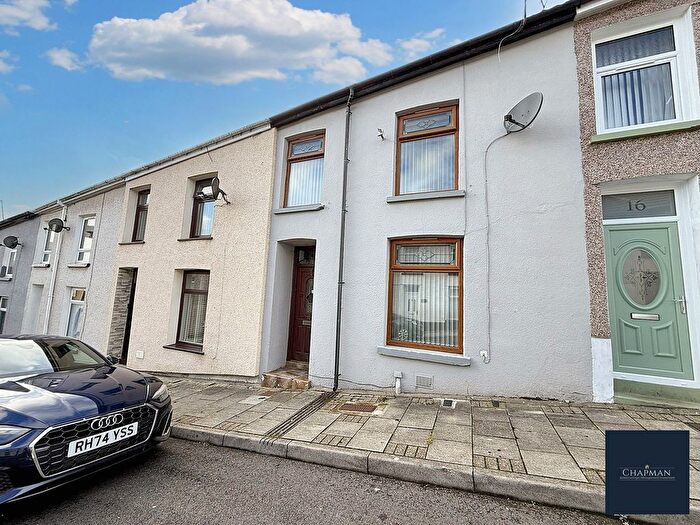
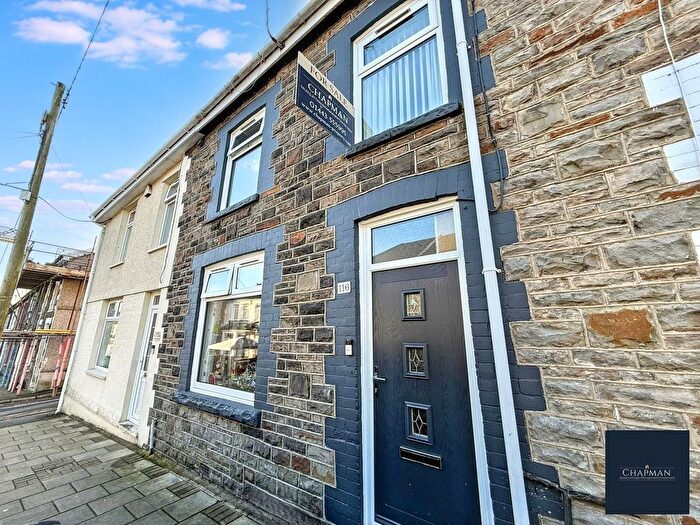
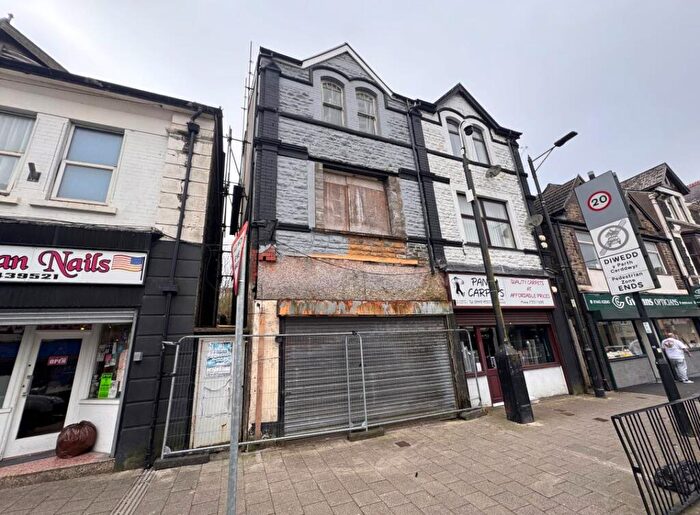
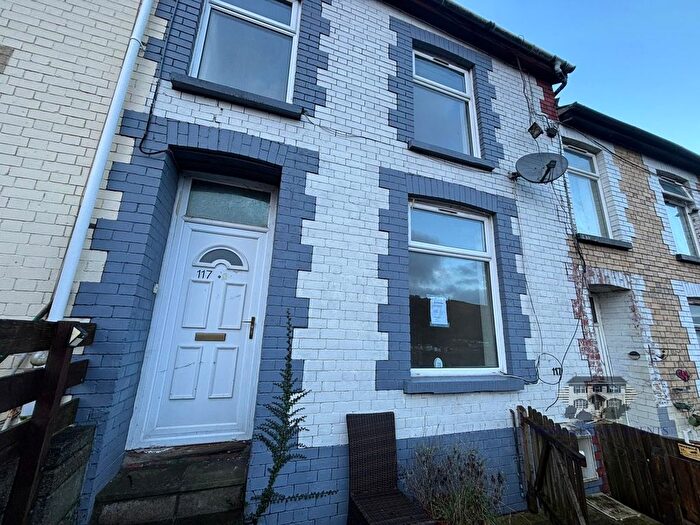
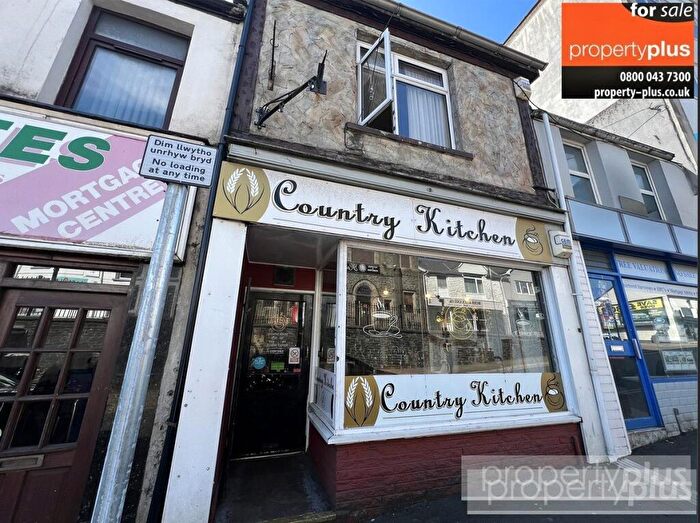
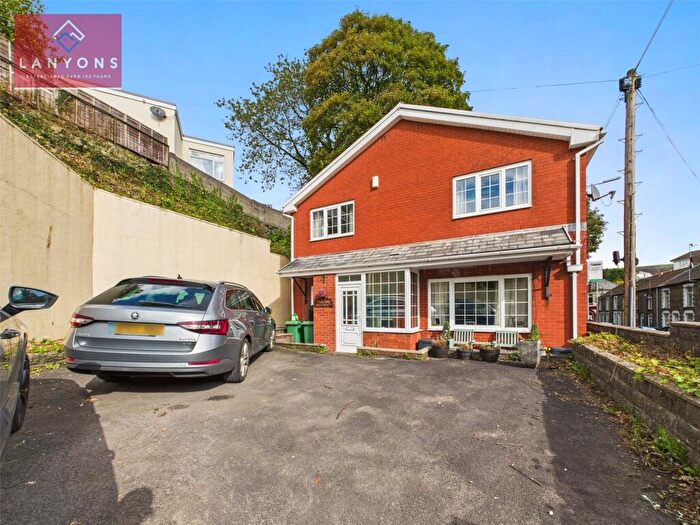
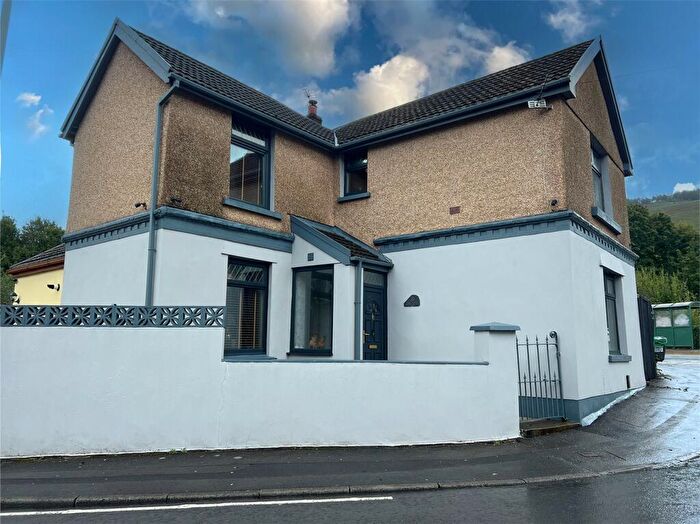
Houses for sale & to rent in Tonypandy, Tonypandy
House Prices in Tonypandy
Properties in Tonypandy have an average house price of £130,270.00 and had 206 Property Transactions within the last 3 years¹.
Tonypandy is an area in Tonypandy, Rhondda Cynon Taf - Rhondda Cynon Taf with 1,620 households², where the most expensive property was sold for £1,620,000.00.
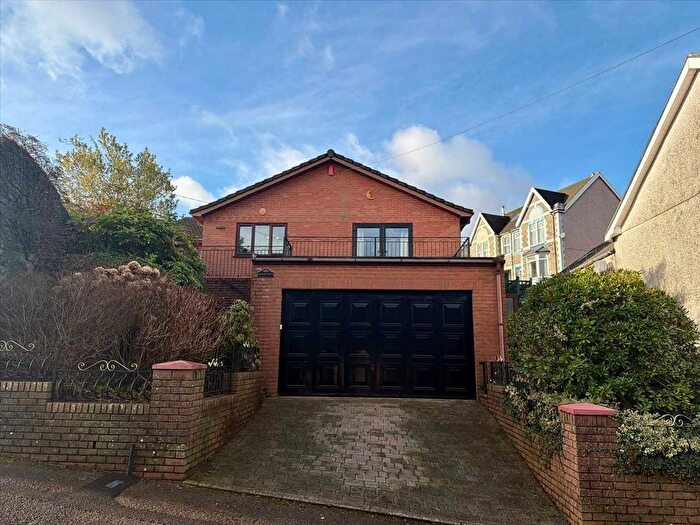
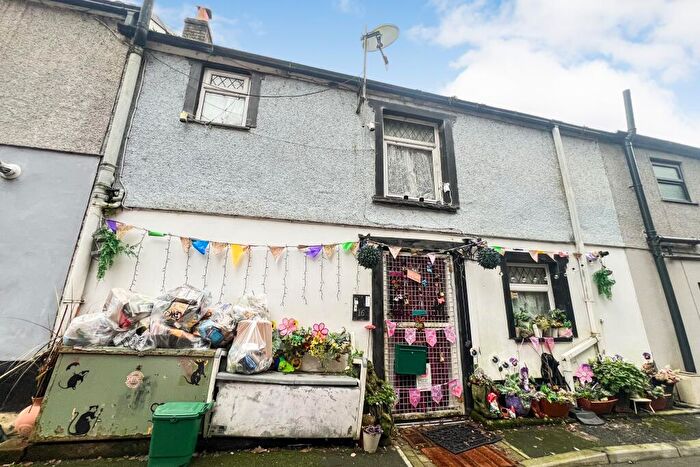
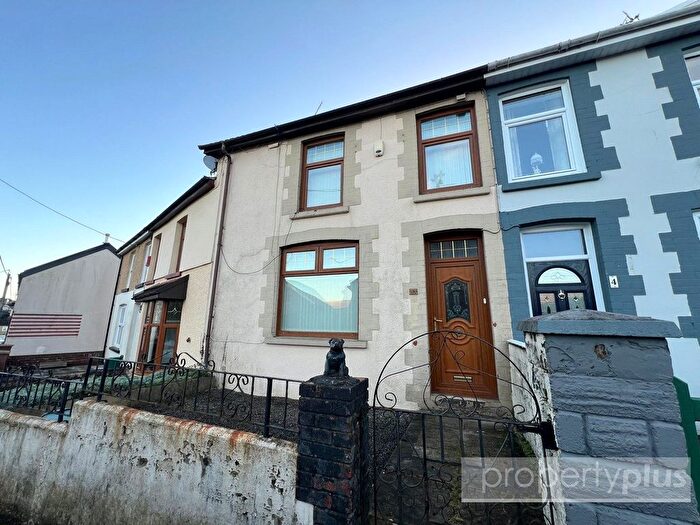
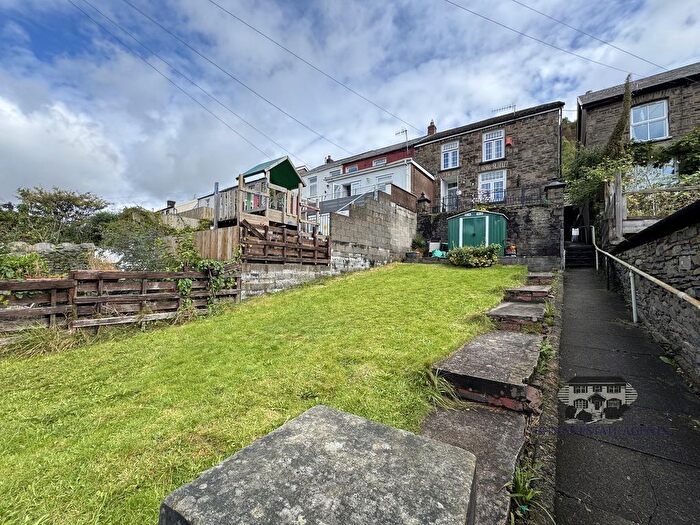
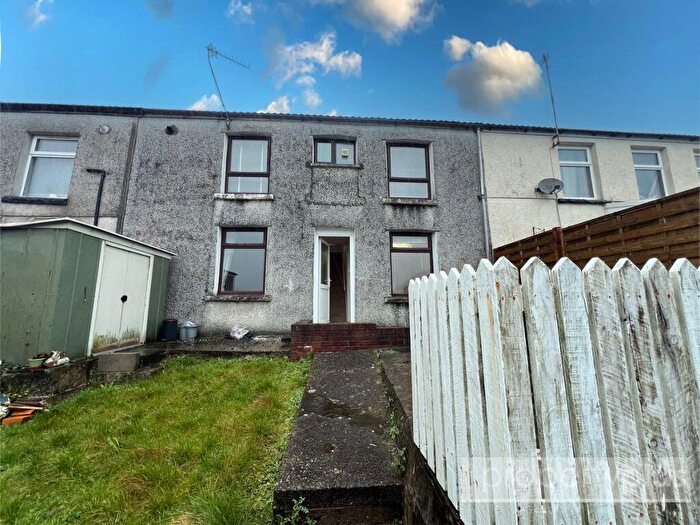
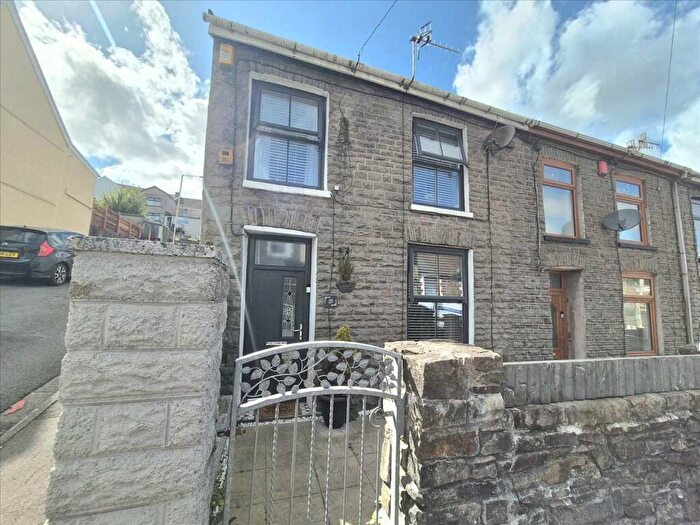
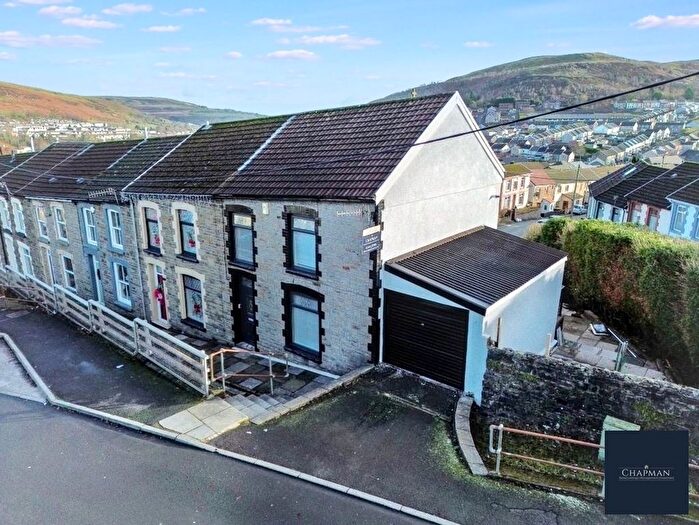
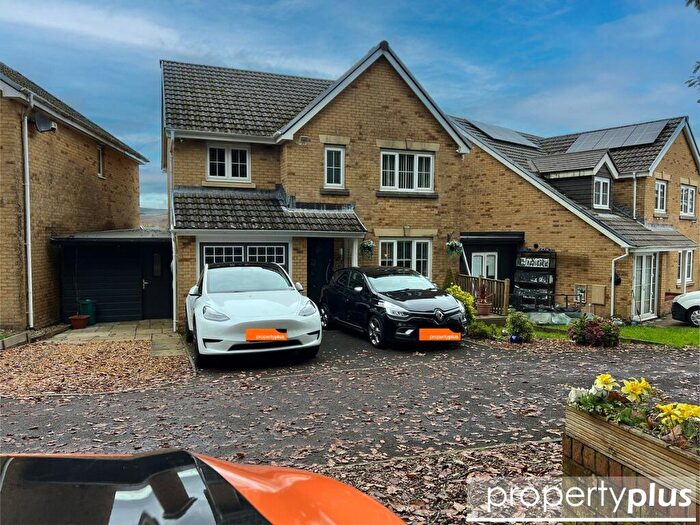
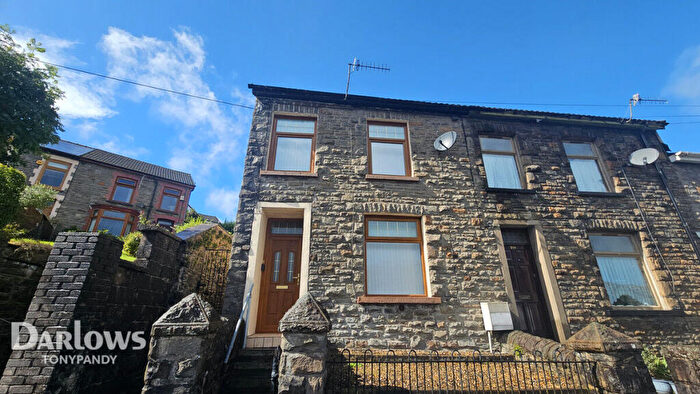
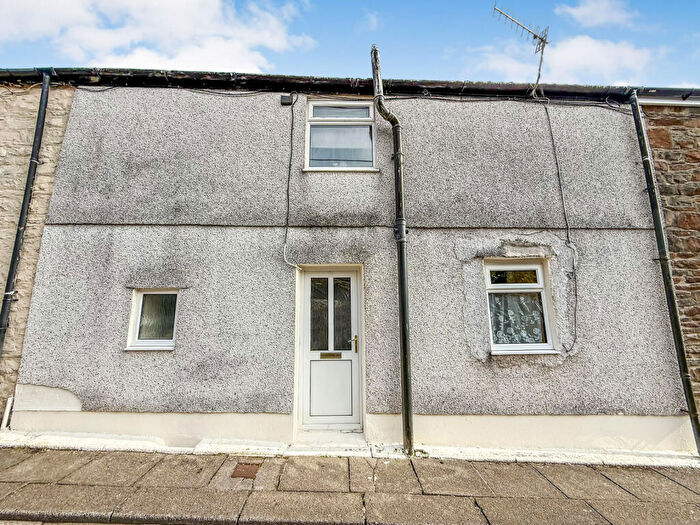
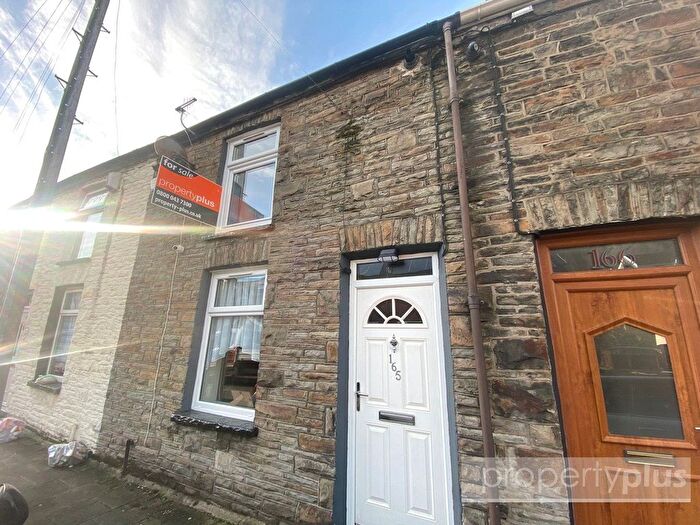
Properties for sale in Tonypandy
Roads and Postcodes in Tonypandy
Navigate through our locations to find the location of your next house in Tonypandy, Tonypandy for sale or to rent.
| Streets | Postcodes |
|---|---|
| Adare Terrace | CF40 1DJ |
| Anderson Terrace | CF40 2LF |
| Ardwyn Terrace | CF40 1BX |
| Berw Road | CF40 2AQ CF40 2HG CF40 2HH |
| Bridge Street | CF40 2TU |
| Brynamlwg | CF40 1BT |
| Brynhyfryd | CF40 1BS |
| Chapel Street | CF40 2RB |
| Charles Street | CF40 2AN CF40 2AP CF40 2AW |
| Clos Gellifaelog | CF40 1BH |
| Compton Road | CF40 1BE |
| Court Place | CF40 2RE |
| Court Street | CF40 2RF CF40 2RH CF40 2RJ CF40 2RQ |
| Cwrt Gellifaelog | CF40 1DX |
| Danycoed Terrace | CF40 2AS |
| Danygraig Terrace | CF40 2HQ |
| David Street | CF40 2AU |
| Davies Street | CF40 2RG |
| De Winton Field | CF40 2LE |
| De Winton Street | CF40 2QU CF40 2RA CF40 2QX CF40 2QZ |
| Dunraven Street | CF40 1AL CF40 1AS CF40 1QD CF40 1QE CF40 1AF CF40 1AJ CF40 1AN CF40 1AP CF40 1AR CF40 1AU CF40 1AW CF40 1QG |
| Ebenezer Road | CF40 1BB |
| Eleanor Street | CF40 1DL CF40 1DR CF40 1DW CF40 1AY CF40 1DP |
| Ely Street | CF40 1BY CF40 1BZ |
| Fern Terrace | CF40 2AL |
| Gelli Road | CF40 1DB |
| Georges Terrace | CF40 2AR |
| Gilfach Road | CF40 1BP CF40 1BU |
| Gilmour Street | CF40 2LA CF40 2LB |
| Glen View Street | CF40 2AX |
| Green Acre Drive | CF40 1DA |
| Holborn Terrace | CF40 1DH |
| Kenry Street | CF40 1DD CF40 1DE CF40 1DF CF40 1DG |
| Knoll Cottages | CF40 2AT |
| Knoll Terrace | CF40 2AY |
| Llwynypia Road | CF40 2EL CF40 2EW |
| Lower Dunraven Street | CF40 1AT |
| Mitchell Court | CF40 2RD |
| Old Street | CF40 2AF CF40 2AG |
| Parc Gellifaelog | CF40 1BF CF40 1DU |
| Park Place | CF40 1BA |
| Post Office Row | CF40 2QY |
| Primrose Street | CF40 1BG CF40 1BJ CF40 1BN CF40 1BQ CF40 1BW |
| Rear Dunraven Street | CF40 1DN CF40 1DT |
| Richards Terrace | CF40 2LD |
| River View | CF40 1QF |
| Thistle Terrace | CF40 2AD |
| Thomas Street | CF40 2AE CF40 2AH CF40 2AJ |
| Trinity Road | CF40 1DQ |
| Wern Road | CF40 1BL |
| Zion Terrace | CF40 2AB |
| CF40 2NJ |
Transport near Tonypandy
-
Tonypandy Station
-
Llwynypia Station
-
Dinas (Rhondda) Station
-
Ystrad Rhondda Station
-
Ton Pentre Station
-
Porth Station
- FAQ
- Price Paid By Year
- Property Type Price
Frequently asked questions about Tonypandy
What is the average price for a property for sale in Tonypandy?
The average price for a property for sale in Tonypandy is £130,270. This amount is 12% higher than the average price in Tonypandy. There are 867 property listings for sale in Tonypandy.
What streets have the most expensive properties for sale in Tonypandy?
The streets with the most expensive properties for sale in Tonypandy are Parc Gellifaelog at an average of £246,222, Green Acre Drive at an average of £233,333 and Berw Road at an average of £168,337.
What streets have the most affordable properties for sale in Tonypandy?
The streets with the most affordable properties for sale in Tonypandy are Dunraven Street at an average of £67,964, Zion Terrace at an average of £71,500 and Thistle Terrace at an average of £73,600.
Which train stations are available in or near Tonypandy?
Some of the train stations available in or near Tonypandy are Tonypandy, Llwynypia and Dinas (Rhondda).
Property Price Paid in Tonypandy by Year
The average sold property price by year was:
| Year | Average Sold Price | Price Change |
Sold Properties
|
|---|---|---|---|
| 2025 | £120,817 | - |
28 Properties |
| 2024 | £120,877 | 1% |
62 Properties |
| 2023 | £120,179 | -28% |
55 Properties |
| 2022 | £153,254 | 29% |
61 Properties |
| 2021 | £109,317 | 16% |
85 Properties |
| 2020 | £92,046 | -1% |
55 Properties |
| 2019 | £92,951 | 2% |
62 Properties |
| 2018 | £91,326 | 6% |
68 Properties |
| 2017 | £86,076 | 5% |
71 Properties |
| 2016 | £81,567 | -5% |
51 Properties |
| 2015 | £85,409 | 14% |
48 Properties |
| 2014 | £73,388 | 1% |
51 Properties |
| 2013 | £72,437 | -19% |
40 Properties |
| 2012 | £86,132 | -14% |
34 Properties |
| 2011 | £98,394 | 5% |
52 Properties |
| 2010 | £93,182 | -7% |
46 Properties |
| 2009 | £99,720 | -13% |
45 Properties |
| 2008 | £112,901 | 7% |
61 Properties |
| 2007 | £105,293 | -19% |
82 Properties |
| 2006 | £125,252 | 36% |
78 Properties |
| 2005 | £79,715 | 24% |
54 Properties |
| 2004 | £60,506 | 29% |
62 Properties |
| 2003 | £42,777 | 15% |
81 Properties |
| 2002 | £36,479 | -3% |
81 Properties |
| 2001 | £37,421 | 20% |
64 Properties |
| 2000 | £29,816 | -6% |
67 Properties |
| 1999 | £31,543 | 8% |
50 Properties |
| 1998 | £29,114 | 12% |
52 Properties |
| 1997 | £25,634 | 5% |
47 Properties |
| 1996 | £24,252 | -20% |
34 Properties |
| 1995 | £29,106 | - |
42 Properties |
Property Price per Property Type in Tonypandy
Here you can find historic sold price data in order to help with your property search.
The average Property Paid Price for specific property types in the last three years are:
| Property Type | Average Sold Price | Sold Properties |
|---|---|---|
| Semi Detached House | £135,855.00 | 18 Semi Detached Houses |
| Detached House | £269,772.00 | 11 Detached Houses |
| Terraced House | £122,910.00 | 171 Terraced Houses |
| Flat | £67,500.00 | 6 Flats |

