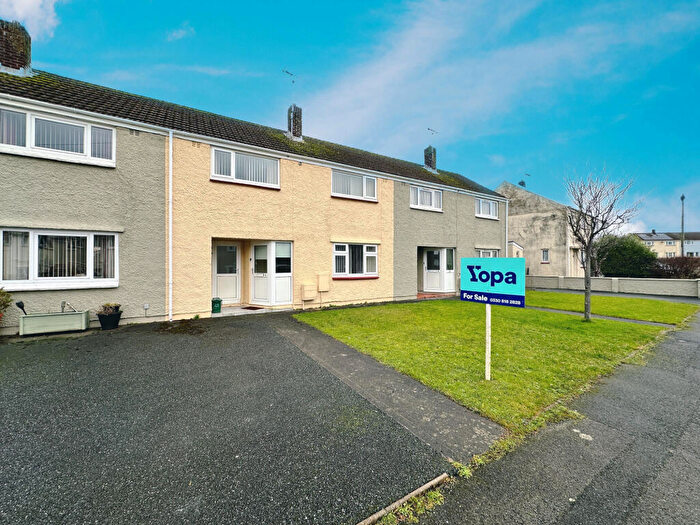
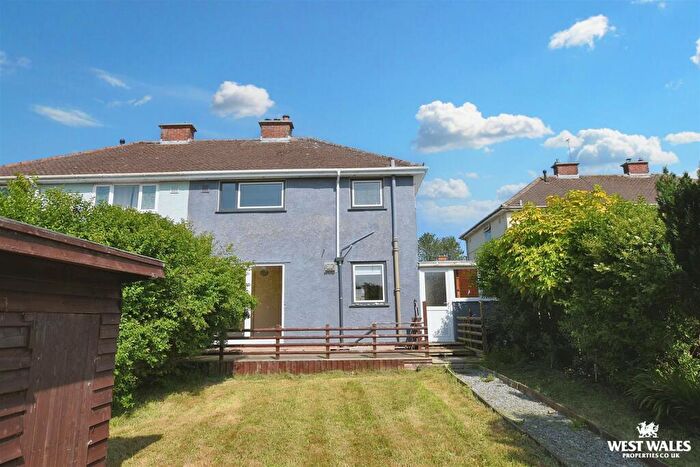
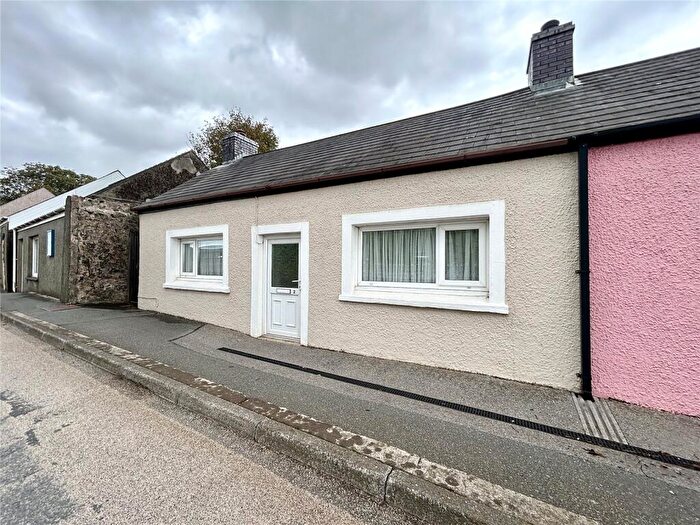
Houses for sale & to rent in Johnston, Haverfordwest
House Prices in Johnston
Properties in Johnston have an average house price of £210,805.00 and had 91 Property Transactions within the last 3 years¹.
Johnston is an area in Haverfordwest, Sir Benfro - Pembrokeshire with 920 households², where the most expensive property was sold for £585,000.00.
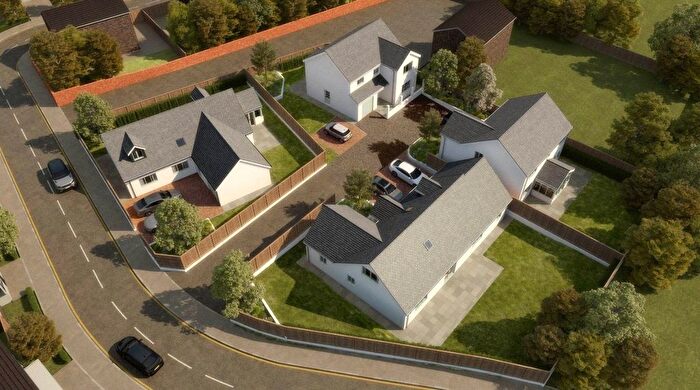
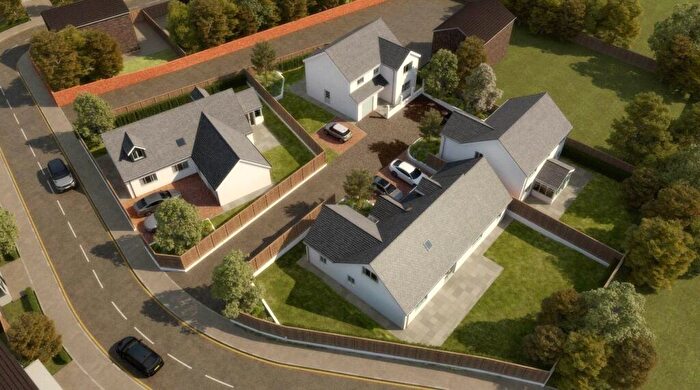
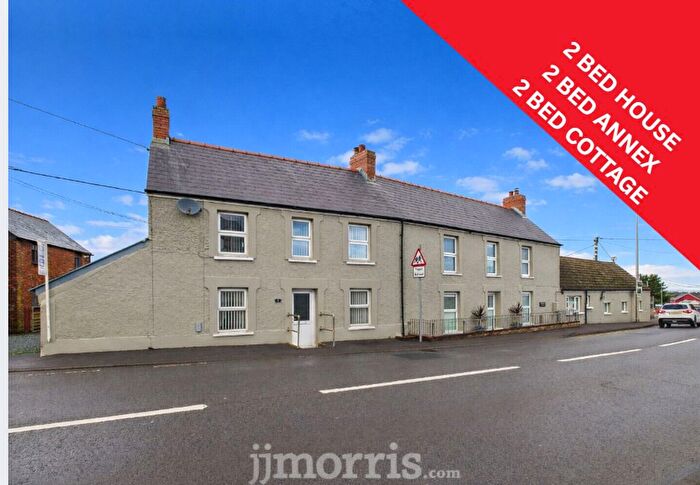
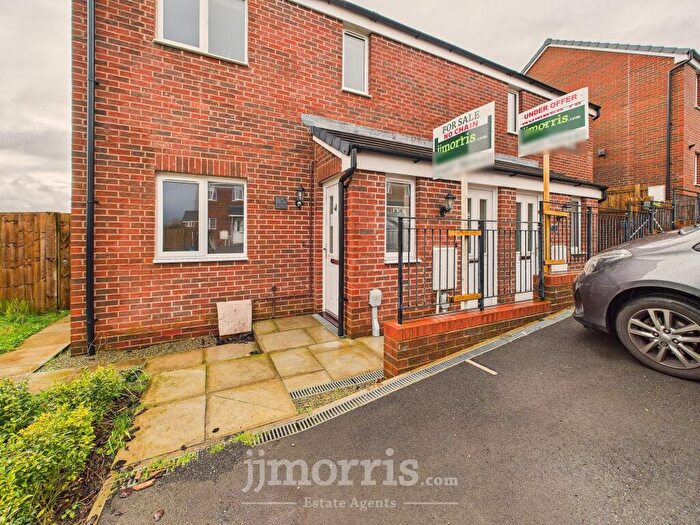
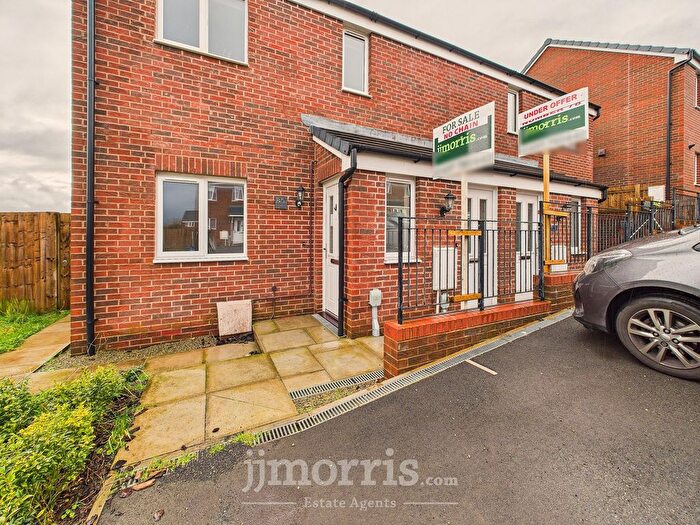
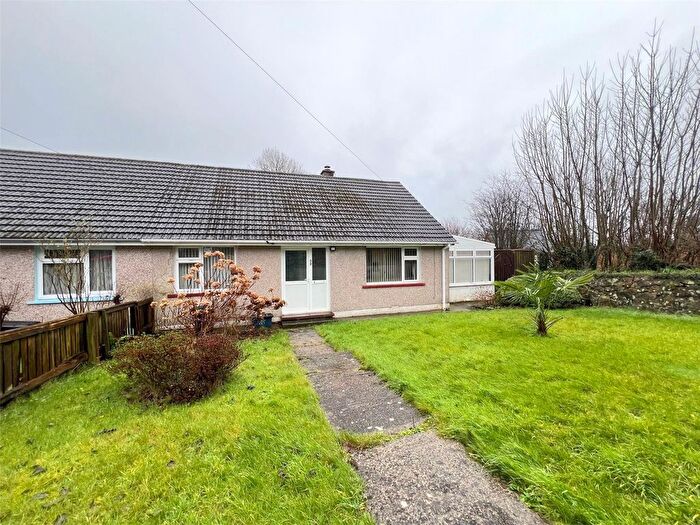
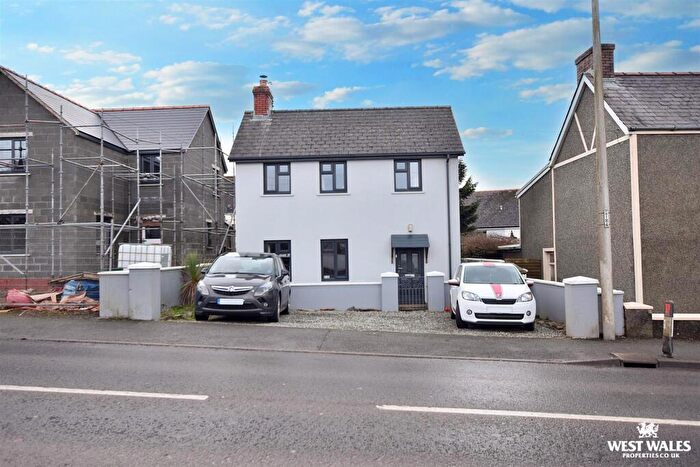
Properties for sale in Johnston
Roads and Postcodes in Johnston
Navigate through our locations to find the location of your next house in Johnston, Haverfordwest for sale or to rent.
| Streets | Postcodes |
|---|---|
| Acorn Drive | SA62 3QJ |
| Bracken Way | SA62 3QT |
| Brickhurst Business Park | SA62 3BP |
| Brickhurst Close | SA62 3PH |
| Brickhurst Park | SA62 3PA |
| Brookside Avenue | SA62 3PQ |
| Brookside Close | SA62 3EJ |
| Bulford Close | SA62 3EX |
| Bulford Road | SA62 3ET SA62 3EU |
| Cadogan Close | SA62 3QN |
| Chestnut Tree Drive | SA62 3QF |
| Church Road | SA62 3HE |
| Cranham Park | SA62 3PU |
| Dale Road | SA62 3AB SA62 3XG |
| Deer Park | SA62 3DG |
| Deer Park Close | SA62 3DW |
| Denant Hill | SA62 3AD SA62 3EN |
| Dreenhill | SA62 3TS SA62 3AA SA62 3XH |
| Fair View | SA62 3QD |
| Florence Mews | SA62 3HD |
| Glebelands | SA62 3PN SA62 3PW |
| Green Lane | SA62 3QH |
| Greenhall Park | SA62 3PT |
| Hall Court | SA62 3LJ |
| Hayston Road | SA62 3HH |
| Hayston View | SA62 3AQ |
| Heath Close | SA62 3QL |
| Hillcroft | SA62 3QA SA62 3QB |
| Kiln Road | SA62 3PE SA62 3PF |
| Langford Road | SA62 3PS SA62 3PX SA62 3PY |
| Maes Yr Ysgol | SA62 3QW |
| Milford Road | SA62 3EY SA62 3HL |
| Moors Road | SA62 3QE |
| Old Hakin Road | SA62 3EP SA62 3BU SA62 3EL SA62 3EW |
| Orchard Court | SA62 3PZ |
| Park View | SA62 3BW |
| Popehill | SA62 3NX |
| Portfield Gate | SA62 3LT |
| Priory Cottages | SA62 3DE |
| Redstock Lane | SA62 3NQ |
| Silverdale Close | SA62 3NU |
| St Peters Road | SA62 3PJ SA62 3PP SA62 3PR SA62 3HB |
| Station Road | SA62 3PL |
| Tall Trees Close | SA62 3HQ |
| The Close | SA62 3QG SA62 3QQ |
| The Crescent | SA62 3HA |
| Tiers Cross | SA62 3BZ SA62 3DA SA62 3DB SA62 3DD SA62 3DH SA62 3BX SA62 3ER SA62 3ES |
| Tudor Place | SA62 3BY |
| Victoria Gardens | SA62 3NF |
| Vine Road | SA62 3NY SA62 3NZ |
| Woodlands View | SA62 3HF |
| SA62 3HN SA62 3PD SA62 3PB |
Transport near Johnston
- FAQ
- Price Paid By Year
- Property Type Price
Frequently asked questions about Johnston
What is the average price for a property for sale in Johnston?
The average price for a property for sale in Johnston is £210,805. This amount is 16% lower than the average price in Haverfordwest. There are 1,022 property listings for sale in Johnston.
What streets have the most expensive properties for sale in Johnston?
The streets with the most expensive properties for sale in Johnston are Denant Hill at an average of £465,000, Deer Park Close at an average of £400,000 and Park View at an average of £377,666.
What streets have the most affordable properties for sale in Johnston?
The streets with the most affordable properties for sale in Johnston are Brookside Avenue at an average of £151,437, Heath Close at an average of £156,500 and Glebelands at an average of £157,000.
Which train stations are available in or near Johnston?
Some of the train stations available in or near Johnston are Johnston (Dyfed), Milford Haven and Haverfordwest.
Property Price Paid in Johnston by Year
The average sold property price by year was:
| Year | Average Sold Price | Price Change |
Sold Properties
|
|---|---|---|---|
| 2025 | £194,496 | -19% |
29 Properties |
| 2024 | £231,234 | 14% |
38 Properties |
| 2023 | £198,166 | -16% |
24 Properties |
| 2022 | £229,934 | 26% |
37 Properties |
| 2021 | £169,802 | -2% |
54 Properties |
| 2020 | £173,431 | 16% |
40 Properties |
| 2019 | £145,843 | -6% |
37 Properties |
| 2018 | £154,559 | 6% |
41 Properties |
| 2017 | £145,964 | 5% |
28 Properties |
| 2016 | £139,099 | 2% |
45 Properties |
| 2015 | £135,811 | 12% |
48 Properties |
| 2014 | £119,046 | 2% |
34 Properties |
| 2013 | £117,193 | -13% |
33 Properties |
| 2012 | £132,233 | -2% |
27 Properties |
| 2011 | £134,792 | -20% |
34 Properties |
| 2010 | £162,176 | 11% |
17 Properties |
| 2009 | £144,375 | -22% |
28 Properties |
| 2008 | £175,634 | 6% |
22 Properties |
| 2007 | £164,396 | 9% |
27 Properties |
| 2006 | £149,058 | -5% |
34 Properties |
| 2005 | £155,845 | 15% |
33 Properties |
| 2004 | £131,941 | 36% |
31 Properties |
| 2003 | £83,813 | 28% |
37 Properties |
| 2002 | £60,082 | -1% |
38 Properties |
| 2001 | £60,446 | -4% |
30 Properties |
| 2000 | £62,798 | 27% |
39 Properties |
| 1999 | £45,753 | -8% |
32 Properties |
| 1998 | £49,336 | -2% |
23 Properties |
| 1997 | £50,327 | -3% |
22 Properties |
| 1996 | £51,671 | 23% |
16 Properties |
| 1995 | £40,000 | - |
22 Properties |
Property Price per Property Type in Johnston
Here you can find historic sold price data in order to help with your property search.
The average Property Paid Price for specific property types in the last three years are:
| Property Type | Average Sold Price | Sold Properties |
|---|---|---|
| Semi Detached House | £183,653.00 | 26 Semi Detached Houses |
| Detached House | £296,596.00 | 26 Detached Houses |
| Terraced House | £175,193.00 | 36 Terraced Houses |
| Flat | £129,950.00 | 3 Flats |

