Houses for sale & to rent in Milford: North, Milford Haven
House Prices in Milford: North
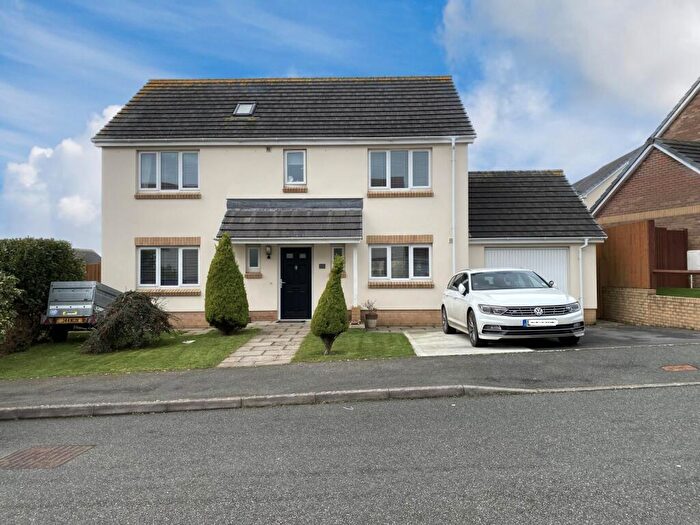
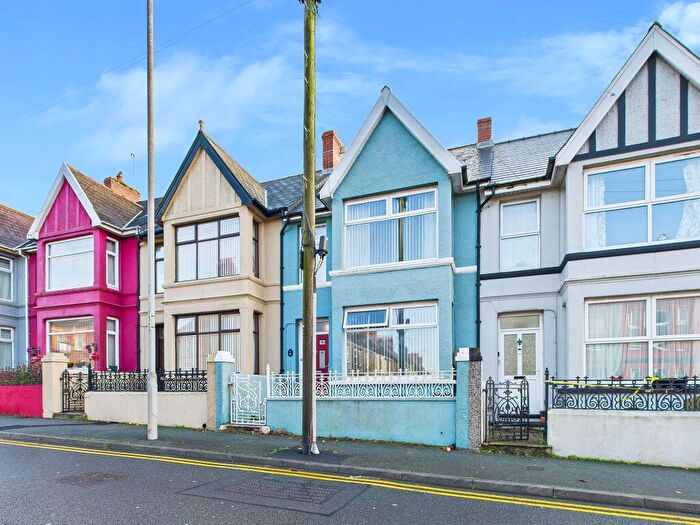
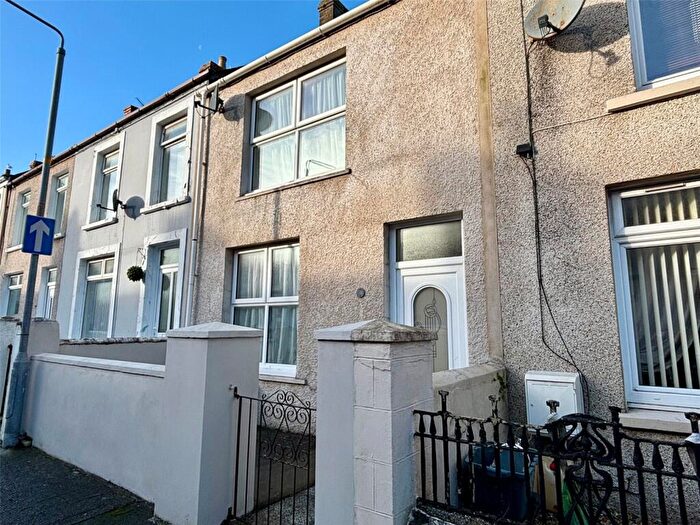
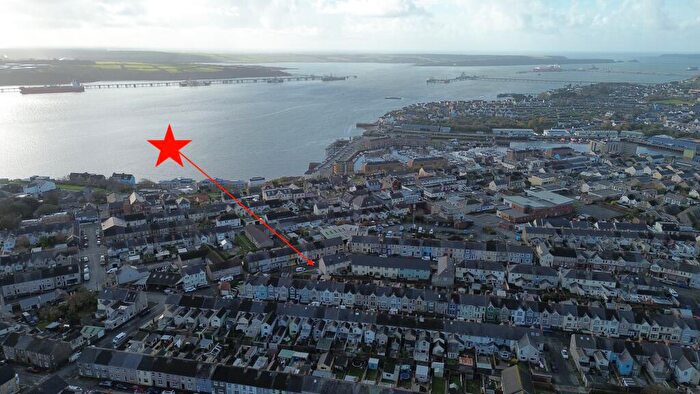
Properties in Milford: North have an average house price of £223,937.00 and had 87 Property Transactions within the last 3 years¹.
Milford: North is an area in Milford Haven, Sir Benfro - Pembrokeshire with 1,162 households², where the most expensive property was sold for £450,000.00.
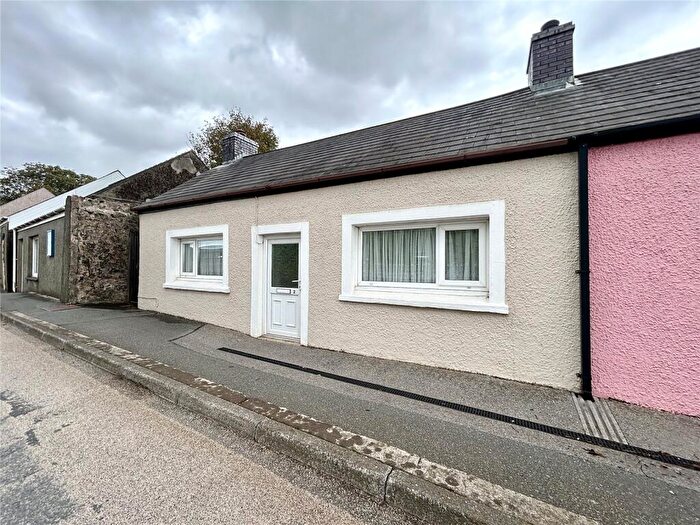
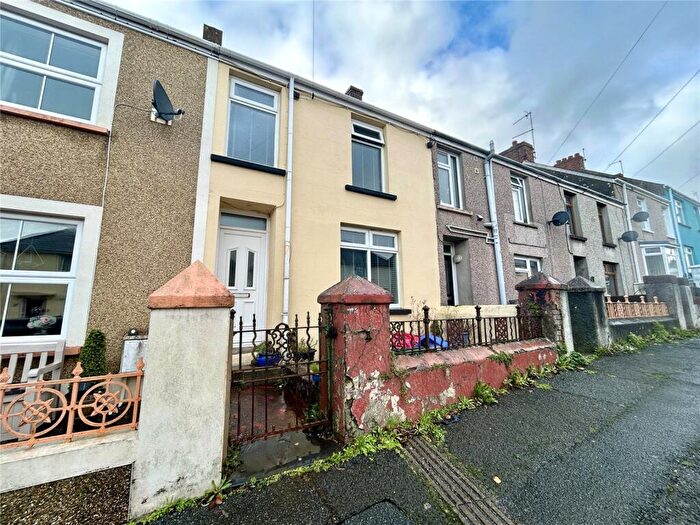
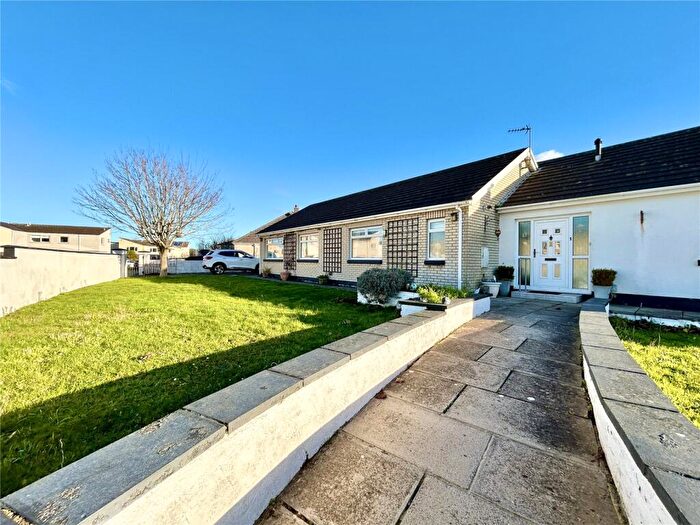
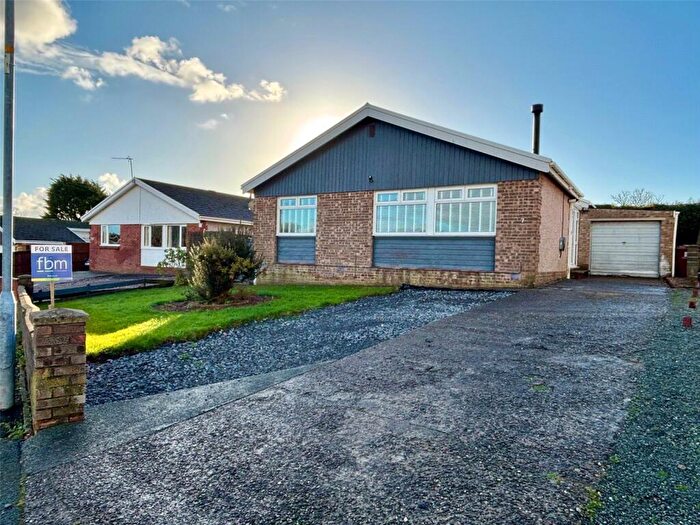
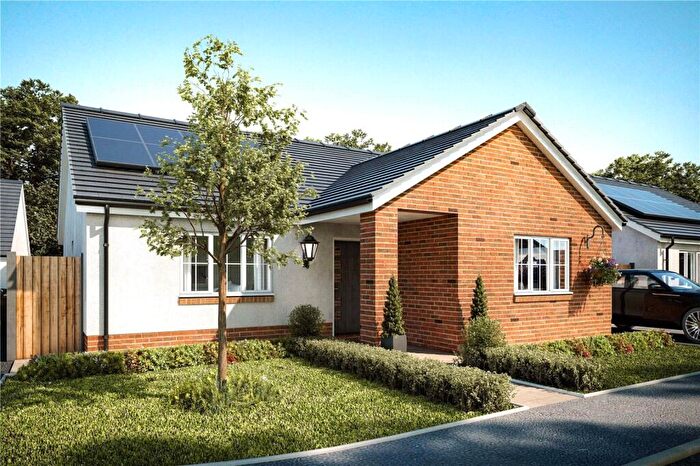
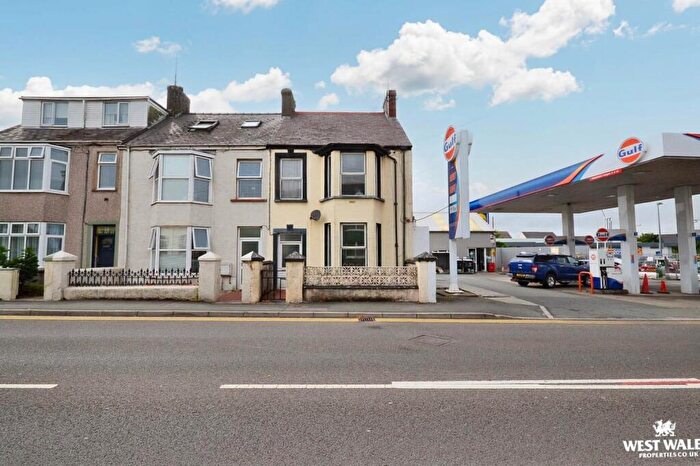
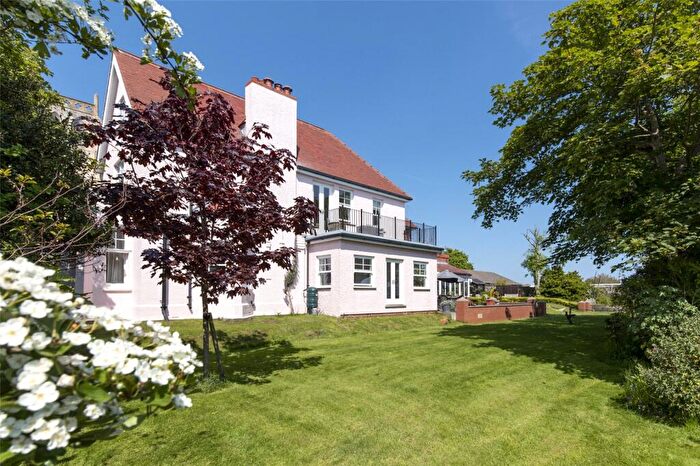
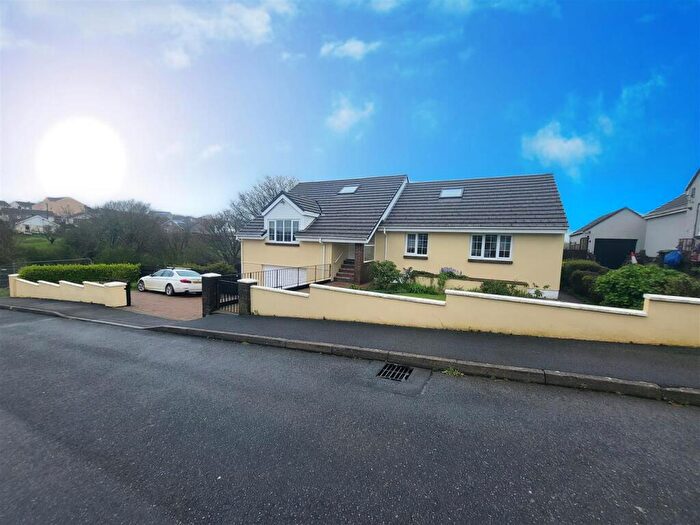
Properties for sale in Milford: North
Roads and Postcodes in Milford: North
Navigate through our locations to find the location of your next house in Milford: North, Milford Haven for sale or to rent.
| Streets | Postcodes |
|---|---|
| Ardent Close | SA73 1AU |
| Beaconing Drive | SA73 1HF |
| Brook Close | SA73 1JN |
| Brooke Avenue | SA73 2LR SA73 2LS |
| Caldy Way | SA73 2RG |
| Castle Pill Crescent | SA73 1HD |
| Castle Pill Road | SA73 1HE |
| Castle Terrace | SA73 2NE |
| Celtic Business Park | SA73 2RU |
| Central Court | SA73 2LW |
| Conway Drive | SA73 1JA |
| Cromwell Heights | SA73 2PJ SA73 2PS |
| Cutty Sark Drive | SA73 1AF |
| Derwent Avenue | SA73 1HZ |
| Exeter Road | SA73 1DW |
| Gateholm Avenue | SA73 2RL |
| Grassholme Close | SA73 2RH |
| Great North Road | SA73 2LN SA73 2LU SA73 2NA SA73 2ND |
| Green Close | SA73 1AR |
| Greville Road | SA73 2LT |
| Jordans Close | SA73 1HG |
| Linney Way | SA73 2RN |
| Lundy Close | SA73 2RJ |
| Marble Hall Road | SA73 2PP |
| Mariners Way | SA73 1AZ |
| Meyler Crescent | SA73 2PF SA73 2PH |
| Monnow Close | SA73 1JB |
| Neyland Road | SA73 1HH SA73 1HY |
| Oberon Grove | SA73 1AY |
| Phillips Avenue | SA73 2RB |
| Plas Peregrine | SA73 2SA |
| Pond Meadow | SA73 1HB |
| Priory Park | SA73 2DA |
| Ramsey Drive | SA73 2RQ |
| Richard John Road | SA73 2PG SA73 2PL SA73 2PQ |
| Roebuck Close | SA73 1AS |
| Sheffield Drive | SA73 1AX |
| Skomer Drive | SA73 2RF SA73 2RP |
| St Brides Way | SA73 2RW |
| St Peters Way | SA73 1HT |
| Steynton Road | SA73 1AD SA73 1AH SA73 1AJ SA73 1AL SA73 1AN SA73 1BA SA73 1BH SA73 1BL SA73 1AE |
| Stone Court | SA73 2PX |
| Stryd Shearwater | SA73 2SB |
| Thornton Industrial Estate | SA73 2RR SA73 2RY |
| Thornton Industrial Trading Estate | SA73 2DE SA73 2RT SA73 2RX SA73 2RZ |
| Thornton Road | SA73 2RA SA73 2RS |
| Tollgate Court | SA73 1AT |
| Union Way | SA73 1HQ |
| Vaynor Road | SA73 2NB |
| Warrior Way | SA73 1DZ SA73 1GB |
| Westfield Close | SA73 2SD SA73 2SH |
| Westhill Avenue | SA73 2RD SA73 2RE |
| SA73 1AW SA73 1AP SA73 1HA SA73 2LQ SA73 2SE |
Transport near Milford: North
- FAQ
- Price Paid By Year
- Property Type Price
Frequently asked questions about Milford: North
What is the average price for a property for sale in Milford: North?
The average price for a property for sale in Milford: North is £223,937. This amount is 18% higher than the average price in Milford Haven. There are 485 property listings for sale in Milford: North.
What streets have the most expensive properties for sale in Milford: North?
The streets with the most expensive properties for sale in Milford: North are Sheffield Drive at an average of £390,000, Westhill Avenue at an average of £293,333 and Gateholm Avenue at an average of £270,399.
What streets have the most affordable properties for sale in Milford: North?
The streets with the most affordable properties for sale in Milford: North are Greville Road at an average of £114,416, Brooke Avenue at an average of £117,833 and Monnow Close at an average of £127,375.
Which train stations are available in or near Milford: North?
Some of the train stations available in or near Milford: North are Milford Haven, Johnston (Dyfed) and Pembroke Dock.
Property Price Paid in Milford: North by Year
The average sold property price by year was:
| Year | Average Sold Price | Price Change |
Sold Properties
|
|---|---|---|---|
| 2025 | £207,797 | -20% |
21 Properties |
| 2024 | £250,043 | 17% |
33 Properties |
| 2023 | £208,103 | 1% |
33 Properties |
| 2022 | £206,246 | -1% |
52 Properties |
| 2021 | £207,405 | 21% |
49 Properties |
| 2020 | £164,803 | 0,4% |
35 Properties |
| 2019 | £164,185 | 1% |
56 Properties |
| 2018 | £161,848 | 7% |
47 Properties |
| 2017 | £150,897 | 3% |
35 Properties |
| 2016 | £147,093 | -13% |
33 Properties |
| 2015 | £165,735 | 17% |
48 Properties |
| 2014 | £138,384 | -6% |
35 Properties |
| 2013 | £146,966 | -20% |
39 Properties |
| 2012 | £176,485 | 24% |
34 Properties |
| 2011 | £133,250 | -21% |
22 Properties |
| 2010 | £160,717 | 10% |
32 Properties |
| 2009 | £144,095 | -10% |
24 Properties |
| 2008 | £159,028 | -1% |
26 Properties |
| 2007 | £160,596 | 10% |
75 Properties |
| 2006 | £144,830 | -2% |
75 Properties |
| 2005 | £147,534 | 7% |
42 Properties |
| 2004 | £137,526 | 24% |
38 Properties |
| 2003 | £104,746 | 25% |
46 Properties |
| 2002 | £78,475 | 21% |
43 Properties |
| 2001 | £61,670 | 19% |
47 Properties |
| 2000 | £49,697 | -10% |
41 Properties |
| 1999 | £54,627 | -4% |
35 Properties |
| 1998 | £56,565 | 6% |
33 Properties |
| 1997 | £53,410 | 10% |
23 Properties |
| 1996 | £48,023 | 0,4% |
20 Properties |
| 1995 | £47,810 | - |
27 Properties |
Property Price per Property Type in Milford: North
Here you can find historic sold price data in order to help with your property search.
The average Property Paid Price for specific property types in the last three years are:
| Property Type | Average Sold Price | Sold Properties |
|---|---|---|
| Semi Detached House | £177,497.00 | 20 Semi Detached Houses |
| Detached House | £276,712.00 | 49 Detached Houses |
| Terraced House | £131,875.00 | 18 Terraced Houses |

