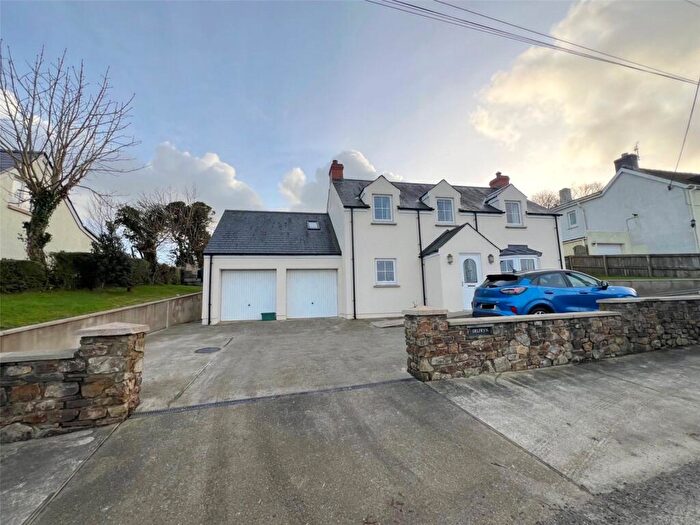
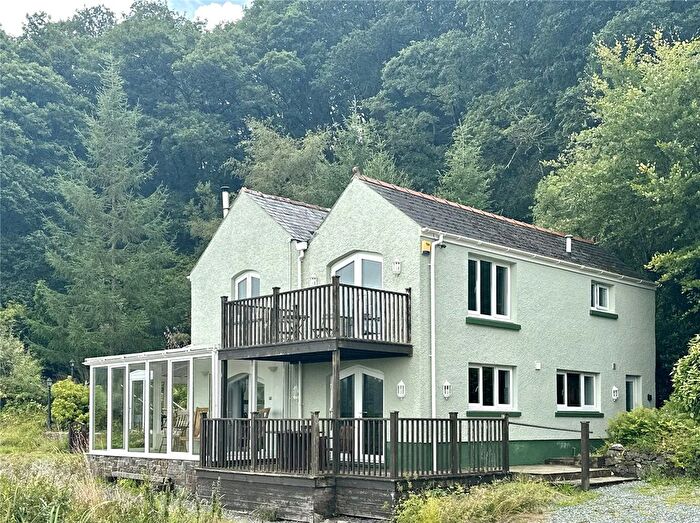
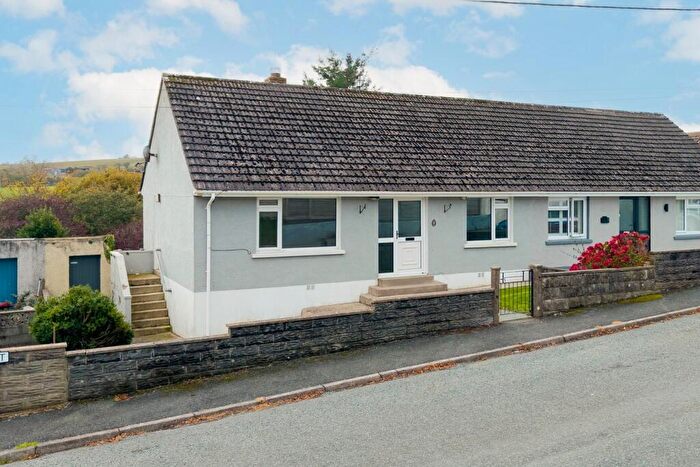
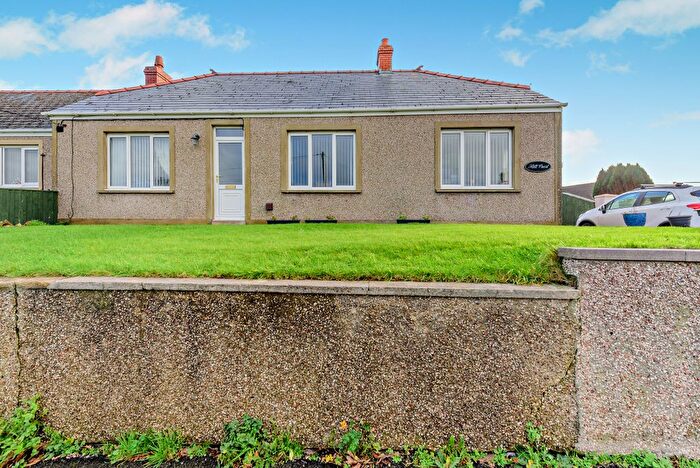
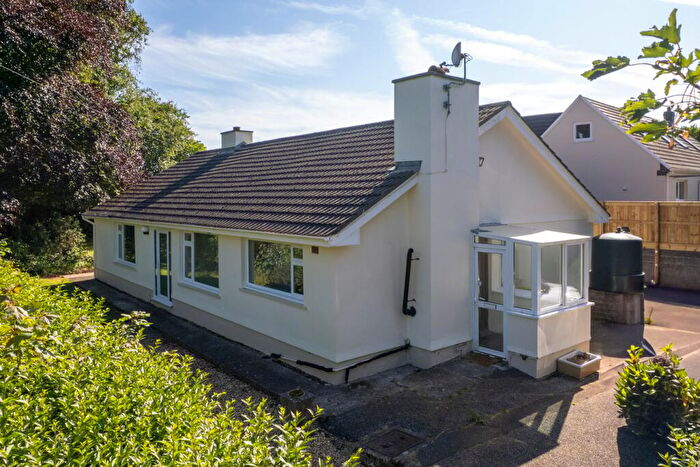
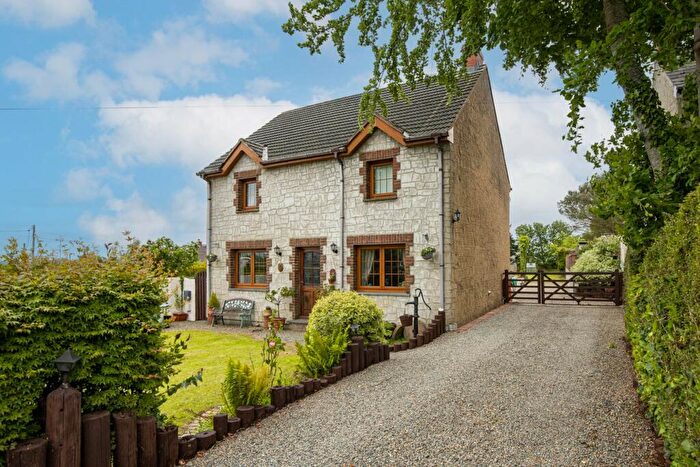
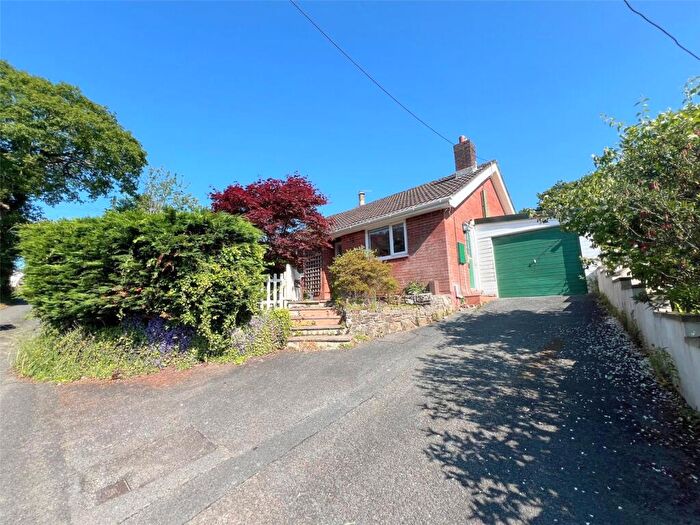
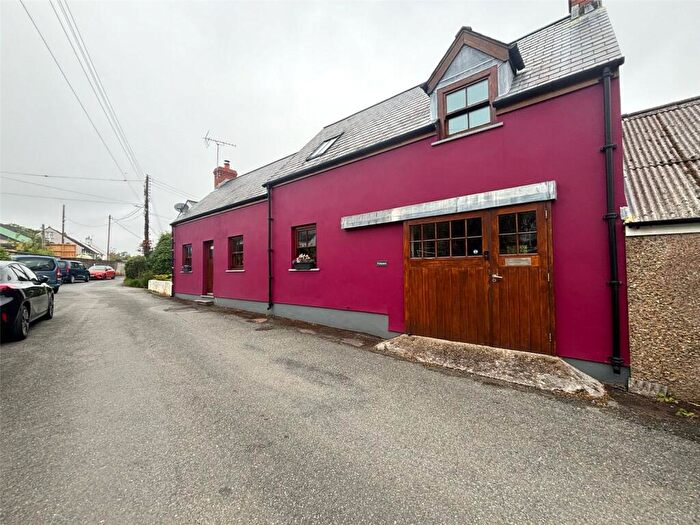
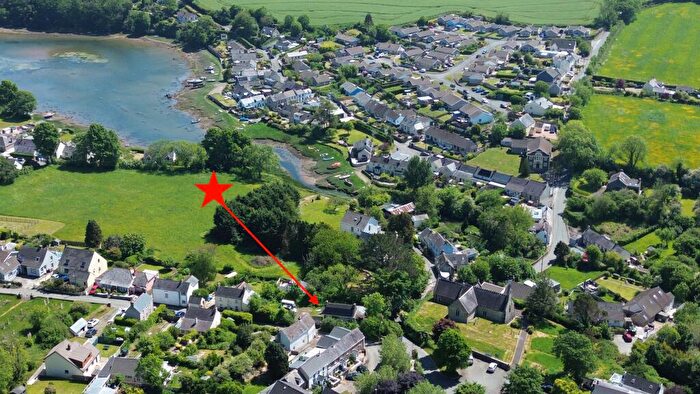
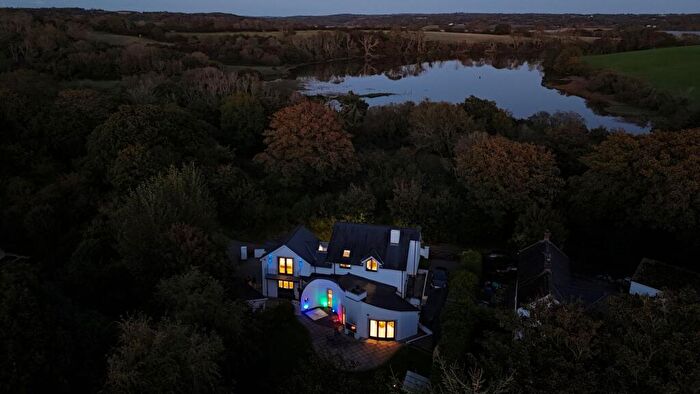
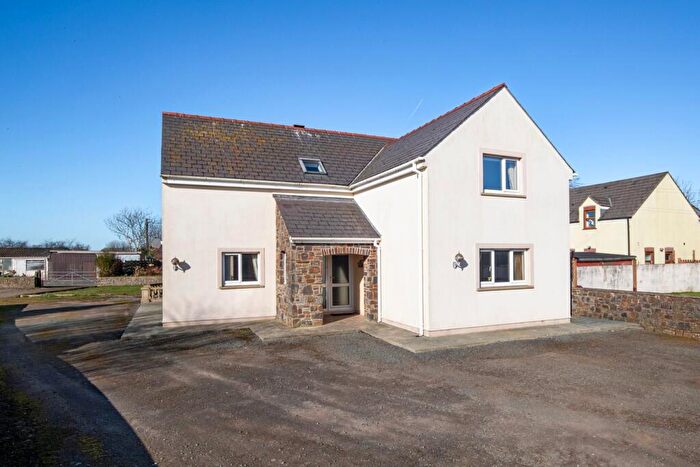
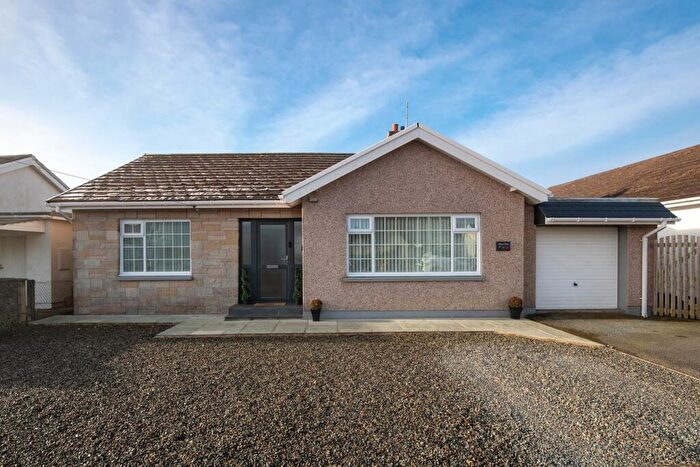
Houses for sale & to rent in Llangwm, Haverfordwest
House Prices in Llangwm
Properties in Llangwm have an average house price of £284,794.00 and had 112 Property Transactions within the last 3 years¹.
Llangwm is an area in Haverfordwest, Sir Benfro - Pembrokeshire with 961 households², where the most expensive property was sold for £625,000.00.
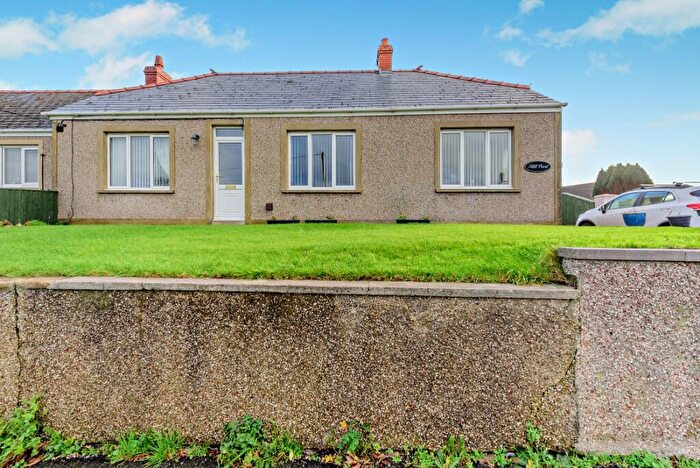
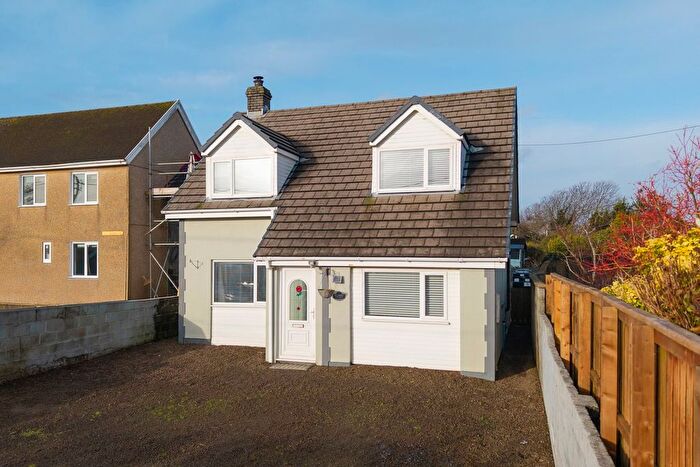
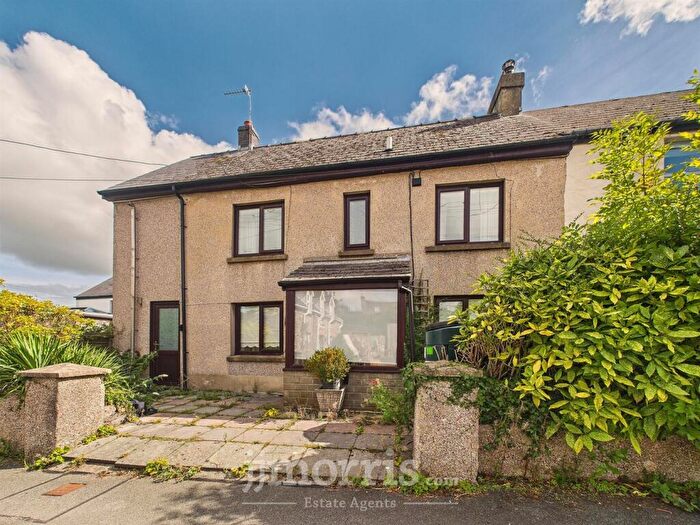
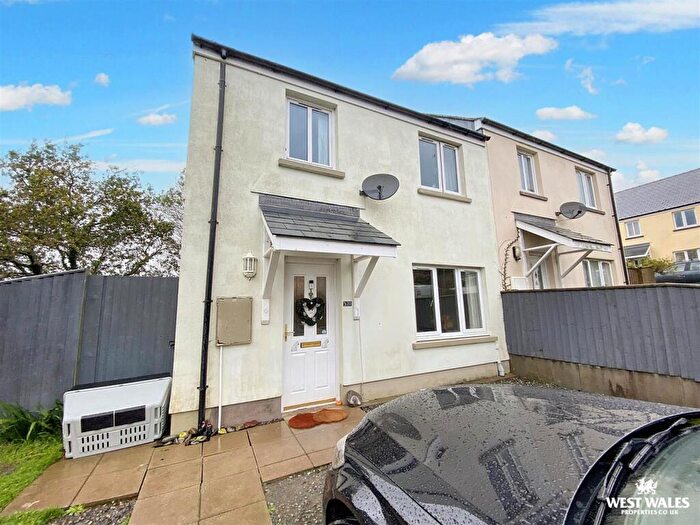
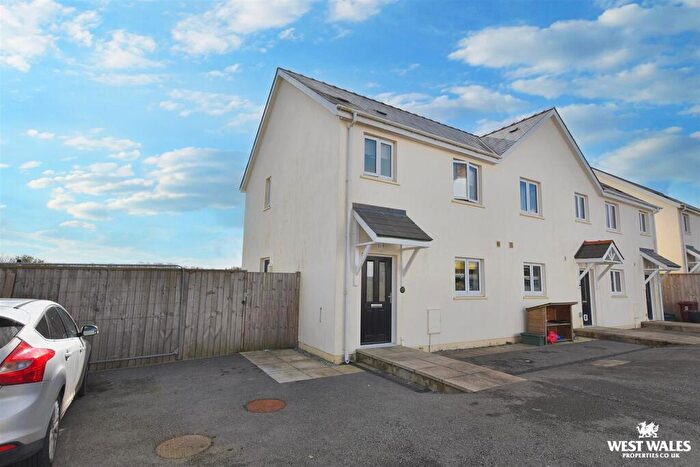
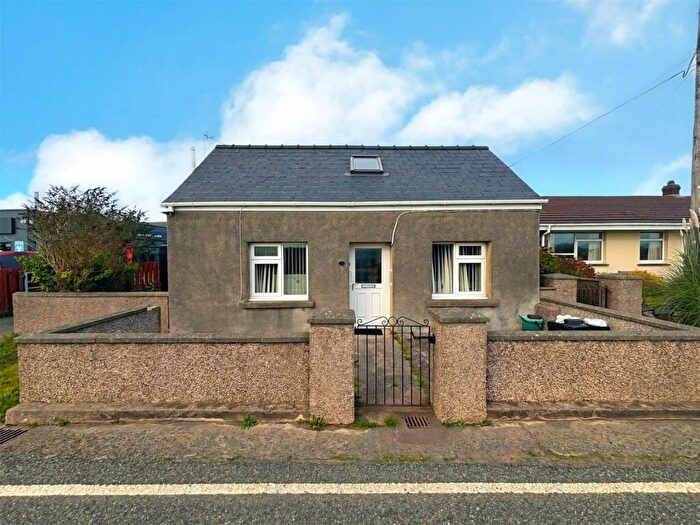
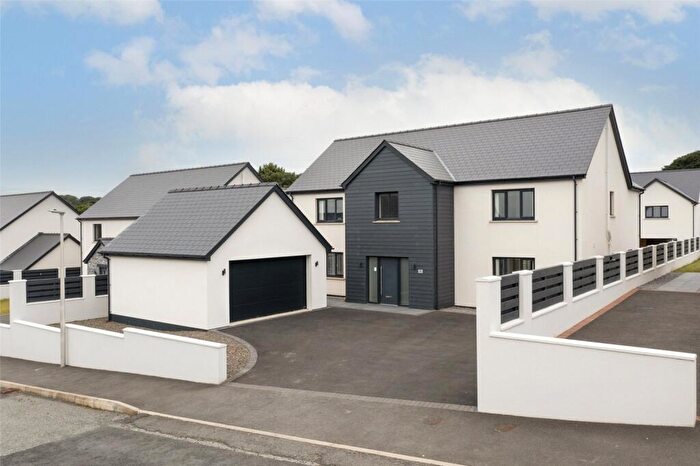
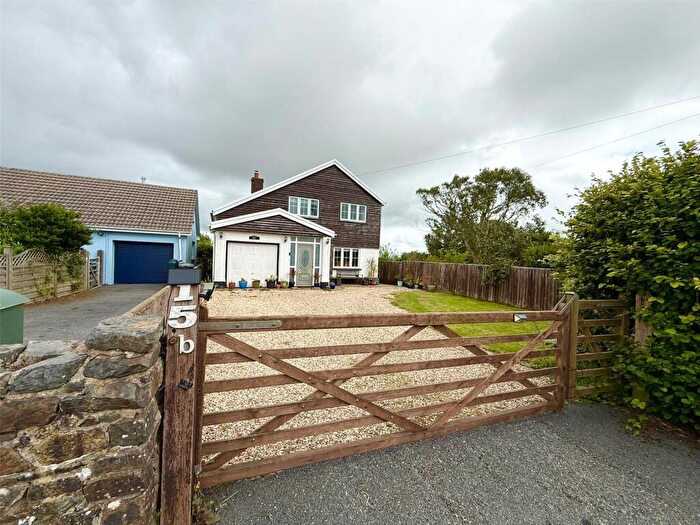
Properties for sale in Llangwm
Roads and Postcodes in Llangwm
Navigate through our locations to find the location of your next house in Llangwm, Haverfordwest for sale or to rent.
| Streets | Postcodes |
|---|---|
| Butterhill | SA62 4JP |
| Chapel Row | SA62 4HR |
| Cyffin Barn | SA62 4PF |
| Esther Lane | SA62 4JH |
| Furzey Crest | SA62 4NE |
| Gail Rise | SA62 4HW |
| Glanhafan | SA62 4JB |
| Greenway | SA62 4LL |
| Greenway Close | SA62 4LN |
| Guildford Bridge | SA62 4JE |
| Guildford Row | SA62 4JL |
| Harcourt Close | SA62 4NZ |
| Havard Close | SA62 4NF |
| Heathfield Terrace | SA62 4EU |
| Lake Villas | SA62 4HX |
| Landseer View | SA62 4LY |
| Leven Close | SA62 4LF |
| Llangwm Ferry | SA62 4JN |
| Lower Quay Road | SA62 4LR |
| Main Street | SA62 4HP |
| Meurigs Croft | SA62 4NY |
| Mill Street | SA62 4HU |
| Moorland Road | SA62 4LE |
| New Road | SA62 4LH SA62 4LJ SA62 4LP SA62 4LQ SA62 4LG |
| Newtown Road | SA62 4NB SA62 4ND |
| Orchard Row | SA62 4JJ |
| Pill Parks Way | SA62 4HT |
| Pill Road | SA62 4LU SA62 4LX |
| Poplar Meadow | SA62 4FB |
| Rectory Close | SA62 4JF |
| Rectory Road | SA62 4JA |
| River View | SA62 4JW |
| South View | SA62 4LT |
| St Clements Park | SA62 4EX |
| Targate Road | SA62 4EY SA62 4EA |
| The Close | SA62 4NA |
| The Gail | SA62 4HJ |
| The Green | SA62 4HS |
| The Grove | SA62 4LW |
| The Kilns | SA62 4HG |
| The Meads Drive | SA62 4LZ |
| Troopers Inn | SA62 4NJ |
| West Hook Road | SA62 4LS |
| Will Meadows | SA62 4AZ |
| Williamston Terrace | SA62 4JG |
| SA62 4ET SA62 4HA SA62 4HB SA62 4HE SA62 4HN SA62 4JD SA62 4JR SA62 4LB SA62 4LD SA62 4NG SA62 4NH SA62 4HD SA62 4HH SA62 4HL SA62 4HY SA62 4JU SA62 4NN |
Transport near Llangwm
- FAQ
- Price Paid By Year
- Property Type Price
Frequently asked questions about Llangwm
What is the average price for a property for sale in Llangwm?
The average price for a property for sale in Llangwm is £284,794. This amount is 13% higher than the average price in Haverfordwest. There are 643 property listings for sale in Llangwm.
What streets have the most expensive properties for sale in Llangwm?
The streets with the most expensive properties for sale in Llangwm are Poplar Meadow at an average of £580,000, The Meads Drive at an average of £450,000 and The Gail at an average of £414,166.
What streets have the most affordable properties for sale in Llangwm?
The streets with the most affordable properties for sale in Llangwm are Landseer View at an average of £158,500, Furzey Crest at an average of £160,000 and Chapel Row at an average of £165,000.
Which train stations are available in or near Llangwm?
Some of the train stations available in or near Llangwm are Johnston (Dyfed), Haverfordwest and Pembroke Dock.
Property Price Paid in Llangwm by Year
The average sold property price by year was:
| Year | Average Sold Price | Price Change |
Sold Properties
|
|---|---|---|---|
| 2025 | £268,678 | -13% |
28 Properties |
| 2024 | £304,756 | 9% |
33 Properties |
| 2023 | £276,347 | -3% |
23 Properties |
| 2022 | £284,323 | 14% |
28 Properties |
| 2021 | £244,615 | -1% |
51 Properties |
| 2020 | £246,691 | 12% |
31 Properties |
| 2019 | £217,925 | 5% |
41 Properties |
| 2018 | £206,593 | -3% |
32 Properties |
| 2017 | £212,565 | 6% |
52 Properties |
| 2016 | £200,393 | 7% |
29 Properties |
| 2015 | £185,579 | -3% |
37 Properties |
| 2014 | £190,637 | -5% |
36 Properties |
| 2013 | £201,074 | 13% |
34 Properties |
| 2012 | £175,038 | -9% |
26 Properties |
| 2011 | £190,294 | -7% |
17 Properties |
| 2010 | £203,155 | -0,2% |
35 Properties |
| 2009 | £203,566 | 18% |
17 Properties |
| 2008 | £167,096 | -36% |
26 Properties |
| 2007 | £227,894 | 21% |
29 Properties |
| 2006 | £179,188 | -3% |
34 Properties |
| 2005 | £183,981 | 11% |
30 Properties |
| 2004 | £163,050 | 24% |
29 Properties |
| 2003 | £123,870 | 14% |
47 Properties |
| 2002 | £106,234 | 29% |
59 Properties |
| 2001 | £75,877 | 8% |
38 Properties |
| 2000 | £69,974 | 7% |
38 Properties |
| 1999 | £65,054 | 1% |
45 Properties |
| 1998 | £64,099 | 10% |
29 Properties |
| 1997 | £57,473 | 9% |
21 Properties |
| 1996 | £52,570 | -4% |
24 Properties |
| 1995 | £54,930 | - |
18 Properties |
Property Price per Property Type in Llangwm
Here you can find historic sold price data in order to help with your property search.
The average Property Paid Price for specific property types in the last three years are:
| Property Type | Average Sold Price | Sold Properties |
|---|---|---|
| Semi Detached House | £212,760.00 | 25 Semi Detached Houses |
| Detached House | £323,156.00 | 73 Detached Houses |
| Terraced House | £213,400.00 | 14 Terraced Houses |

