Houses for sale & to rent in Milford: East, Milford Haven
House Prices in Milford: East
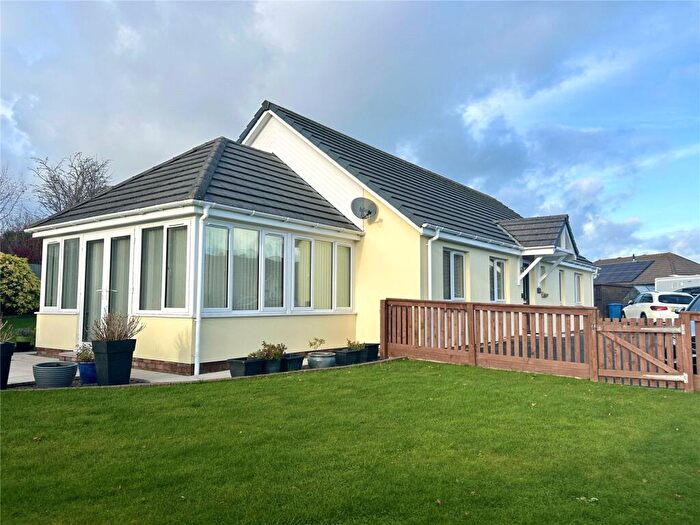
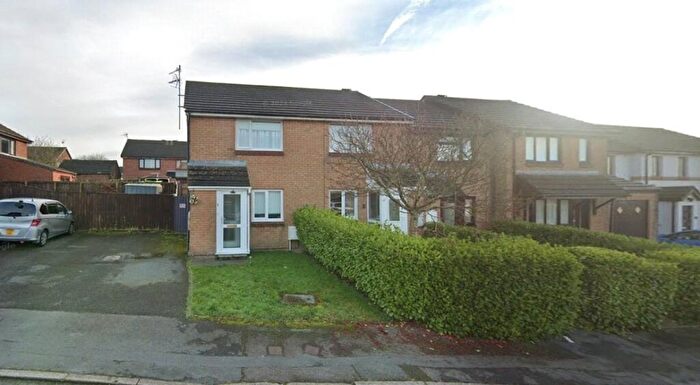
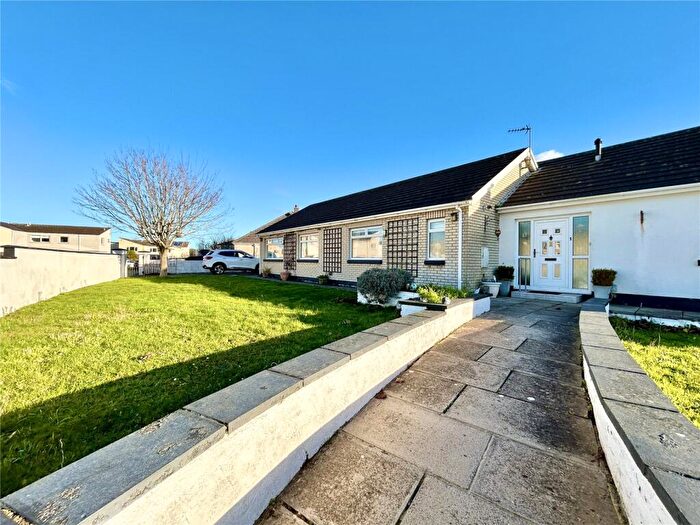
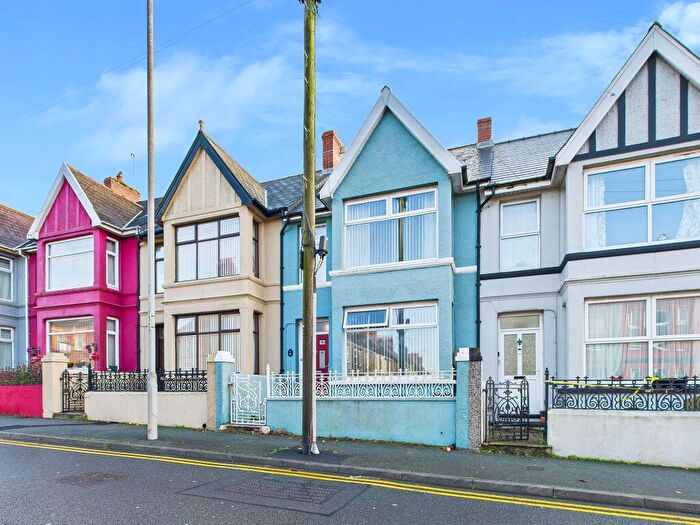
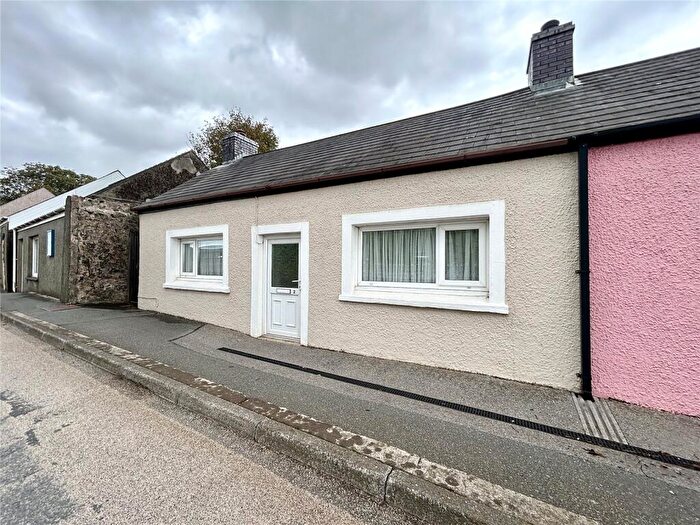
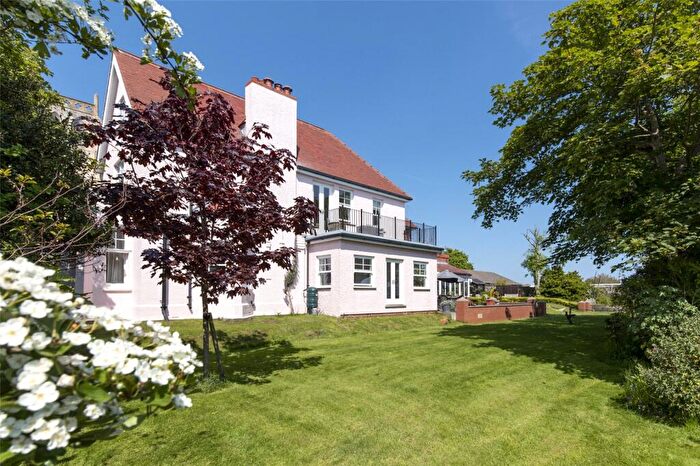
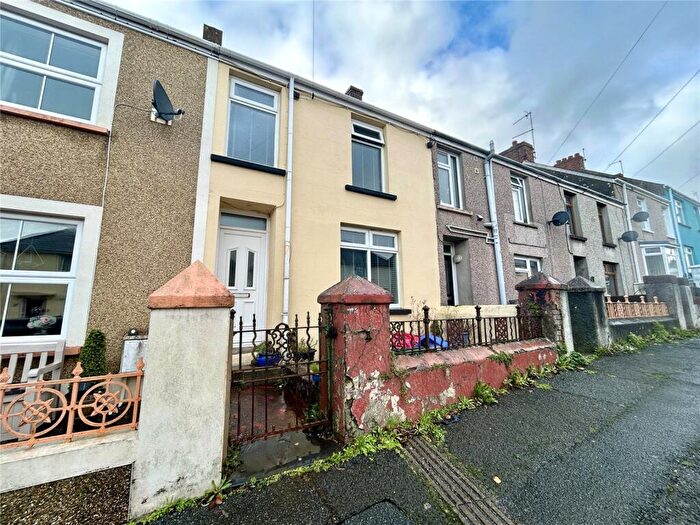
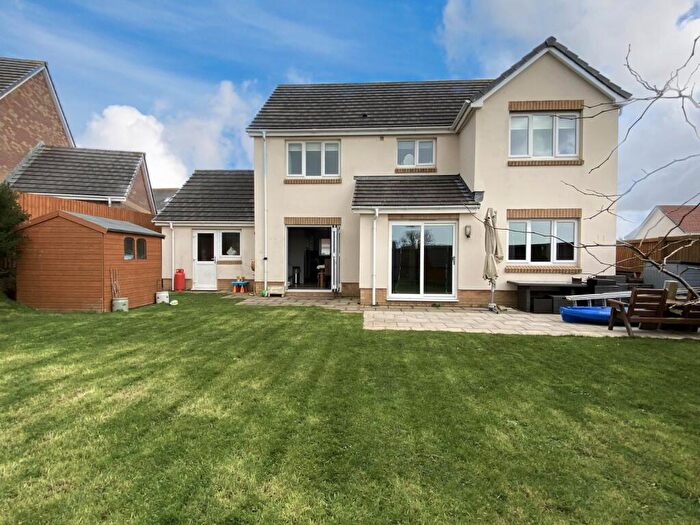
Properties in Milford: East have an average house price of £180,100.00 and had 80 Property Transactions within the last 3 years¹.
Milford: East is an area in Milford Haven, Sir Benfro - Pembrokeshire with 927 households², where the most expensive property was sold for £385,000.00.
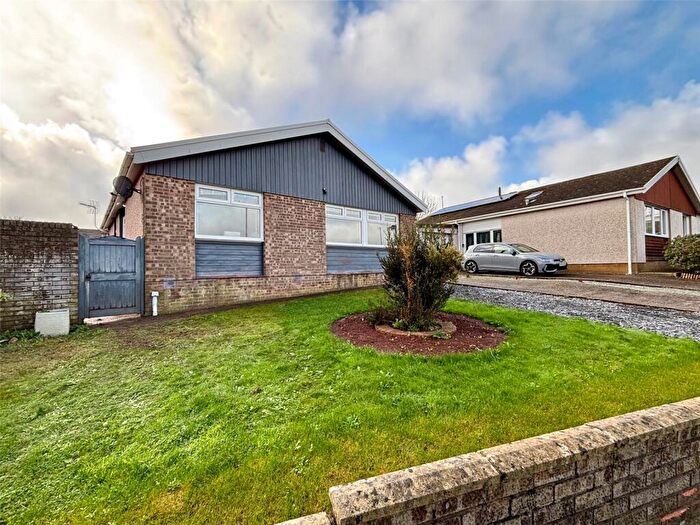
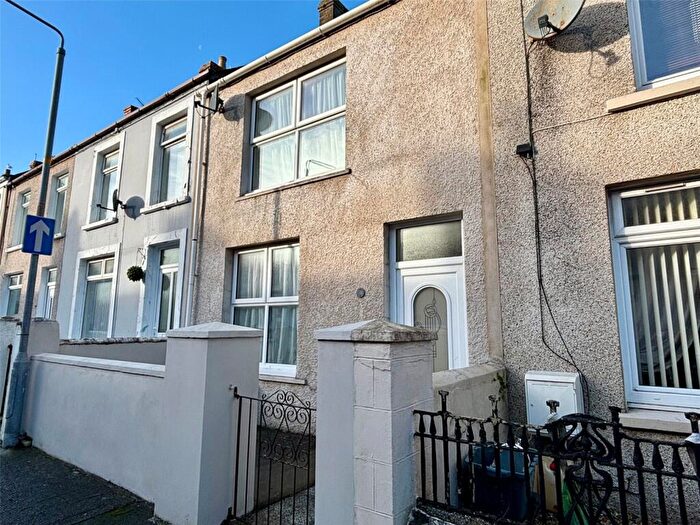
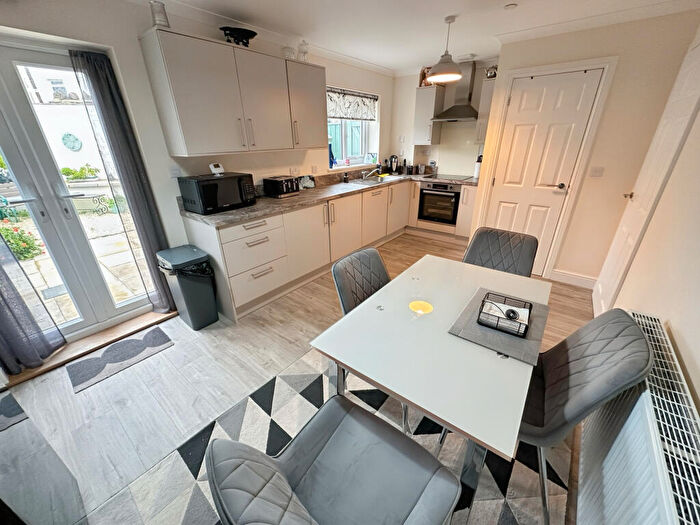
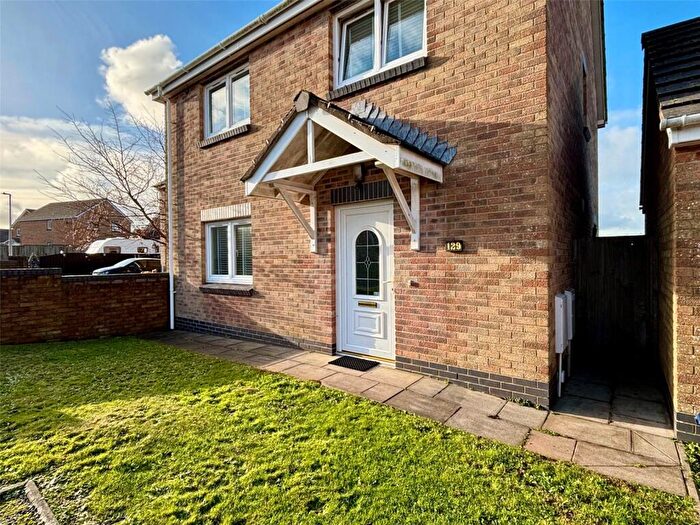
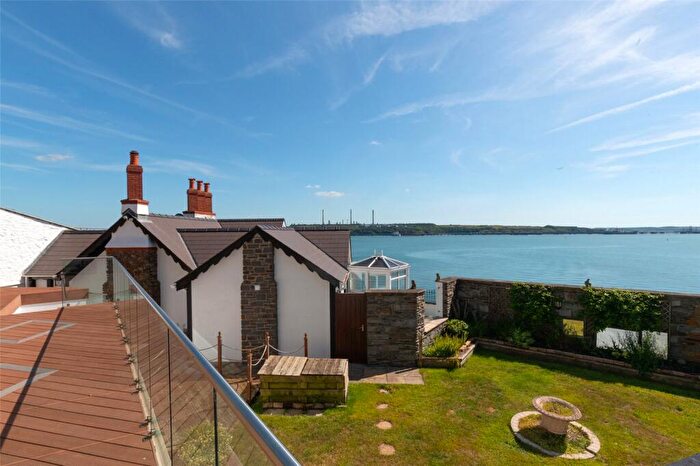
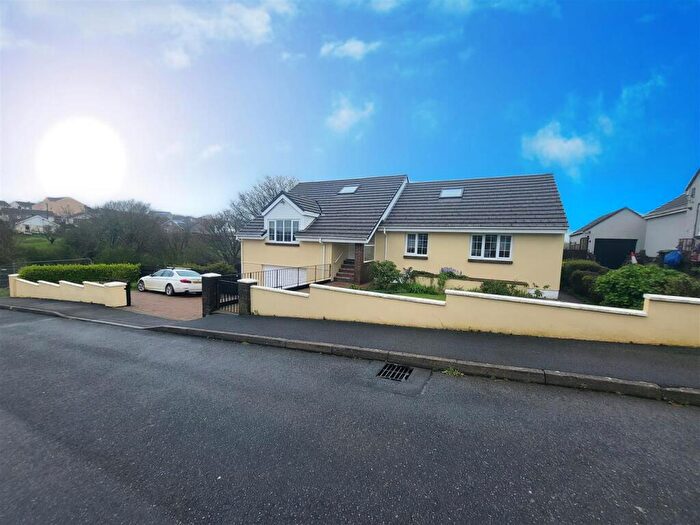
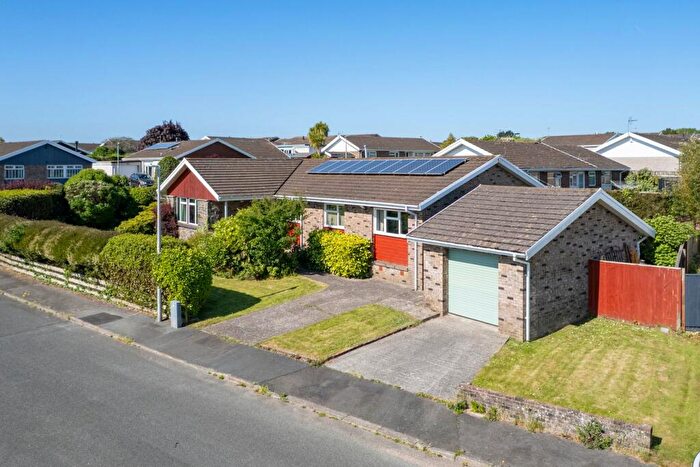
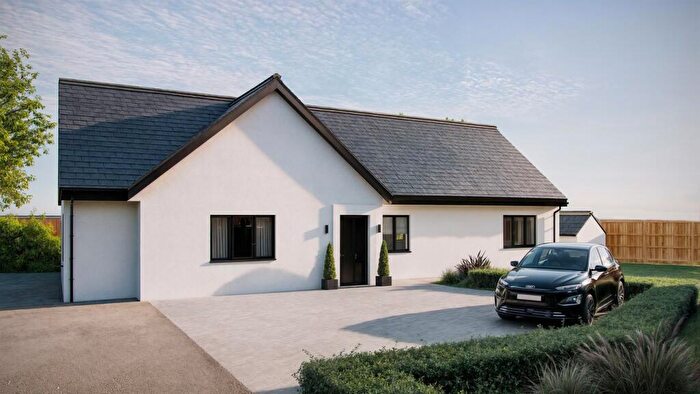
Properties for sale in Milford: East
Roads and Postcodes in Milford: East
Navigate through our locations to find the location of your next house in Milford: East, Milford Haven for sale or to rent.
| Streets | Postcodes |
|---|---|
| Ash Grove | SA73 1BG |
| Birch Mead | SA73 1BN |
| Blackbridge | SA73 1DG |
| Blackbridge Crescent | SA73 1DL |
| Blackbridge Drive | SA73 1ET |
| Bunkers Hill | SA73 1AG SA73 1AQ |
| Castle Hall Drive | SA73 1EU |
| Castle Hall Road | SA73 1DJ |
| Cedar Terrace | SA73 1EX |
| Cherry Tree Close | SA73 1BB |
| Chestnut Way | SA73 1BP |
| Coombs Drive | SA73 2NT SA73 2NU SA73 2NX SA73 2NY SA73 2NZ |
| Coombs Road | SA73 1DD SA73 1DE |
| Eastleigh Drive | SA73 2LX SA73 2LY |
| Elm Lane | SA73 1BQ |
| Hawthorn Path | SA73 1BW |
| Hilton Avenue | SA73 2PA SA73 2PB |
| Larch Road | SA73 1BY SA73 1BX |
| Lilac Close | SA73 1DF |
| Maple Close | SA73 1EZ |
| Mount Pleasant Way | SA73 1AA SA73 1AB |
| Myrtle Meadows | SA73 1GH SA73 1GL |
| Oaklands | SA73 1BU |
| Pill Road | SA73 2NP SA73 2NR SA73 2NS |
| Steynton Road | SA73 1BJ SA73 1DA SA73 1BD |
| Sycamore Close | SA73 1BT |
| Waterston Road | SA73 1DN |
| Willow End | SA73 1BS |
| Woodland Crescent | SA73 1BZ |
| Woodland Drive | SA73 1BE |
| Woodlands View | SA73 1EY |
| SA73 1DB |
Transport near Milford: East
- FAQ
- Price Paid By Year
- Property Type Price
Frequently asked questions about Milford: East
What is the average price for a property for sale in Milford: East?
The average price for a property for sale in Milford: East is £180,100. This amount is 5% lower than the average price in Milford Haven. There are 445 property listings for sale in Milford: East.
What streets have the most expensive properties for sale in Milford: East?
The streets with the most expensive properties for sale in Milford: East are Lilac Close at an average of £295,000, Woodlands View at an average of £265,169 and Myrtle Meadows at an average of £248,743.
What streets have the most affordable properties for sale in Milford: East?
The streets with the most affordable properties for sale in Milford: East are Larch Road at an average of £66,000, Ash Grove at an average of £85,000 and Pill Road at an average of £125,325.
Which train stations are available in or near Milford: East?
Some of the train stations available in or near Milford: East are Milford Haven, Johnston (Dyfed) and Pembroke Dock.
Property Price Paid in Milford: East by Year
The average sold property price by year was:
| Year | Average Sold Price | Price Change |
Sold Properties
|
|---|---|---|---|
| 2025 | £205,350 | 12% |
10 Properties |
| 2024 | £181,015 | 10% |
23 Properties |
| 2023 | £163,812 | -11% |
20 Properties |
| 2022 | £182,035 | 5% |
27 Properties |
| 2021 | £173,464 | 12% |
44 Properties |
| 2020 | £152,614 | 4% |
21 Properties |
| 2019 | £146,777 | -1% |
25 Properties |
| 2018 | £148,916 | -5% |
34 Properties |
| 2017 | £155,826 | 20% |
39 Properties |
| 2016 | £124,652 | 3% |
24 Properties |
| 2015 | £120,818 | 13% |
30 Properties |
| 2014 | £105,045 | -14% |
38 Properties |
| 2013 | £119,447 | -20% |
24 Properties |
| 2012 | £143,466 | 6% |
15 Properties |
| 2011 | £135,409 | 21% |
32 Properties |
| 2010 | £107,647 | -3% |
17 Properties |
| 2009 | £110,875 | -17% |
16 Properties |
| 2008 | £129,363 | -1% |
15 Properties |
| 2007 | £130,296 | -5% |
27 Properties |
| 2006 | £136,583 | 15% |
24 Properties |
| 2005 | £116,547 | 9% |
22 Properties |
| 2004 | £106,135 | 35% |
18 Properties |
| 2003 | £69,086 | 13% |
27 Properties |
| 2002 | £60,081 | 15% |
24 Properties |
| 2001 | £50,794 | 13% |
27 Properties |
| 2000 | £43,999 | 11% |
29 Properties |
| 1999 | £39,100 | 14% |
10 Properties |
| 1998 | £33,676 | -31% |
17 Properties |
| 1997 | £44,032 | 18% |
12 Properties |
| 1996 | £36,227 | 2% |
22 Properties |
| 1995 | £35,678 | - |
14 Properties |
Property Price per Property Type in Milford: East
Here you can find historic sold price data in order to help with your property search.
The average Property Paid Price for specific property types in the last three years are:
| Property Type | Average Sold Price | Sold Properties |
|---|---|---|
| Semi Detached House | £161,093.00 | 40 Semi Detached Houses |
| Detached House | £260,081.00 | 22 Detached Houses |
| Terraced House | £133,281.00 | 16 Terraced Houses |
| Flat | £55,000.00 | 2 Flats |

