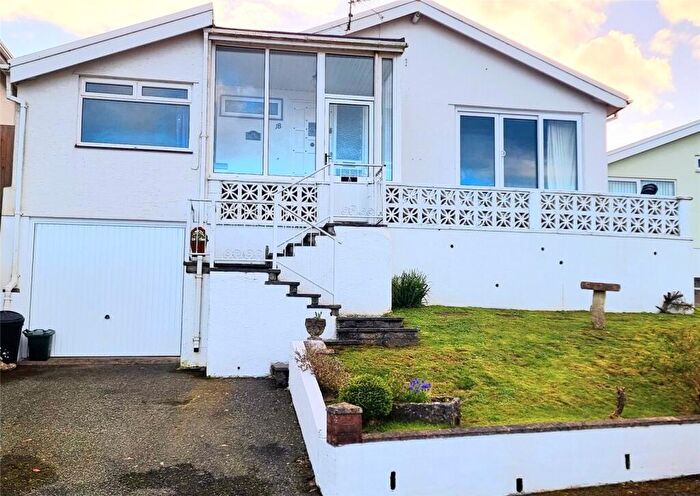
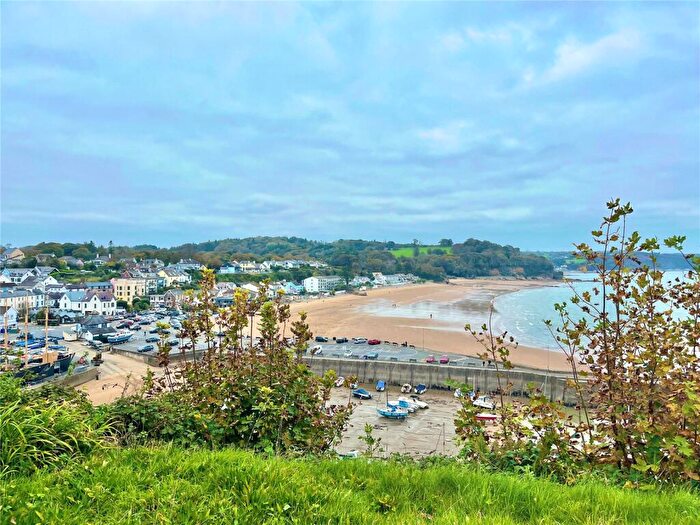
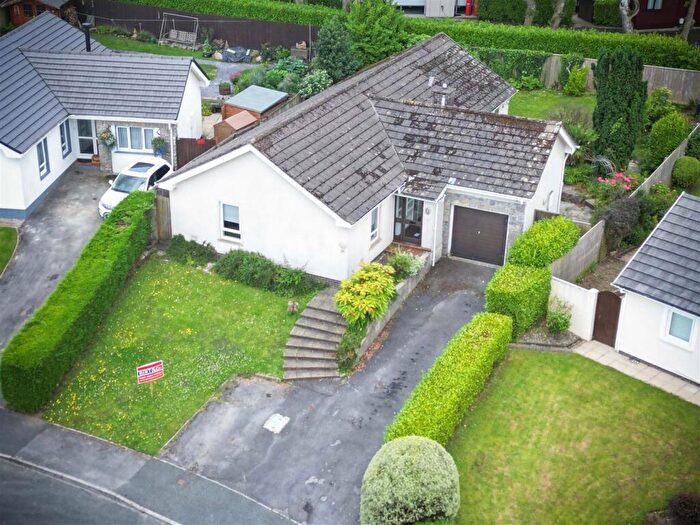
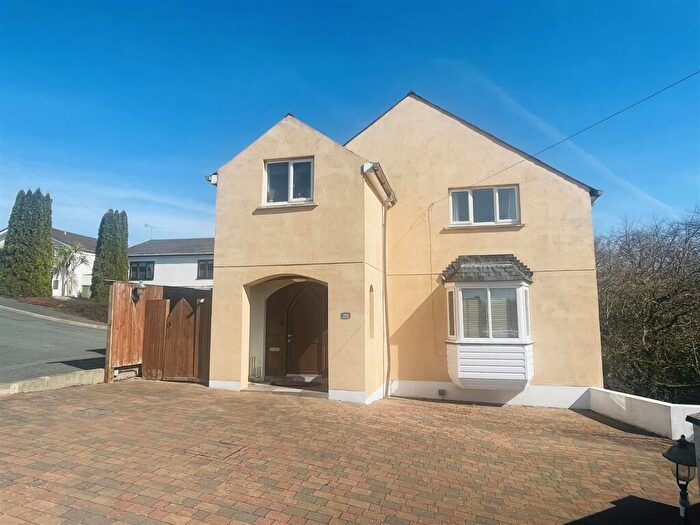
Houses for sale & to rent in Penally, Saundersfoot
House Prices in Penally
Properties in Penally have an average house price of £366,429.00 and had 22 Property Transactions within the last 3 years¹.
Penally is an area in Saundersfoot, Sir Benfro - Pembrokeshire with 145 households², where the most expensive property was sold for £500,000.00.
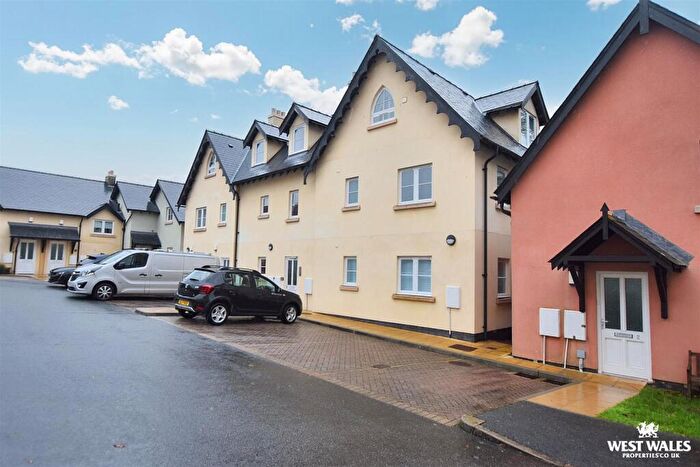
Properties for sale in Penally
Roads and Postcodes in Penally
Navigate through our locations to find the location of your next house in Penally, Saundersfoot for sale or to rent.
| Streets | Postcodes |
|---|---|
| Broadfield Hill | SA69 9PA |
| Charles Norris Gardens | SA69 9DF |
| Cross Park | SA69 9DW |
| Cwm Gwennol | SA69 9PN |
| Devonshire Drive | SA69 9EE |
| High Grove | SA69 9DQ |
| Nyth Gwennol | SA69 9PW |
| Oak Grove | SA69 9EF |
| Rushylake | SA69 9NY |
| Swallow Tree | SA69 9DD SA69 9DE |
| Twycross | SA69 9DH SA69 9DP SA69 9DJ |
| SA69 9DG SA69 9DL |
Transport near Penally
- FAQ
- Price Paid By Year
- Property Type Price
Frequently asked questions about Penally
What is the average price for a property for sale in Penally?
The average price for a property for sale in Penally is £366,429. This amount is 12% higher than the average price in Saundersfoot. There are 747 property listings for sale in Penally.
What streets have the most expensive properties for sale in Penally?
The streets with the most expensive properties for sale in Penally are Nyth Gwennol at an average of £451,000, Cwm Gwennol at an average of £430,000 and Devonshire Drive at an average of £370,000.
What streets have the most affordable properties for sale in Penally?
The streets with the most affordable properties for sale in Penally are Oak Grove at an average of £300,390, Rushylake at an average of £325,900 and Broadfield Hill at an average of £366,250.
Which train stations are available in or near Penally?
Some of the train stations available in or near Penally are Saundersfoot, Tenby and Kilgetty.
Property Price Paid in Penally by Year
The average sold property price by year was:
| Year | Average Sold Price | Price Change |
Sold Properties
|
|---|---|---|---|
| 2025 | £371,500 | -4% |
5 Properties |
| 2024 | £386,250 | 7% |
4 Properties |
| 2023 | £357,400 | -0,4% |
5 Properties |
| 2022 | £358,993 | 8% |
8 Properties |
| 2021 | £329,363 | 34% |
11 Properties |
| 2020 | £216,266 | -2% |
18 Properties |
| 2019 | £219,843 | -8% |
22 Properties |
| 2018 | £238,025 | 8% |
14 Properties |
| 2017 | £219,683 | -34% |
6 Properties |
| 2016 | £294,142 | -6% |
7 Properties |
| 2015 | £312,272 | 31% |
11 Properties |
| 2014 | £215,124 | -15% |
4 Properties |
| 2013 | £248,125 | -1% |
4 Properties |
| 2012 | £250,000 | 7% |
1 Property |
| 2011 | £231,666 | -51% |
3 Properties |
| 2010 | £349,950 | 33% |
1 Property |
| 2009 | £234,214 | -23% |
7 Properties |
| 2008 | £287,475 | -1% |
2 Properties |
| 2007 | £290,500 | 12% |
7 Properties |
| 2006 | £255,675 | 43% |
6 Properties |
| 2005 | £147,000 | -55% |
3 Properties |
| 2004 | £227,390 | 19% |
10 Properties |
| 2003 | £185,000 | 24% |
4 Properties |
| 2002 | £139,733 | 14% |
6 Properties |
| 2001 | £120,800 | 17% |
5 Properties |
| 2000 | £100,166 | 22% |
6 Properties |
| 1999 | £78,150 | -9% |
7 Properties |
| 1998 | £84,994 | 21% |
9 Properties |
| 1997 | £66,995 | 1% |
10 Properties |
| 1996 | £66,000 | -1% |
2 Properties |
| 1995 | £66,375 | - |
4 Properties |
Property Price per Property Type in Penally
Here you can find historic sold price data in order to help with your property search.
The average Property Paid Price for specific property types in the last three years are:
| Property Type | Average Sold Price | Sold Properties |
|---|---|---|
| Semi Detached House | £271,737.00 | 4 Semi Detached Houses |
| Detached House | £387,472.00 | 18 Detached Houses |

