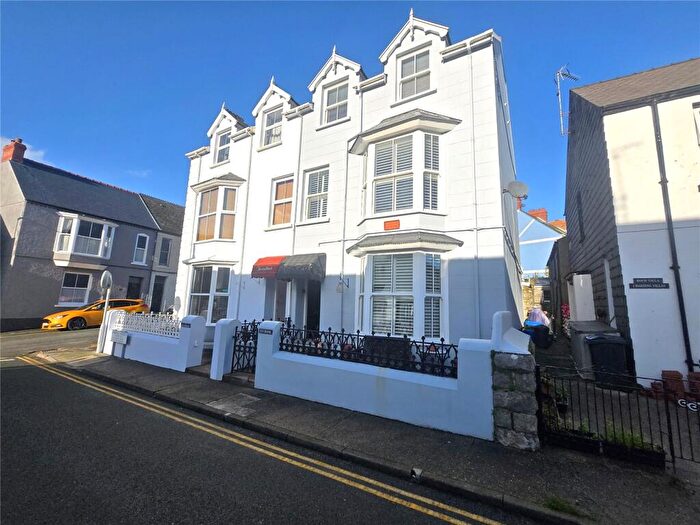
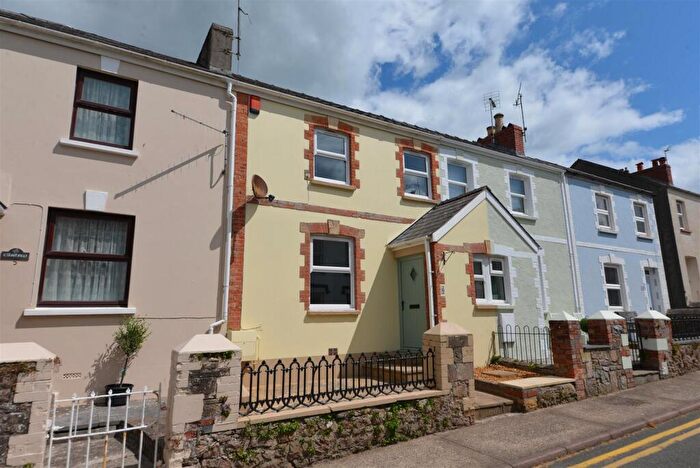
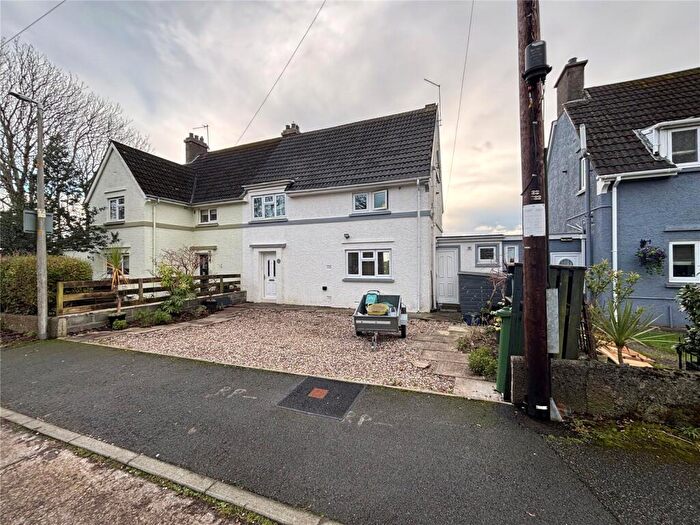
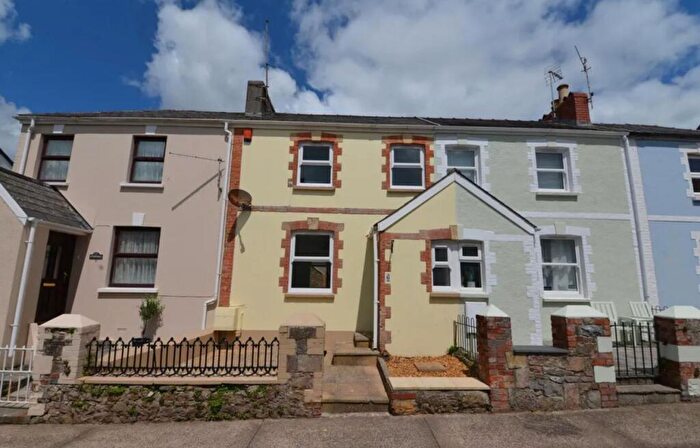
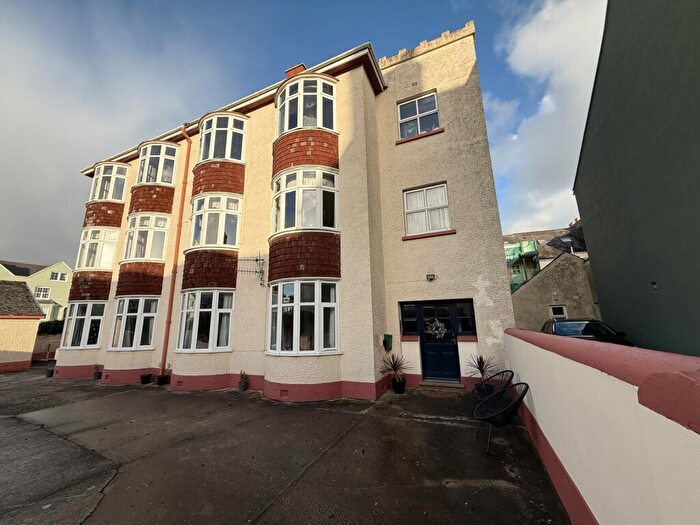
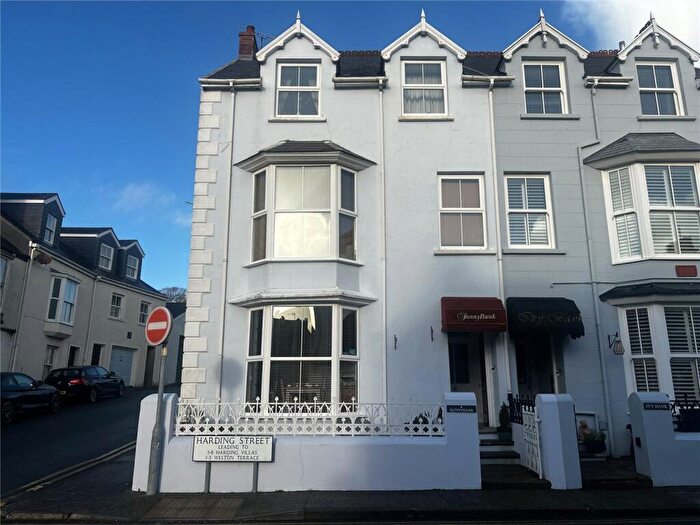
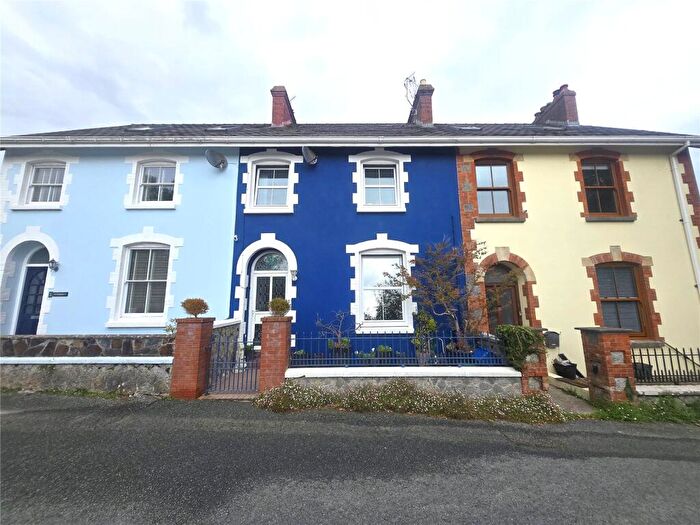
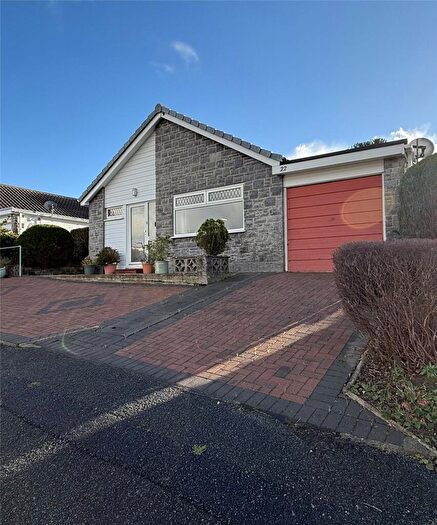
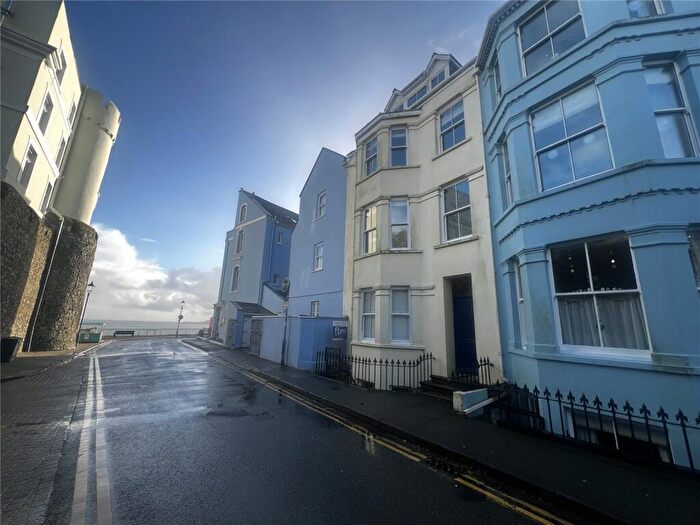
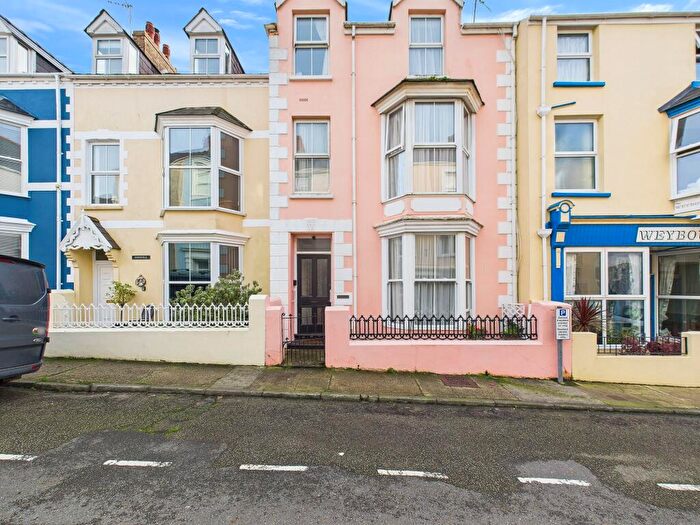
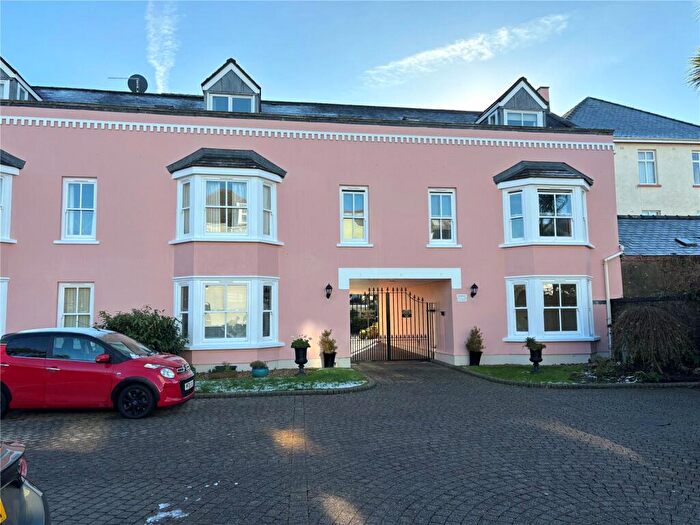
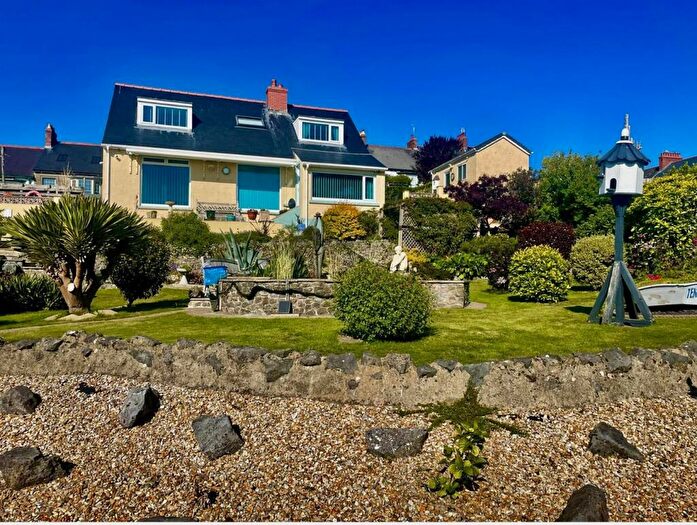
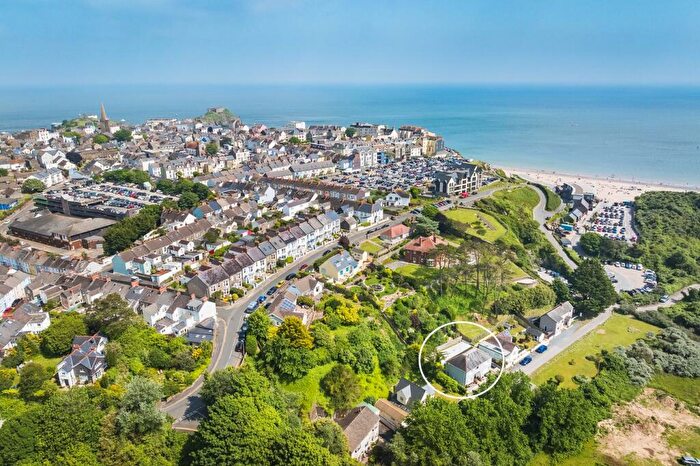
Houses for sale & to rent in Tenby: North, Tenby
House Prices in Tenby: North
Properties in Tenby: North have an average house price of £344,302.00 and had 135 Property Transactions within the last 3 years¹.
Tenby: North is an area in Tenby, Sir Benfro - Pembrokeshire with 959 households², where the most expensive property was sold for £2,700,000.00.
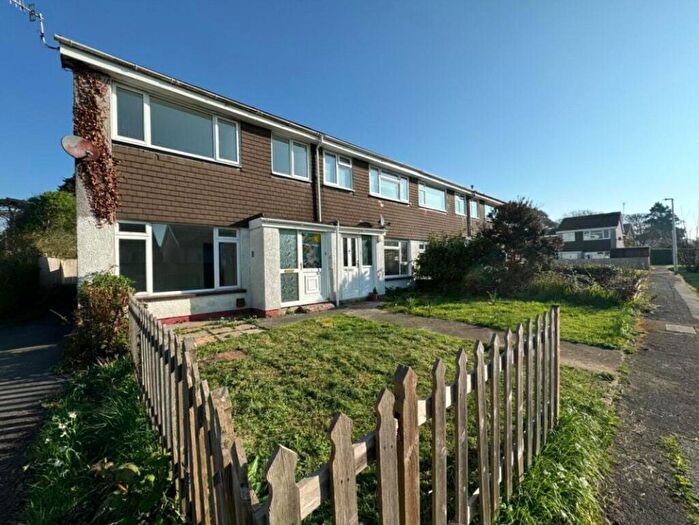
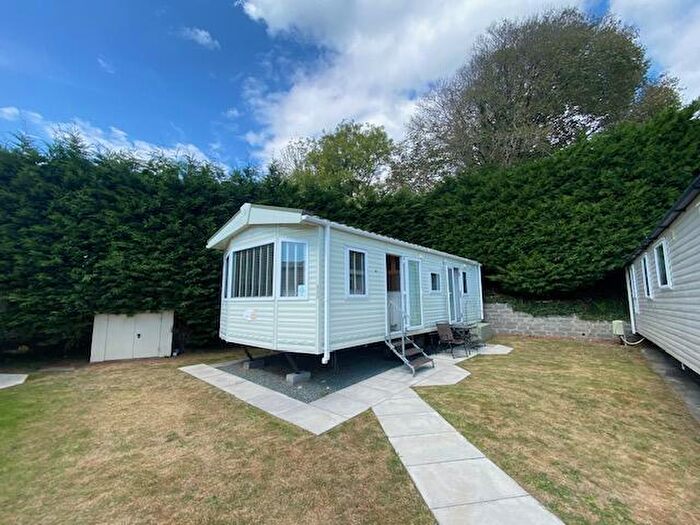
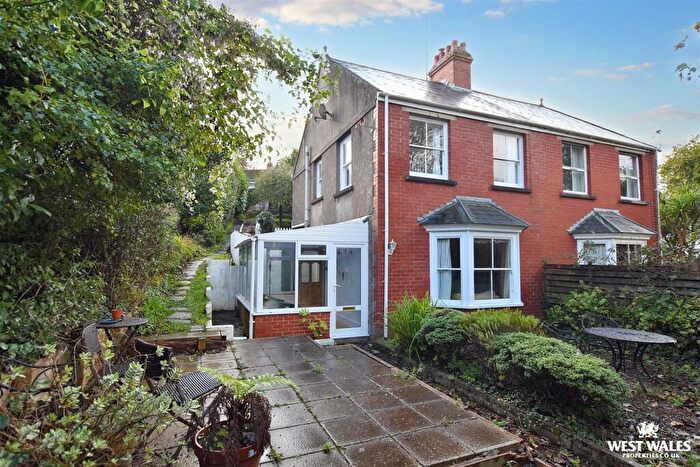
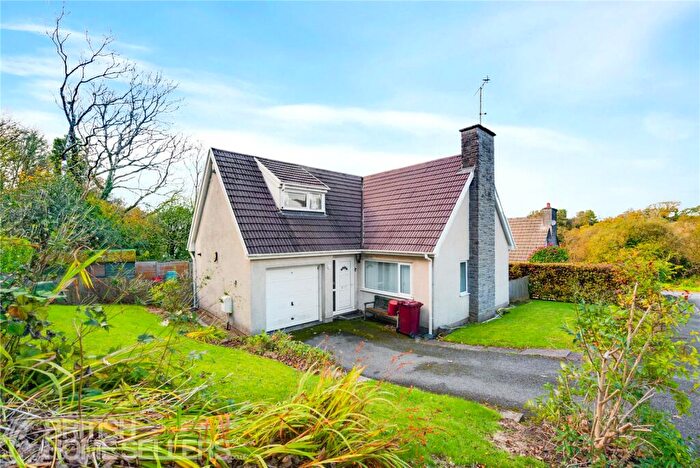
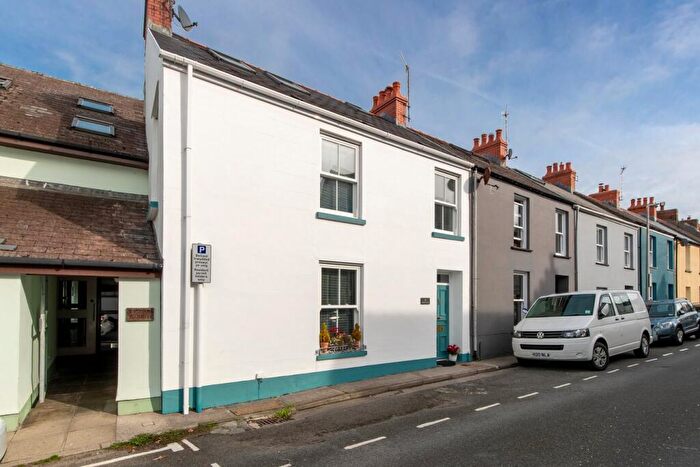
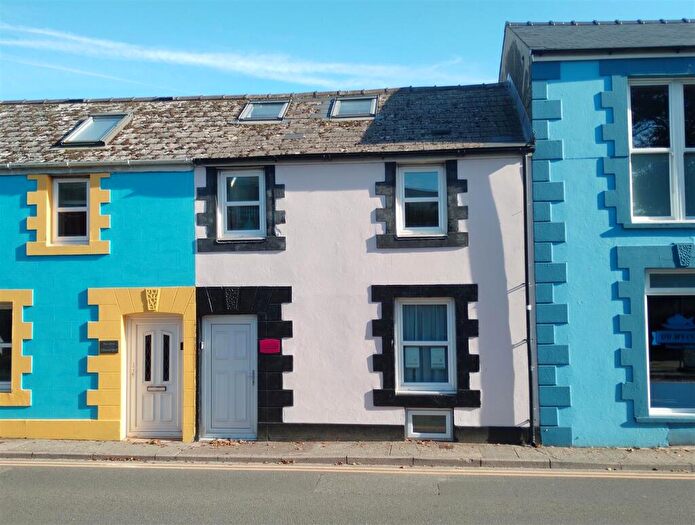
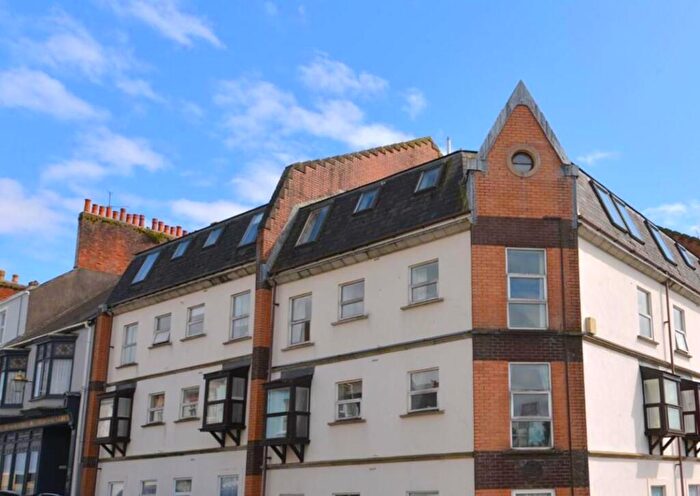
Properties for sale in Tenby: North
Roads and Postcodes in Tenby: North
Navigate through our locations to find the location of your next house in Tenby: North, Tenby for sale or to rent.
| Streets | Postcodes |
|---|---|
| Broadwell Hayes | SA70 8DG SA70 8DL SA70 8DQ |
| Bryn Hir | SA70 8TT |
| Croft Court | SA70 8AR SA70 8AS |
| Gas Lane | SA70 8AG SA70 8AQ |
| Glenview Crescent | SA70 8JB |
| Green Crescent | SA70 8HQ |
| Greenhill Road | SA70 7LG SA70 7LJ SA70 7AN |
| Haytor Gardens | SA70 8HW |
| Heywood Court | SA70 8BP SA70 8BS |
| Heywood Lane | SA70 8BL SA70 8BY SA70 8BZ |
| Hill Park | SA70 8HX |
| Jubilee Cottages | SA70 8DH |
| Lady Park | SA70 8JH SA70 8JJ |
| Lamack Vale | SA70 8DN |
| Leach Way | SA70 8BH |
| Maudlins | SA70 8DE |
| Mayfield Drive | SA70 8HR |
| Merlins Court | SA70 8AD |
| Merlins Gardens | SA70 8AE |
| Narberth Road | SA70 8HS SA70 8HT SA70 8HY SA70 8JD SA70 8TH |
| North Cliffe | SA70 8AT SA70 8AU |
| Oakridge Acres | SA70 8DB |
| Rectory Court | SA70 8HD |
| Rocky Park | SA70 7LH |
| Scotsborough View | SA70 8DW |
| Seascape | SA70 8JL |
| Serpentine Road | SA70 8DD SA70 8DP |
| Southlands | SA70 8HU |
| St Johns Croft | SA70 8HG |
| St Johns Hill | SA70 8HE SA70 8HF |
| The Croft | SA70 8AP |
| The Glebe | SA70 8HA SA70 8HB |
| The Green | SA70 8EY |
| The Norton | SA70 8AA SA70 8AB SA70 8AF SA70 8AH |
| The Paddock | SA70 8DJ |
| Upper Hill Park | SA70 8JE SA70 8JF SA70 8JG |
| White Lion Street | SA70 7ES SA70 7ET |
| SA70 8BB |
Transport near Tenby: North
- FAQ
- Price Paid By Year
- Property Type Price
Frequently asked questions about Tenby: North
What is the average price for a property for sale in Tenby: North?
The average price for a property for sale in Tenby: North is £344,302. This amount is 6% higher than the average price in Tenby. There are 1,169 property listings for sale in Tenby: North.
What streets have the most expensive properties for sale in Tenby: North?
The streets with the most expensive properties for sale in Tenby: North are Haytor Gardens at an average of £756,666, The Croft at an average of £454,188 and Narberth Road at an average of £408,333.
What streets have the most affordable properties for sale in Tenby: North?
The streets with the most affordable properties for sale in Tenby: North are Rectory Court at an average of £72,500, Maudlins at an average of £193,714 and The Norton at an average of £203,084.
Which train stations are available in or near Tenby: North?
Some of the train stations available in or near Tenby: North are Tenby, Penally and Saundersfoot.
Property Price Paid in Tenby: North by Year
The average sold property price by year was:
| Year | Average Sold Price | Price Change |
Sold Properties
|
|---|---|---|---|
| 2025 | £278,166 | -2% |
18 Properties |
| 2024 | £283,989 | -40% |
37 Properties |
| 2023 | £397,019 | 6% |
46 Properties |
| 2022 | £373,626 | 23% |
34 Properties |
| 2021 | £287,243 | 13% |
43 Properties |
| 2020 | £249,958 | 4% |
30 Properties |
| 2019 | £238,737 | -12% |
44 Properties |
| 2018 | £267,456 | 12% |
47 Properties |
| 2017 | £235,868 | 6% |
47 Properties |
| 2016 | £222,232 | -9% |
43 Properties |
| 2015 | £241,185 | 1% |
58 Properties |
| 2014 | £238,683 | 14% |
50 Properties |
| 2013 | £204,617 | -6% |
31 Properties |
| 2012 | £216,771 | 11% |
38 Properties |
| 2011 | £193,314 | -8% |
27 Properties |
| 2010 | £209,417 | -6% |
31 Properties |
| 2009 | £221,269 | 7% |
26 Properties |
| 2008 | £204,917 | -25% |
28 Properties |
| 2007 | £255,516 | 22% |
57 Properties |
| 2006 | £199,449 | -4% |
46 Properties |
| 2005 | £208,091 | 18% |
47 Properties |
| 2004 | £170,821 | 11% |
61 Properties |
| 2003 | £152,013 | 33% |
45 Properties |
| 2002 | £101,459 | 26% |
41 Properties |
| 2001 | £74,744 | -14% |
46 Properties |
| 2000 | £84,850 | 23% |
38 Properties |
| 1999 | £64,913 | 5% |
50 Properties |
| 1998 | £61,965 | 4% |
47 Properties |
| 1997 | £59,294 | -3% |
42 Properties |
| 1996 | £60,822 | 8% |
31 Properties |
| 1995 | £56,061 | - |
39 Properties |
Property Price per Property Type in Tenby: North
Here you can find historic sold price data in order to help with your property search.
The average Property Paid Price for specific property types in the last three years are:
| Property Type | Average Sold Price | Sold Properties |
|---|---|---|
| Semi Detached House | £279,584.00 | 29 Semi Detached Houses |
| Detached House | £547,388.00 | 27 Detached Houses |
| Terraced House | £273,287.00 | 20 Terraced Houses |
| Flat | £307,247.00 | 59 Flats |

