
Houses for sale & to rent in East Williamston, Tenby
House Prices in East Williamston
Properties in East Williamston have an average house price of £442,857.00 and had 7 Property Transactions within the last 3 years¹.
East Williamston is an area in Tenby, Sir Benfro - Pembrokeshire with 69 households², where the most expensive property was sold for £540,000.00.
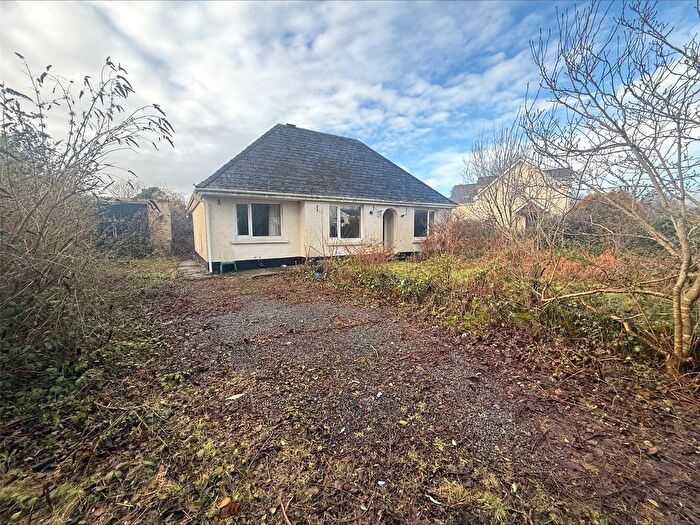
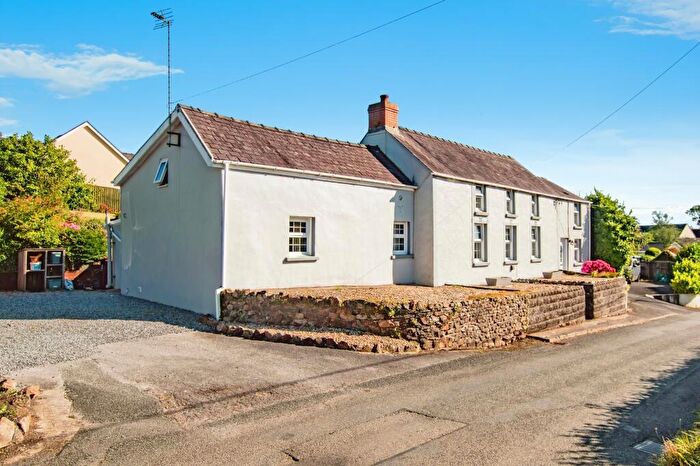
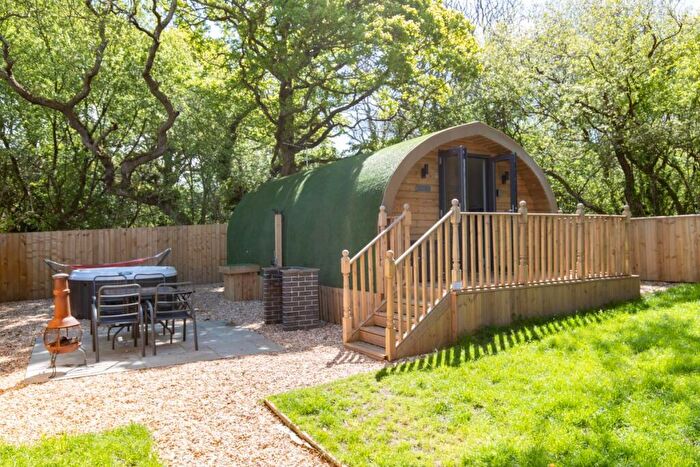
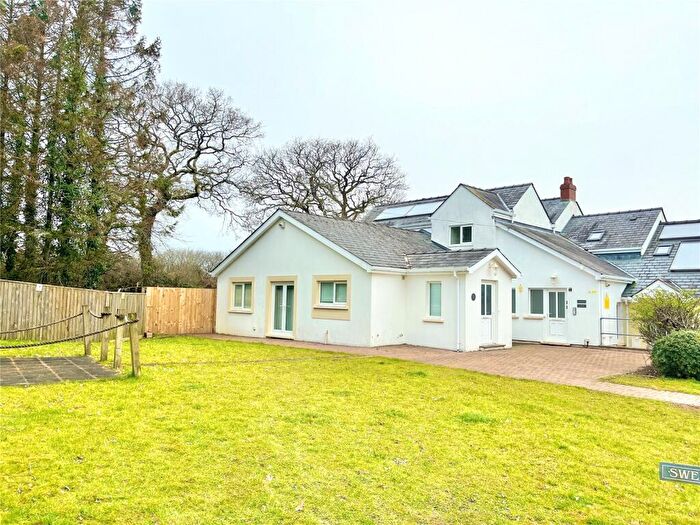
Properties for sale in East Williamston

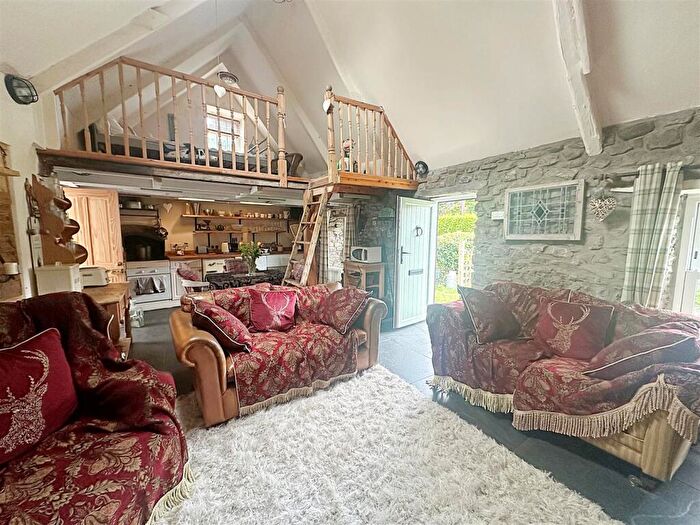
![]()
If you are looking to sell your house, let it out, or receive a property valuation, an expert can help you.
Click the button below to get started.
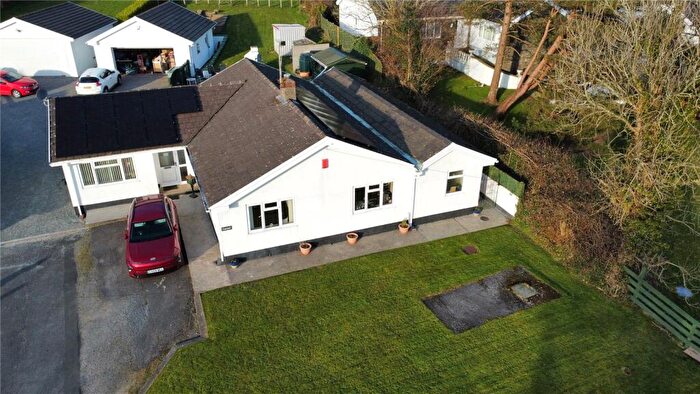
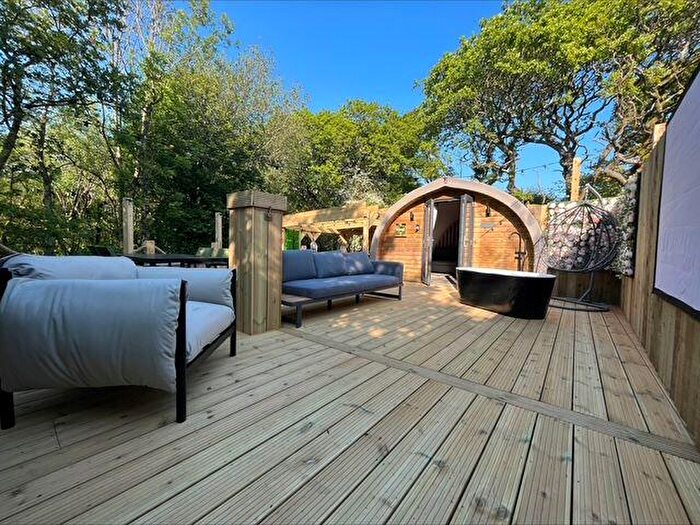
Previously listed properties in East Williamston
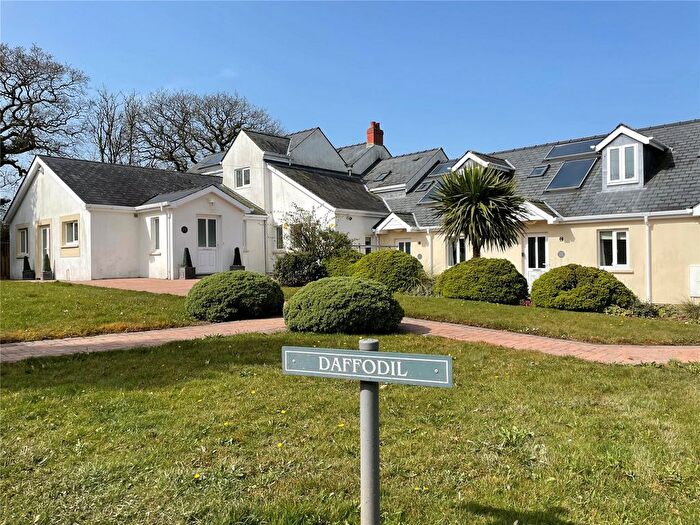
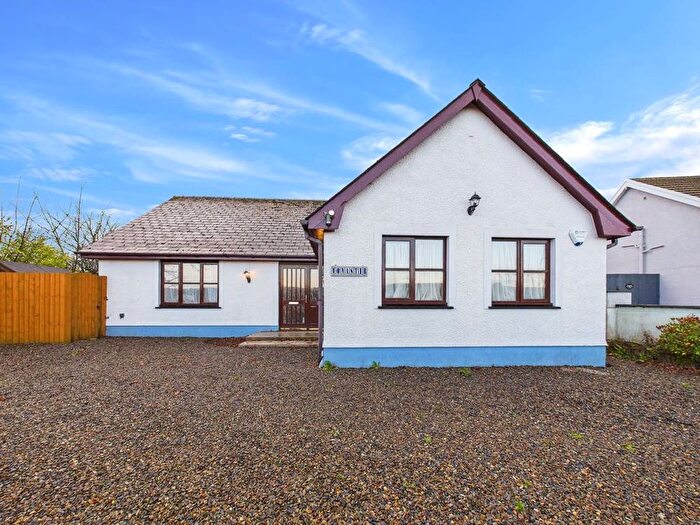

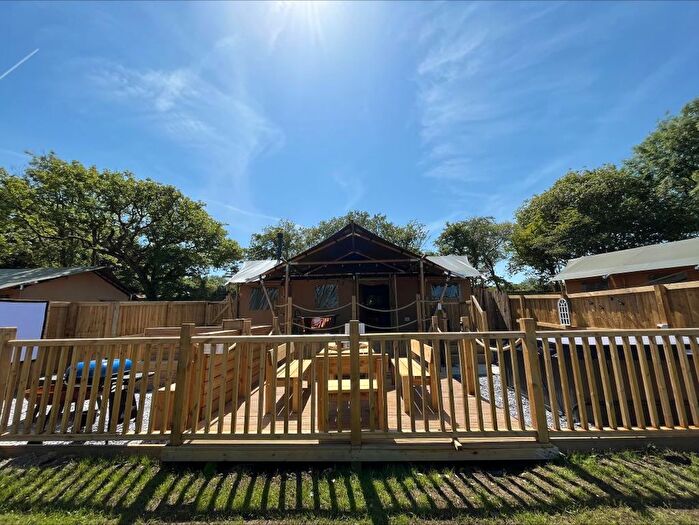
![]()
If you are looking to sell your house, let it out, or receive a property valuation, an expert can help you.
Click the button below to get started.

Roads and Postcodes in East Williamston
Navigate through our locations to find the location of your next house in East Williamston, Tenby for sale or to rent.
| Streets | Postcodes |
|---|---|
| Church Lane | SA70 8RT |
| Elveston Drive | SA70 8PW |
| Green Meadow Close | SA70 8RZ |
| SA70 8RU SA70 8RX SA70 8GR SA70 8RR SA70 8RS |
Transport near East Williamston

- FAQ
- Price Paid By Year
- Property Type Price
Frequently asked questions about East Williamston
What is the average price for a property for sale in East Williamston?
The average price for a property for sale in East Williamston is £442,857. This amount is 41% higher than the average price in Tenby. There are 114 property listings for sale in East Williamston.
Which train stations are available in or near East Williamston?
Some of the train stations available in or near East Williamston are Saundersfoot, Kilgetty and Tenby.
Property Price Paid in East Williamston by Year
The average sold property price by year was:
| Year | Average Sold Price | Price Change |
Sold Properties
|
|---|---|---|---|
| 2025 | £540,000 | 21% |
1 Property |
| 2023 | £426,666 | 2% |
6 Properties |
| 2022 | £418,200 | 12% |
5 Properties |
| 2021 | £370,000 | 4% |
1 Property |
| 2020 | £354,000 | 21% |
2 Properties |
| 2019 | £280,000 | -17% |
3 Properties |
| 2018 | £327,000 | -8% |
2 Properties |
| 2017 | £352,000 | 22% |
1 Property |
| 2016 | £275,000 | 18% |
1 Property |
| 2015 | £225,000 | 1% |
1 Property |
| 2014 | £223,000 | -48% |
1 Property |
| 2013 | £329,950 | 12% |
1 Property |
| 2012 | £290,000 | 1% |
2 Properties |
| 2011 | £286,250 | -47% |
2 Properties |
| 2010 | £422,000 | 24% |
1 Property |
| 2009 | £320,000 | -33% |
1 Property |
| 2008 | £425,000 | 42% |
1 Property |
| 2007 | £248,500 | 28% |
2 Properties |
| 2006 | £179,750 | -136% |
2 Properties |
| 2005 | £425,000 | 44% |
1 Property |
| 2004 | £240,000 | 24% |
1 Property |
| 2003 | £182,975 | 24% |
6 Properties |
| 2002 | £138,666 | -12% |
3 Properties |
| 2001 | £155,500 | 32% |
2 Properties |
| 2000 | £105,868 | 6% |
8 Properties |
| 1999 | £99,250 | 30% |
2 Properties |
| 1998 | £69,666 | 28% |
3 Properties |
| 1997 | £50,333 | -39% |
3 Properties |
| 1995 | £70,166 | - |
3 Properties |
Property Price per Property Type in East Williamston
Here you can find historic sold price data in order to help with your property search.
The average Property Paid Price for specific property types in the last three years are:
| Property Type | Average Sold Price | Sold Properties |
|---|---|---|
| Detached House | £442,857.00 | 7 Detached Houses |