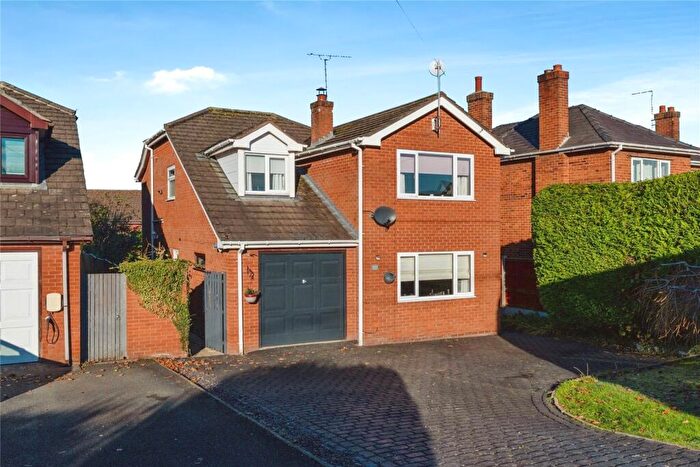
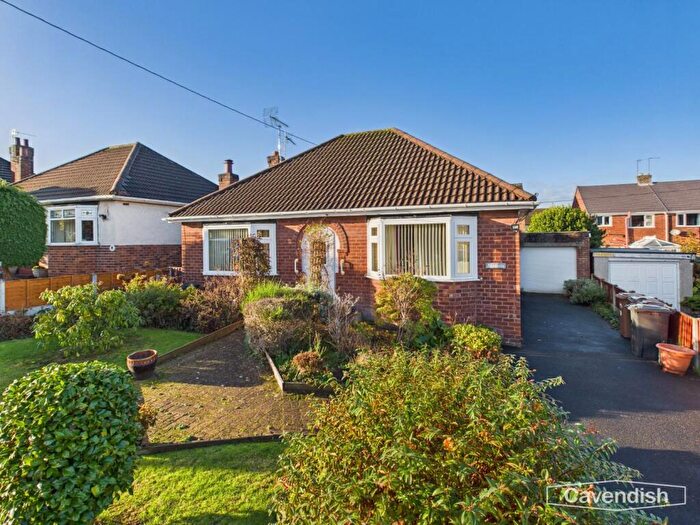
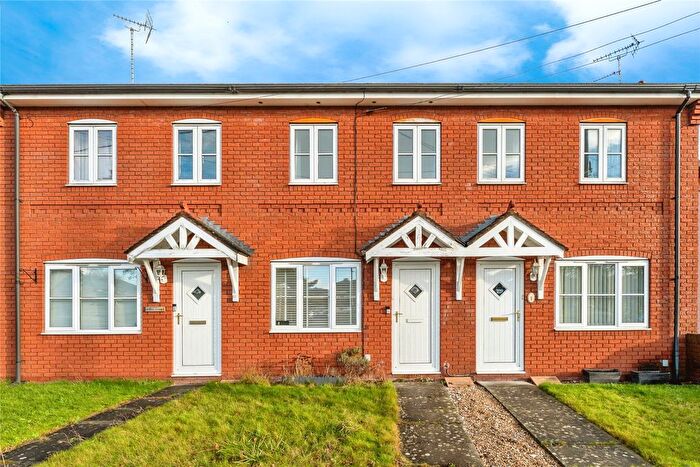
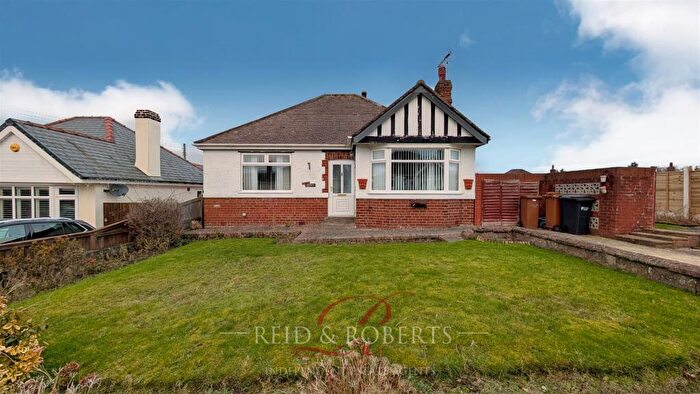
Houses for sale & to rent in Llanarmon-yn-ial/llandegla, Mold
House Prices in Llanarmon-yn-ial/llandegla
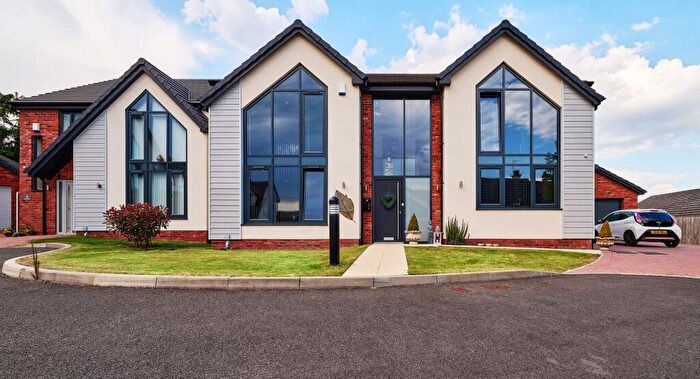
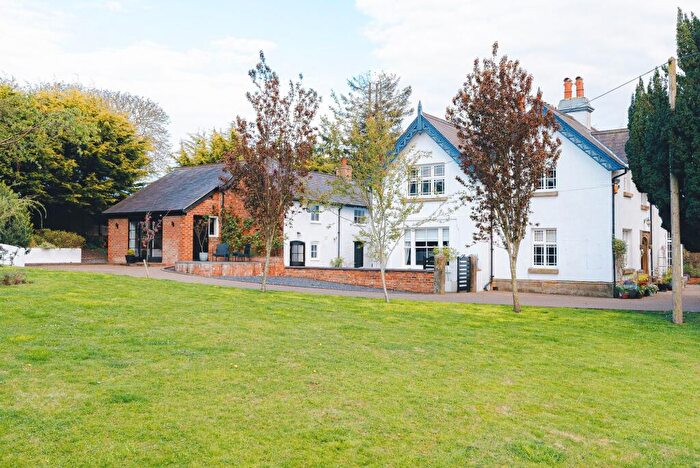
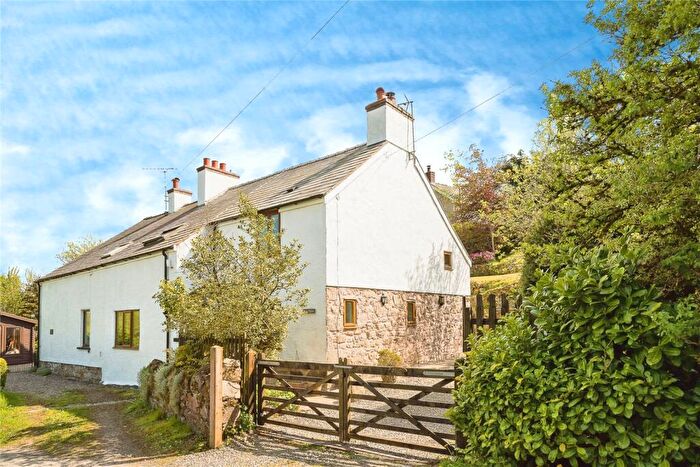
Properties in Llanarmon-yn-ial/llandegla have an average house price of £382,438.00 and had 49 Property Transactions within the last 3 years¹.
Llanarmon-yn-ial/llandegla is an area in Mold, Sir Ddinbych - Denbighshire with 749 households², where the most expensive property was sold for £925,000.00.
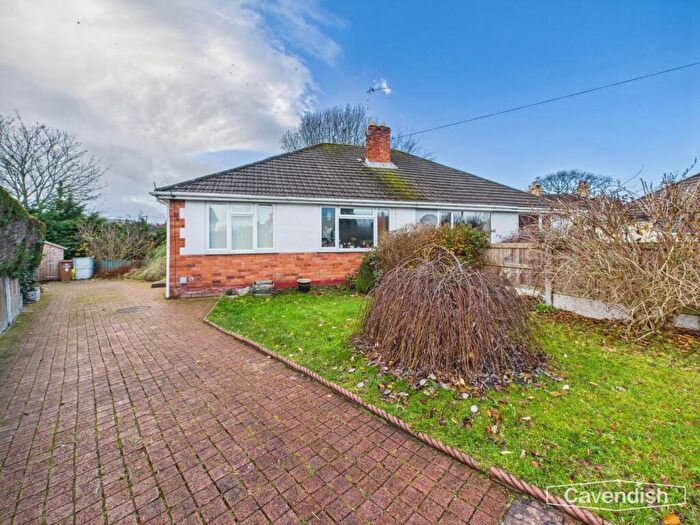
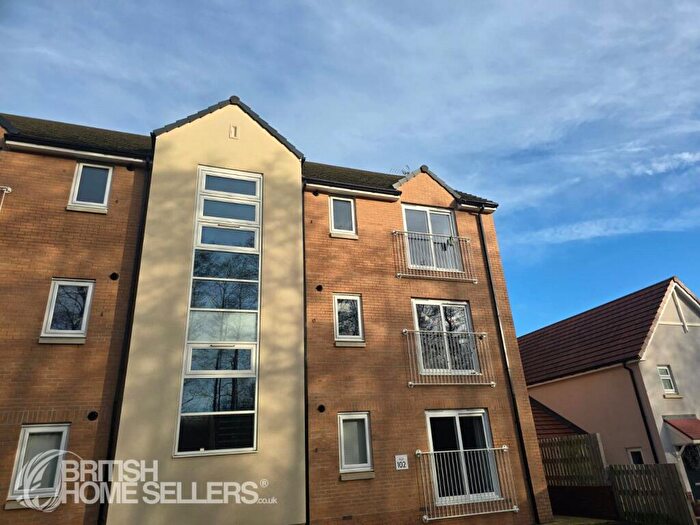
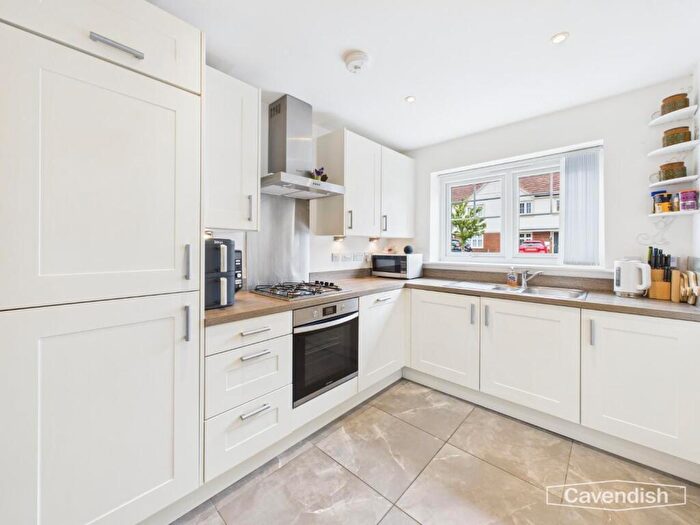
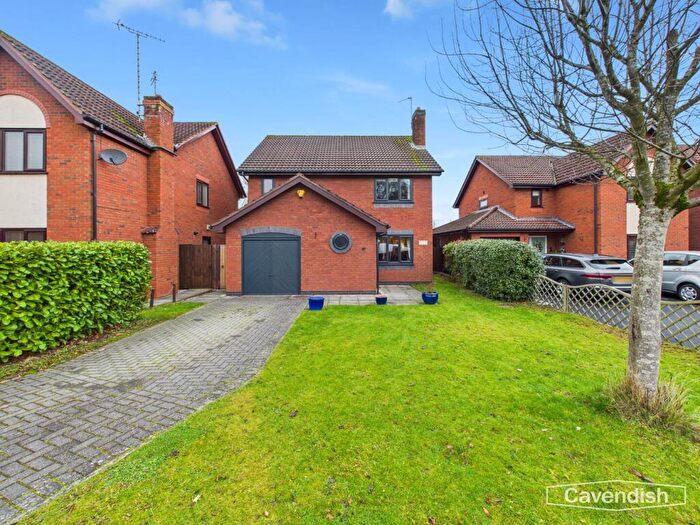
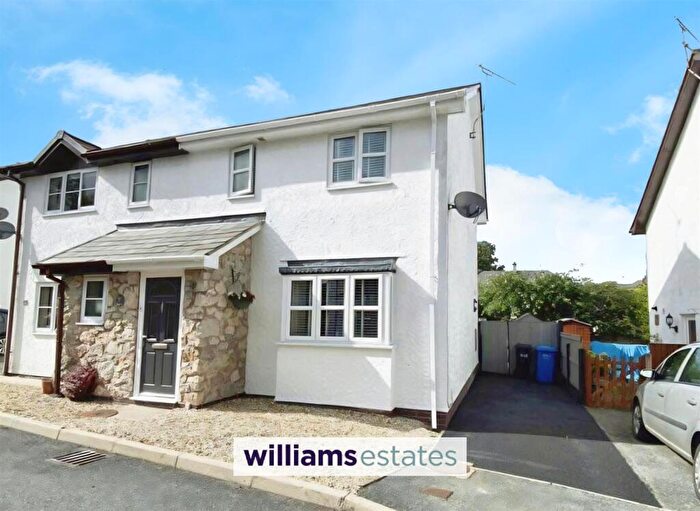
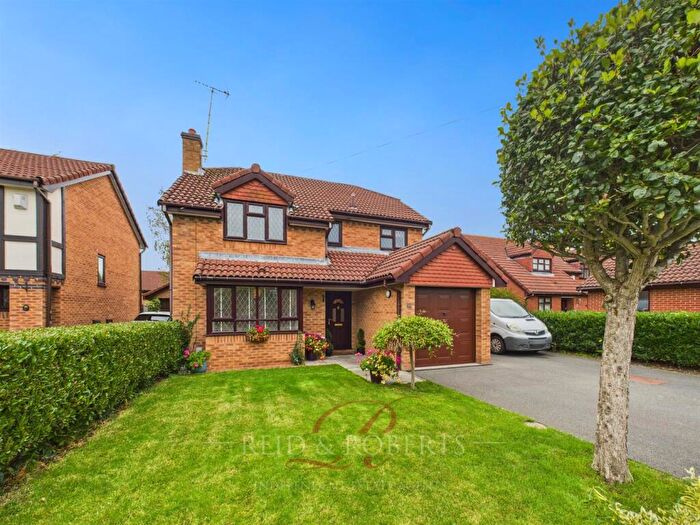
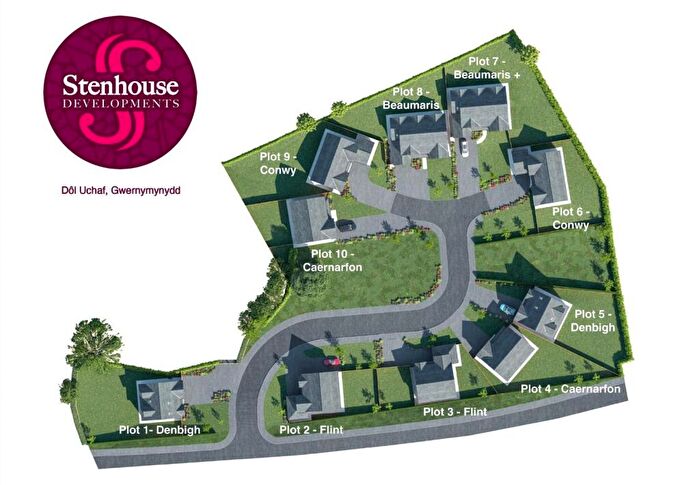
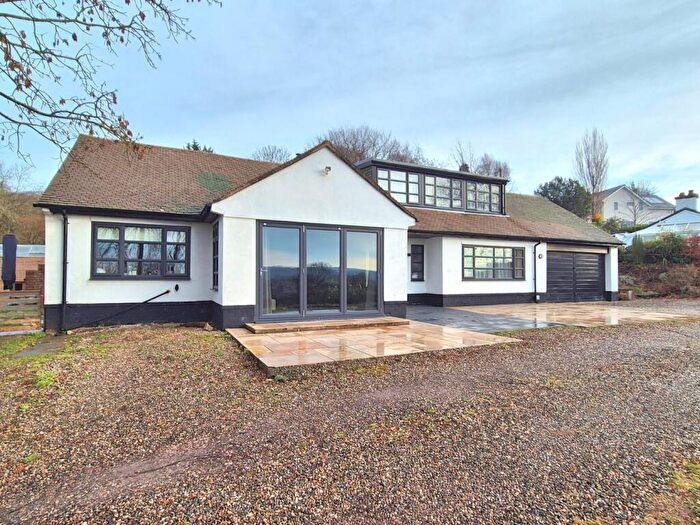
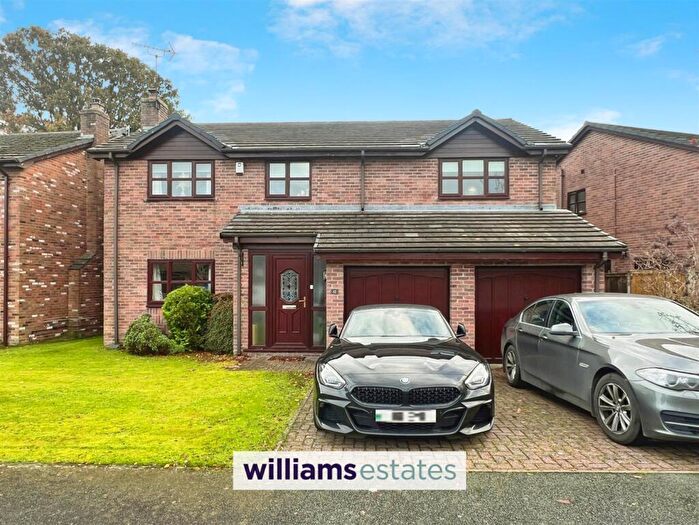
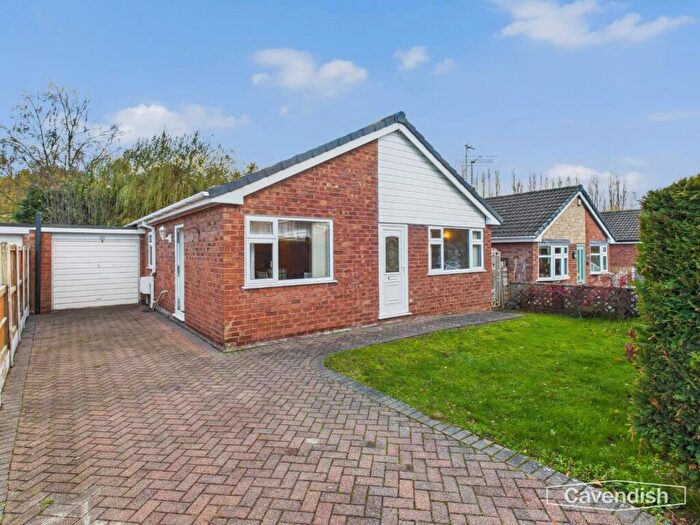
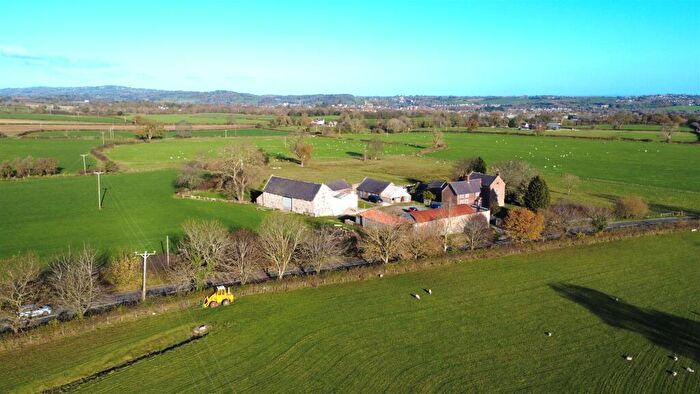
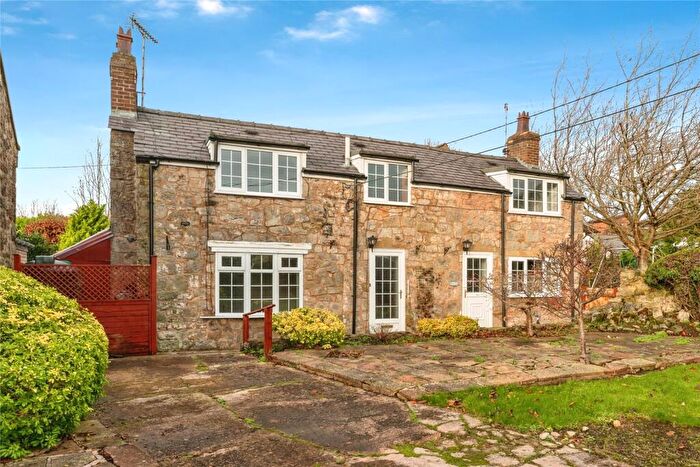
Properties for sale in Llanarmon-yn-ial/llandegla
Roads and Postcodes in Llanarmon-yn-ial/llandegla
Navigate through our locations to find the location of your next house in Llanarmon-yn-ial/llandegla, Mold for sale or to rent.
| Streets | Postcodes |
|---|---|
| Abbeylands | CH7 4QU |
| Abertairnant | CH7 4QT |
| Back Road | CH7 4QD |
| Bryn Artro Avenue | CH7 5SG |
| Bryn Awelon | CH7 4BF |
| Bryn Eithin | CH7 5SJ |
| Cae Derwen | CH7 5SX |
| Cae Gwyn | CH7 5SL |
| Caer Odyn | CH7 4BY |
| Cysgod Y Fron | CH7 5SY |
| Eryrys Road | CH7 4BR CH7 4DB CH7 4BU |
| Ffordd Bryngwyn | CH7 5JX |
| Ffordd Rhiw Ial | CH7 4QE |
| Ffordd Rhyd Y Ceirw | CH7 4BS |
| Forestry Road | CH7 5SH |
| Garmon Court | CH7 4PX |
| Graianrhyd Road | CH7 4QW |
| Horseshoe Pass | LL20 8DR |
| Llanarmon Road | CH7 5TA |
| Llandegla Road | CH7 4QX CH7 4QY |
| Lon Graianrhyd | CH7 4DN |
| Maes Garmon | CH7 4QG |
| Maes Gwyn | CH7 4QP |
| Maes Gynnan | CH7 4PY |
| Maes Ial | CH7 4PZ |
| Maes Llan | CH7 4QQ |
| Maeshafn Road | CH7 5LE |
| Mill Lane | CH7 4QF CH7 4QN |
| Ochr Y Foel | CH7 4BT |
| Old School Lane | CH7 4DA |
| Pant Du Road | CH7 4DD |
| Pant Rhedynog | CH7 5LS |
| Plas Lane | CH7 4QL |
| Rectory Lane | CH7 5SR |
| Rhydtalog Road | CH7 4QS |
| Rock View | CH7 5LT |
| Ruthin Road | CH7 5LH CH7 5SA CH7 5SB CH7 5SN CH7 5LB |
| School Lane | CH7 4TB |
| Tafarn Y Gelyn | CH7 5SE CH7 5SF CH7 5SQ |
| The Nant | CH7 5SS |
| Tyn Llan | CH7 5SP |
| Tyn Y Mynydd Road | CH7 4QH |
| Village Road | CH7 4BX CH7 4BZ CH7 5LR CH7 5LU CH7 5LZ CH7 5LX CH7 5LY |
| CH7 4QJ CH7 4TD CH7 5LD CH7 5LF CH7 5TF CH7 5TG CH7 4DJ CH7 4QR CH7 5LJ CH7 5ST CH7 5TQ |
Transport near Llanarmon-yn-ial/llandegla
-
Penyffordd Station
-
Buckley Station
-
Hope (Clwyd) Station
-
Caergwrle Station
-
Cefn-Y-Bedd Station
-
Gwersyllt Station
-
Hawarden Station
-
Shotton Station
-
Flint Station
-
Wrexham General Station
- FAQ
- Price Paid By Year
- Property Type Price
Frequently asked questions about Llanarmon-yn-ial/llandegla
What is the average price for a property for sale in Llanarmon-yn-ial/llandegla?
The average price for a property for sale in Llanarmon-yn-ial/llandegla is £382,438. There are 759 property listings for sale in Llanarmon-yn-ial/llandegla.
What streets have the most expensive properties for sale in Llanarmon-yn-ial/llandegla?
The streets with the most expensive properties for sale in Llanarmon-yn-ial/llandegla are Llandegla Road at an average of £536,000, Village Road at an average of £517,000 and Mill Lane at an average of £390,400.
What streets have the most affordable properties for sale in Llanarmon-yn-ial/llandegla?
The streets with the most affordable properties for sale in Llanarmon-yn-ial/llandegla are Tyn Llan at an average of £190,000, Ffordd Rhiw Ial at an average of £252,500 and Bryn Artro Avenue at an average of £275,000.
Which train stations are available in or near Llanarmon-yn-ial/llandegla?
Some of the train stations available in or near Llanarmon-yn-ial/llandegla are Penyffordd, Buckley and Hope (Clwyd).
Property Price Paid in Llanarmon-yn-ial/llandegla by Year
The average sold property price by year was:
| Year | Average Sold Price | Price Change |
Sold Properties
|
|---|---|---|---|
| 2025 | £462,250 | 30% |
8 Properties |
| 2024 | £322,300 | -16% |
10 Properties |
| 2023 | £373,045 | -3% |
11 Properties |
| 2022 | £385,750 | 22% |
20 Properties |
| 2021 | £301,105 | 10% |
19 Properties |
| 2020 | £272,234 | 8% |
23 Properties |
| 2019 | £250,625 | 1% |
24 Properties |
| 2018 | £248,210 | -13% |
19 Properties |
| 2017 | £279,488 | 4% |
25 Properties |
| 2016 | £269,463 | 8% |
15 Properties |
| 2015 | £246,937 | -2% |
16 Properties |
| 2014 | £251,568 | 30% |
22 Properties |
| 2013 | £177,147 | -26% |
17 Properties |
| 2012 | £223,533 | 7% |
15 Properties |
| 2011 | £208,777 | -17% |
9 Properties |
| 2010 | £244,730 | 20% |
13 Properties |
| 2009 | £196,730 | -59% |
13 Properties |
| 2008 | £313,363 | 10% |
11 Properties |
| 2007 | £281,580 | 20% |
22 Properties |
| 2006 | £225,636 | 16% |
18 Properties |
| 2005 | £189,463 | 13% |
15 Properties |
| 2004 | £165,740 | 12% |
16 Properties |
| 2003 | £146,082 | -12% |
29 Properties |
| 2002 | £163,240 | 36% |
32 Properties |
| 2001 | £104,147 | 0,2% |
22 Properties |
| 2000 | £103,960 | 15% |
30 Properties |
| 1999 | £88,018 | -5% |
19 Properties |
| 1998 | £92,290 | 9% |
25 Properties |
| 1997 | £84,322 | 15% |
19 Properties |
| 1996 | £71,678 | 10% |
26 Properties |
| 1995 | £64,447 | - |
23 Properties |
Property Price per Property Type in Llanarmon-yn-ial/llandegla
Here you can find historic sold price data in order to help with your property search.
The average Property Paid Price for specific property types in the last three years are:
| Property Type | Average Sold Price | Sold Properties |
|---|---|---|
| Semi Detached House | £202,600.00 | 5 Semi Detached Houses |
| Detached House | £454,205.00 | 34 Detached Houses |
| Terraced House | £228,350.00 | 10 Terraced Houses |

