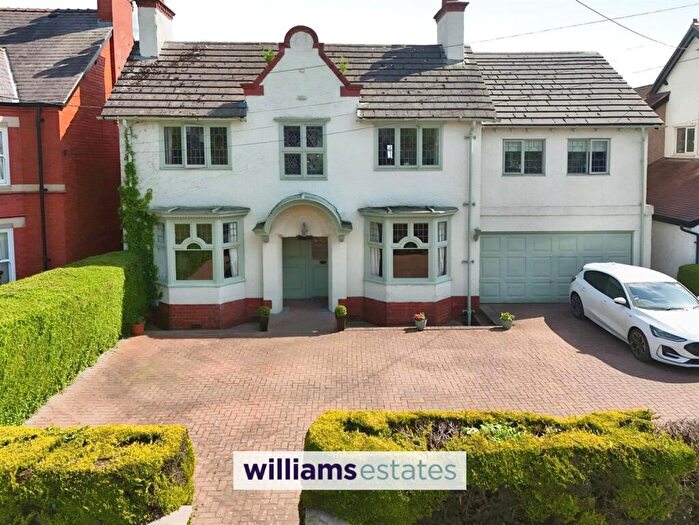
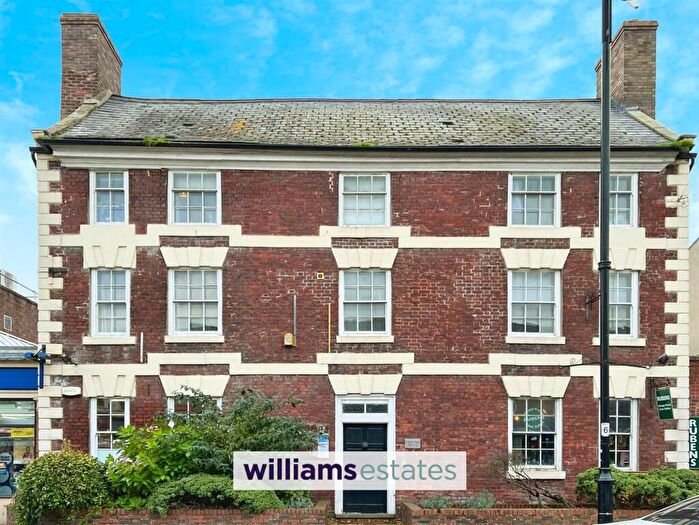
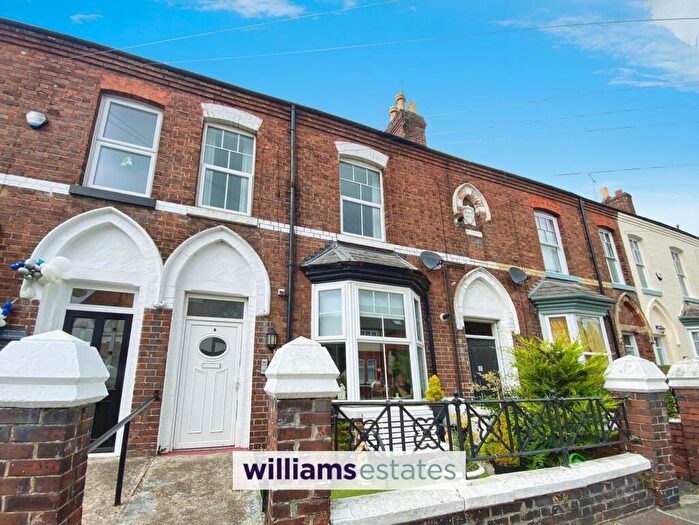
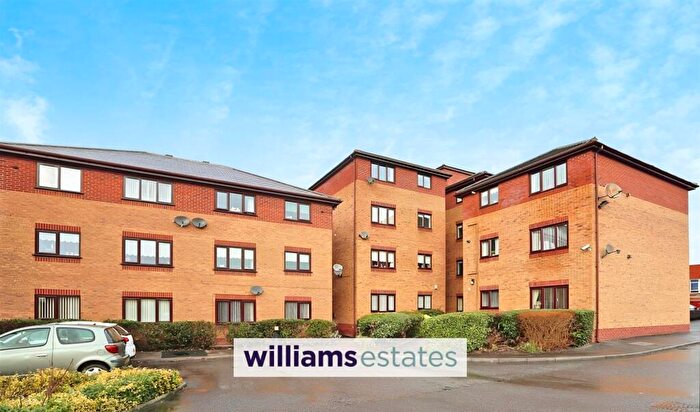
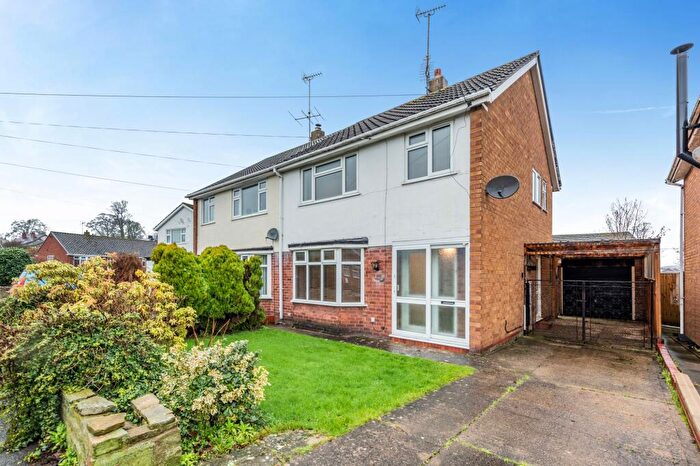
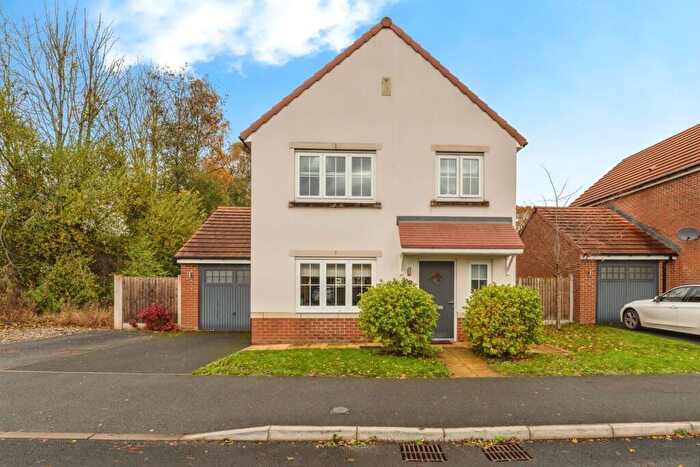
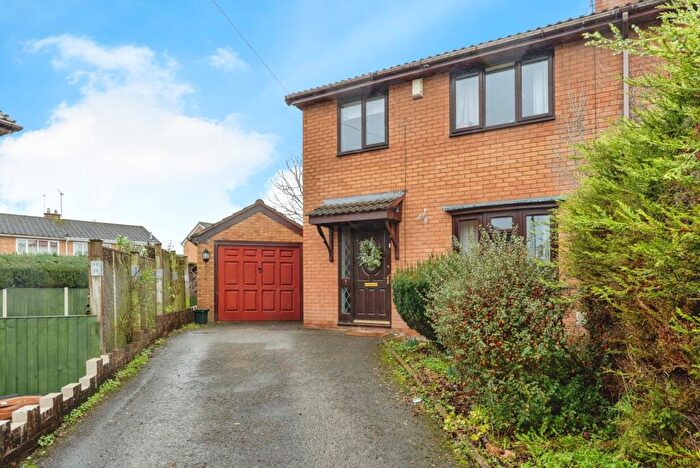
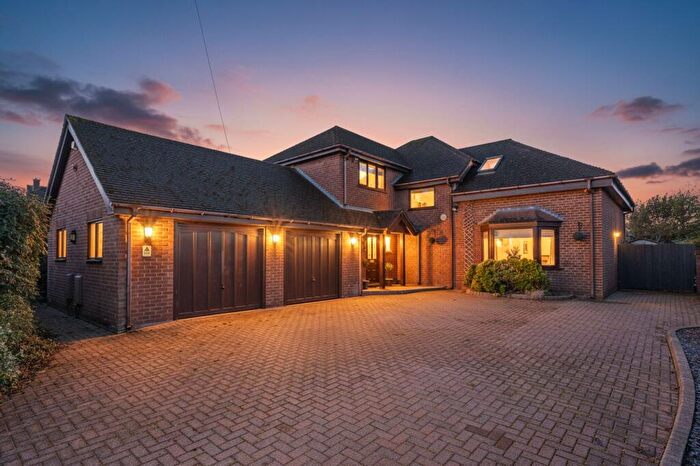
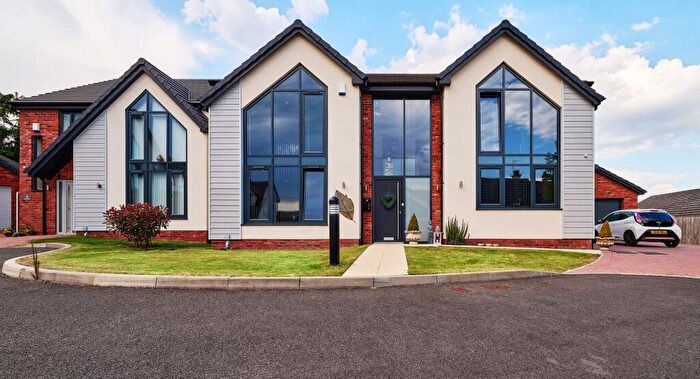
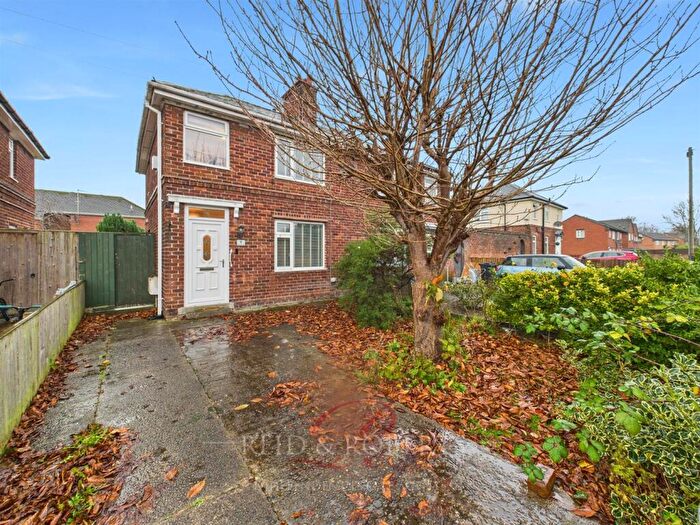
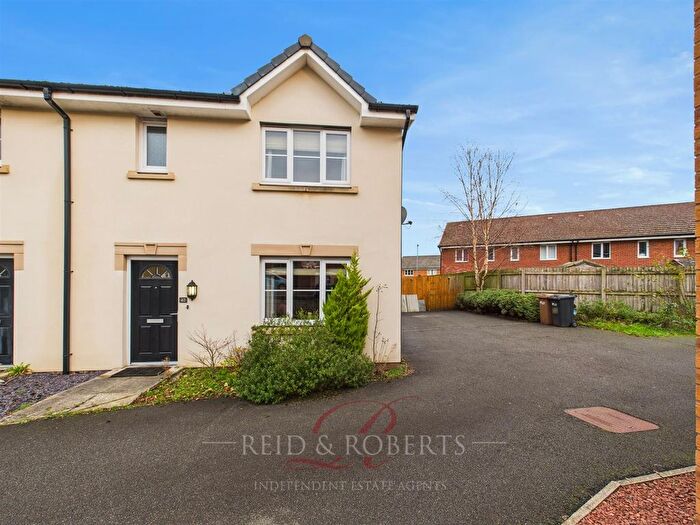
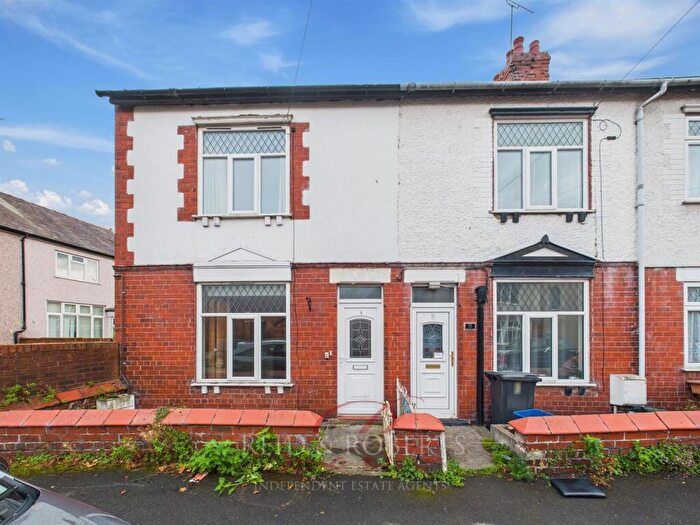
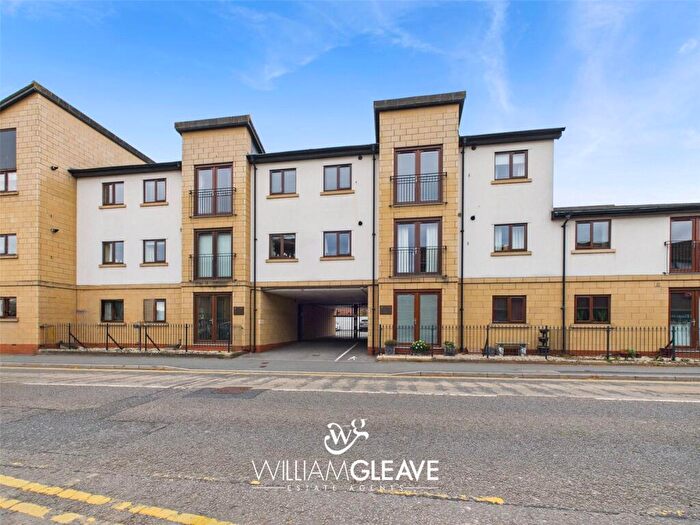
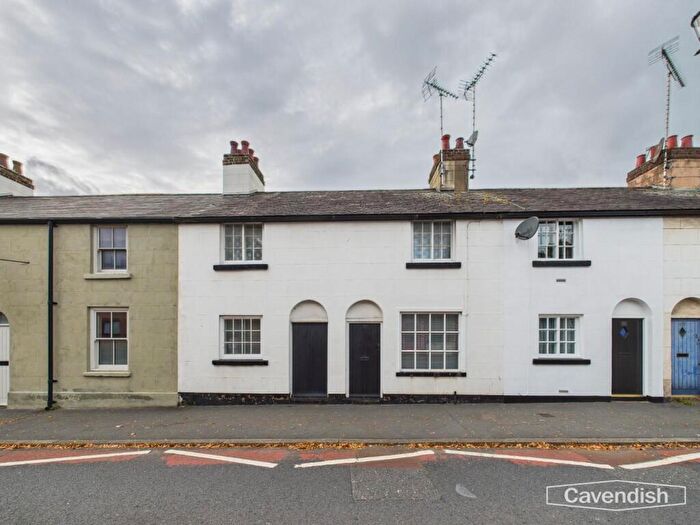
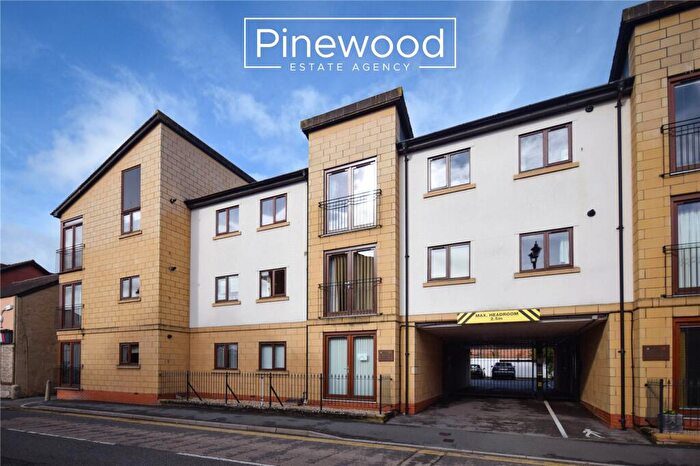
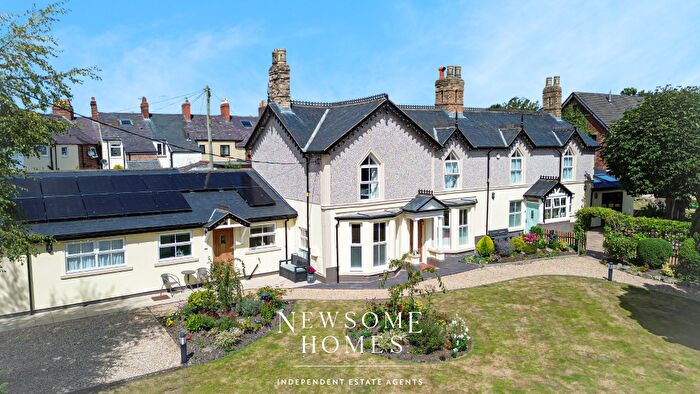
Houses for sale & to rent in Mold South, Mold
House Prices in Mold South
Properties in Mold South have an average house price of £275,492.00 and had 98 Property Transactions within the last 3 years¹.
Mold South is an area in Mold, Sir y Fflint - Flintshire with 1,013 households², where the most expensive property was sold for £575,000.00.
Properties for sale in Mold South
Roads and Postcodes in Mold South
Navigate through our locations to find the location of your next house in Mold South, Mold for sale or to rent.
| Streets | Postcodes |
|---|---|
| Ael Y Bryn | CH7 1GB |
| Bryn Coch Crescent | CH7 1PY |
| Bryn Heulog | CH7 1TS |
| Cae Glas | CH7 1GY |
| Cae Hir | CH7 1TZ |
| Chestnut Road | CH7 1QU |
| Cilnant | CH7 1GG |
| Clayton Court | CH7 1TW |
| Clayton Road | CH7 1SX |
| Ddol Awel | CH7 1TU |
| Ffordd Bryn Estyn | CH7 1TJ |
| Ffordd Dolgoed | CH7 1PE |
| Ffordd Glyn | CH7 1GZ |
| Ffordd Hengoed | CH7 1QD |
| Ffordd Newydd | CH7 1GX |
| Ffordd Trem Y Foel | CH7 1NG |
| Ffordd Tywod | CH7 1FA |
| Glyn Teg | CH7 1XH |
| Greenside | CH7 1TN |
| Hafan Deg | CH7 1YX |
| Hafod Park | CH7 1QN CH7 1QP CH7 1QW |
| Hendy Road | CH7 1QR CH7 1QS CH7 1PZ |
| Linden Drive | CH7 1QT |
| Llwyn Bach | CH7 1GW |
| Llwyn Eithin | CH7 1EH |
| Llys Ambrose | CH7 1GU |
| Llys Menden | CH7 1GF |
| Llys Tudela | CH7 1GE |
| Llys Y Fron | CH7 1QZ |
| Lon Cae Del | CH7 1QX |
| Lon Y Berth | CH7 1QY |
| Maes Glas | CH7 1FP |
| Maes Yr Haf | CH7 1TR |
| Maes Yr Haul | CH7 1NS |
| Moel Ganol | CH7 1TY |
| Mold Business Park | CH7 1XN CH7 1XW |
| Nant Derw | CH7 1TX |
| Nant Y Coed | CH7 1NX |
| Parc Hendy | CH7 1TH CH7 1TT |
| Parc Plas Aney | CH7 1NN |
| Penybryn | CH7 1TL |
| Rhodfa Cilcain | CH7 1GR |
| Rhodfa Mynydd | CH7 1GQ |
| Ruthin Road | CH7 1QH |
| Sandy Grove | CH7 1QB |
| Swn Y Nant | CH7 1XL |
| Tan Y Graig | CH7 1QE |
| The Bowling Green | CH7 1XQ |
| The Close | CH7 1QA |
| Upper Bryn Coch | CH7 1PU CH7 1PX CH7 4AE |
| Y Dolydd | CH7 1GH |
| Y Gilfach | CH7 1XJ |
| CH7 1FJ CH7 1FZ |
Transport near Mold South
-
Buckley Station
-
Penyffordd Station
-
Hawarden Station
-
Hope (Clwyd) Station
-
Shotton Station
-
Flint Station
-
Caergwrle Station
-
Hawarden Bridge Station
-
Cefn-Y-Bedd Station
-
Gwersyllt Station
- FAQ
- Price Paid By Year
- Property Type Price
Frequently asked questions about Mold South
What is the average price for a property for sale in Mold South?
The average price for a property for sale in Mold South is £275,492. This amount is 12% higher than the average price in Mold. There are 300 property listings for sale in Mold South.
What streets have the most expensive properties for sale in Mold South?
The streets with the most expensive properties for sale in Mold South are Parc Plas Aney at an average of £575,000, Swn Y Nant at an average of £445,000 and Ffordd Newydd at an average of £404,361.
What streets have the most affordable properties for sale in Mold South?
The streets with the most affordable properties for sale in Mold South are Cilnant at an average of £193,333, The Bowling Green at an average of £195,000 and Nant Derw at an average of £195,000.
Which train stations are available in or near Mold South?
Some of the train stations available in or near Mold South are Buckley, Penyffordd and Hawarden.
Property Price Paid in Mold South by Year
The average sold property price by year was:
| Year | Average Sold Price | Price Change |
Sold Properties
|
|---|---|---|---|
| 2025 | £300,153 | 12% |
26 Properties |
| 2024 | £262,635 | -3% |
37 Properties |
| 2023 | £270,763 | 1% |
35 Properties |
| 2022 | £268,152 | 4% |
56 Properties |
| 2021 | £257,890 | -2% |
63 Properties |
| 2020 | £262,840 | 9% |
55 Properties |
| 2019 | £238,227 | 5% |
45 Properties |
| 2018 | £226,415 | 1% |
35 Properties |
| 2017 | £224,943 | 10% |
38 Properties |
| 2016 | £201,757 | -27% |
50 Properties |
| 2015 | £256,324 | 19% |
52 Properties |
| 2014 | £206,656 | 3% |
32 Properties |
| 2013 | £200,396 | -4% |
52 Properties |
| 2012 | £207,631 | -7% |
48 Properties |
| 2011 | £222,592 | 7% |
21 Properties |
| 2010 | £207,657 | -4% |
19 Properties |
| 2009 | £216,290 | -14% |
31 Properties |
| 2008 | £246,730 | 4% |
13 Properties |
| 2007 | £237,375 | 12% |
32 Properties |
| 2006 | £210,052 | 4% |
40 Properties |
| 2005 | £201,925 | 10% |
46 Properties |
| 2004 | £181,760 | 13% |
43 Properties |
| 2003 | £157,720 | 18% |
41 Properties |
| 2002 | £128,828 | 8% |
58 Properties |
| 2001 | £118,224 | 10% |
50 Properties |
| 2000 | £105,893 | 8% |
68 Properties |
| 1999 | £97,390 | 5% |
56 Properties |
| 1998 | £92,942 | 9% |
74 Properties |
| 1997 | £84,918 | 13% |
78 Properties |
| 1996 | £73,581 | -9% |
51 Properties |
| 1995 | £80,513 | - |
34 Properties |
Property Price per Property Type in Mold South
Here you can find historic sold price data in order to help with your property search.
The average Property Paid Price for specific property types in the last three years are:
| Property Type | Average Sold Price | Sold Properties |
|---|---|---|
| Semi Detached House | £209,856.00 | 45 Semi Detached Houses |
| Detached House | £343,897.00 | 47 Detached Houses |
| Terraced House | £382,500.00 | 2 Terraced Houses |
| Flat | £156,625.00 | 4 Flats |

