
Houses for sale & to rent in Rhyl, Sir Ddinbych - Denbighshire
House Prices in Rhyl
Properties in Rhyl have an average house price of £184k and had 1,443 Property Transactions within the last 3 years.¹
Rhyl is an area in Sir Ddinbych - Denbighshire with 14,671 households², where the most expensive property was sold for £630k.
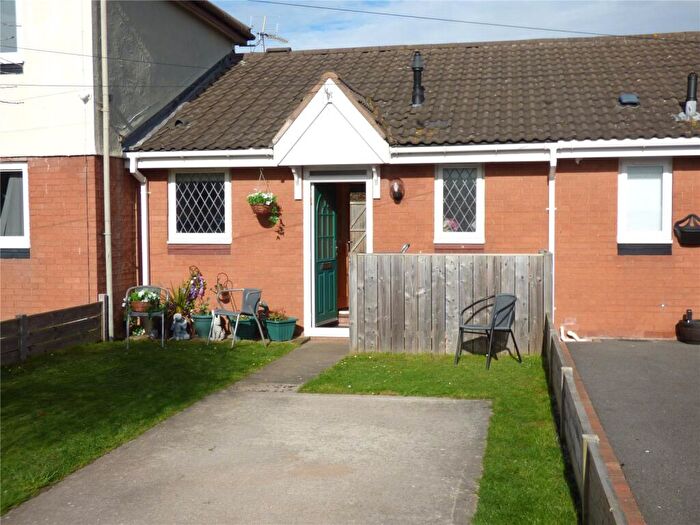
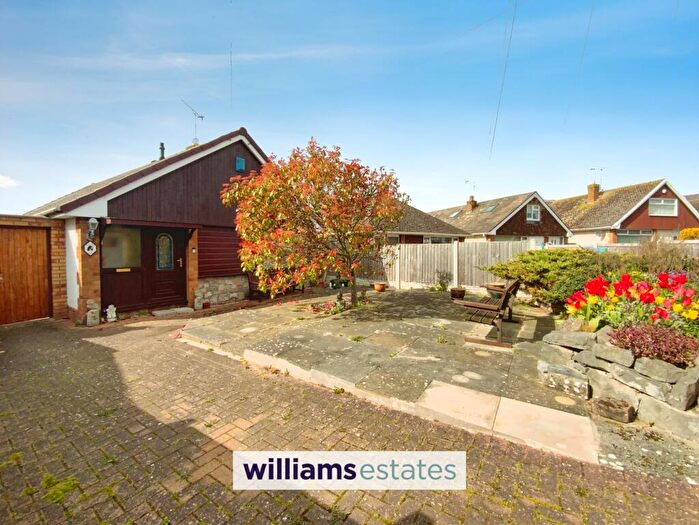
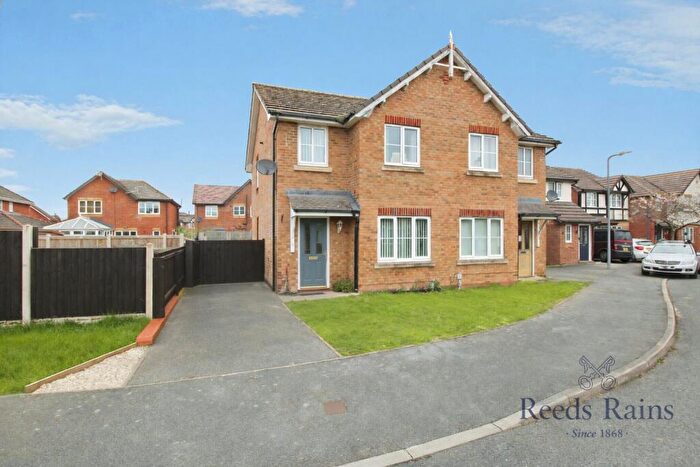
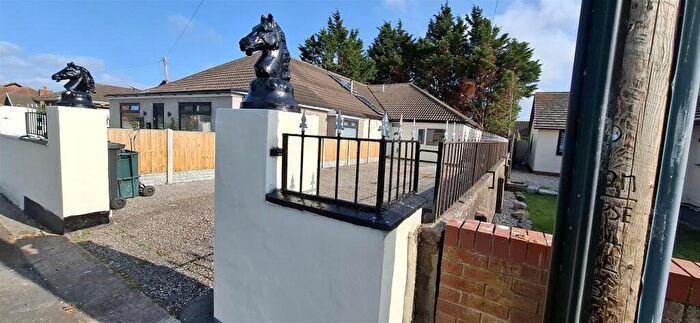
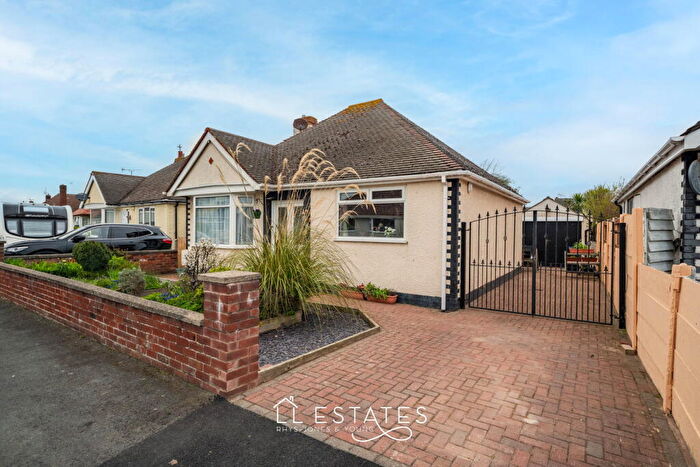
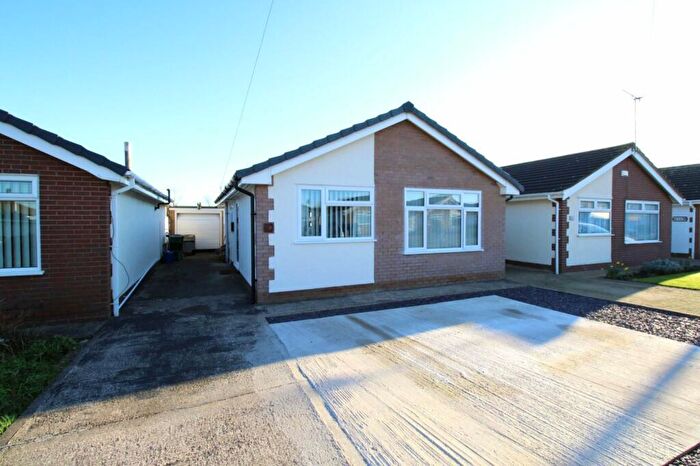
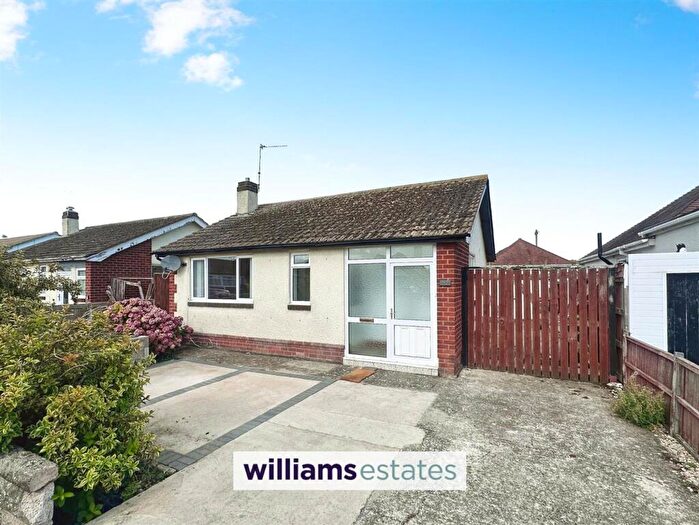
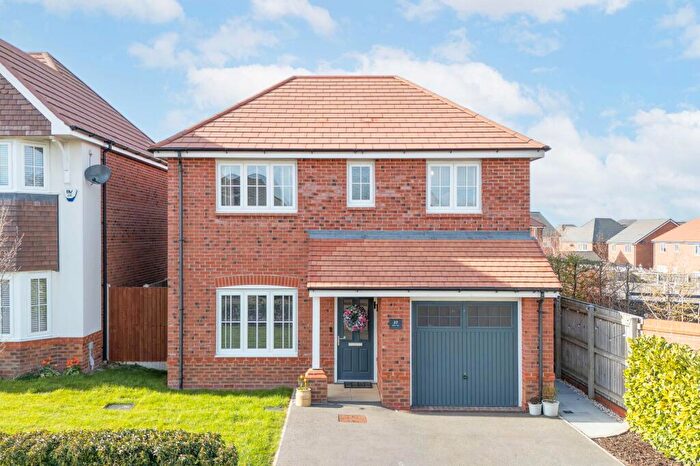
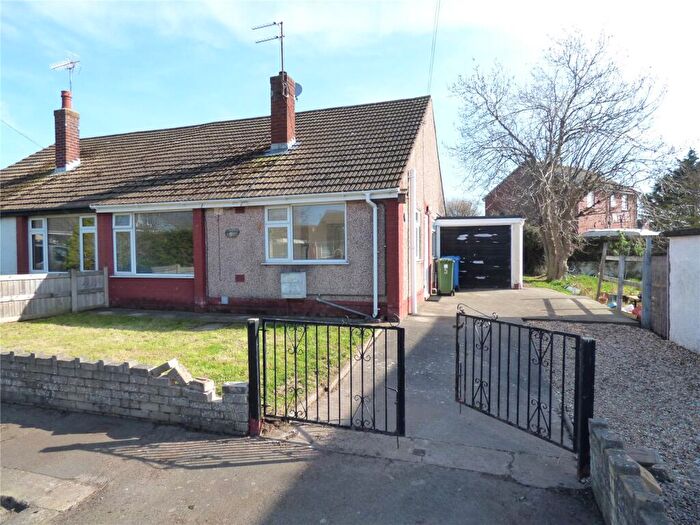
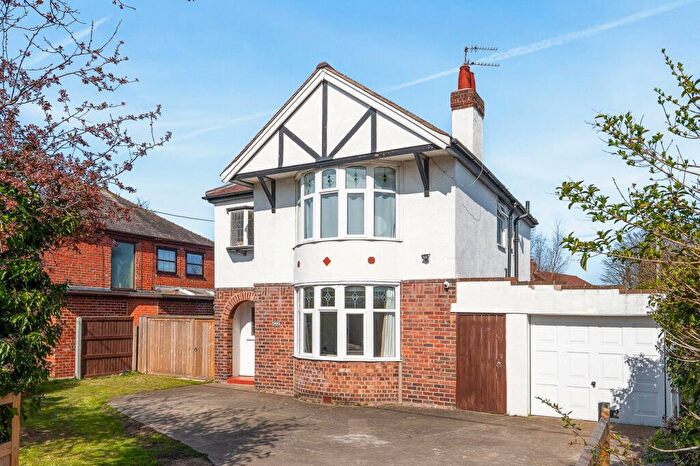
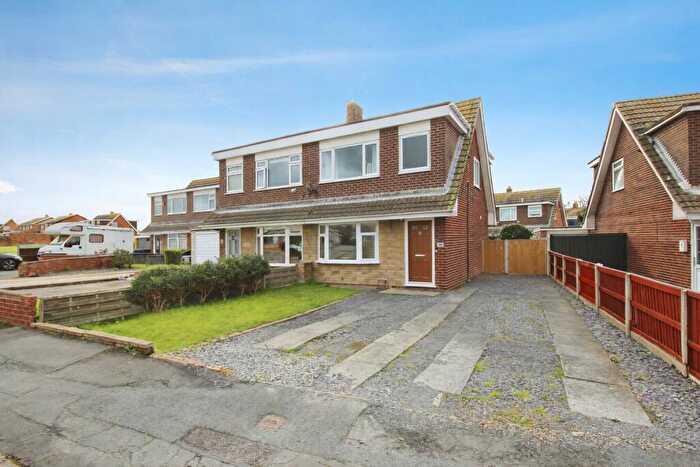
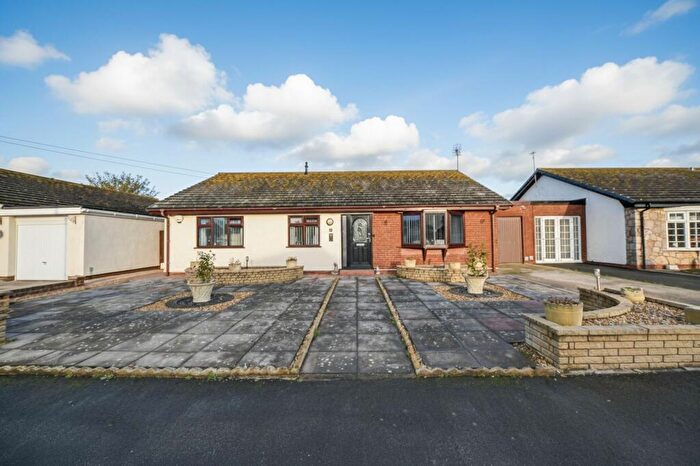
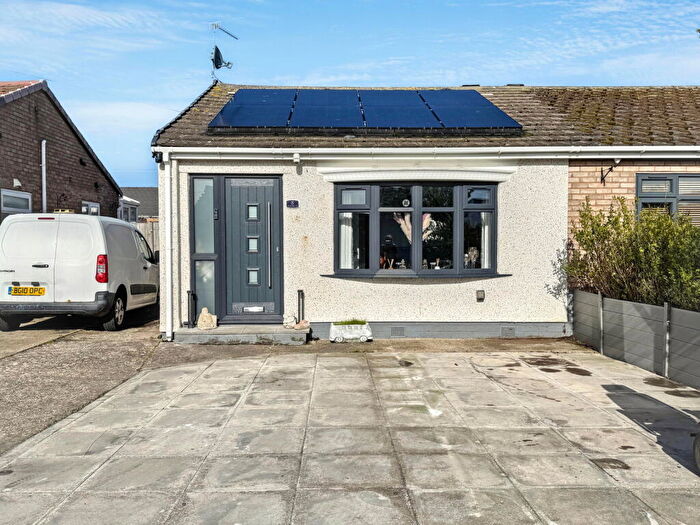
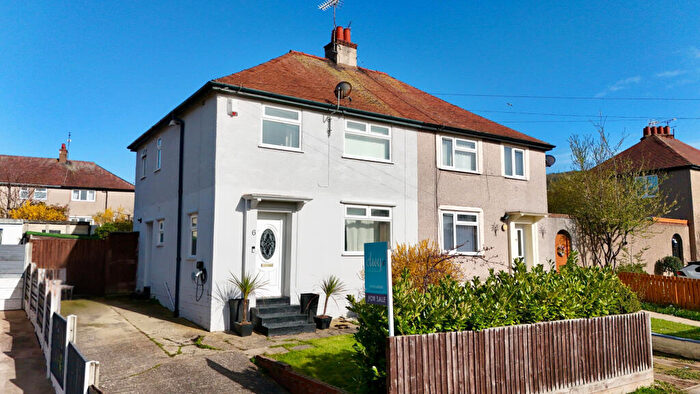
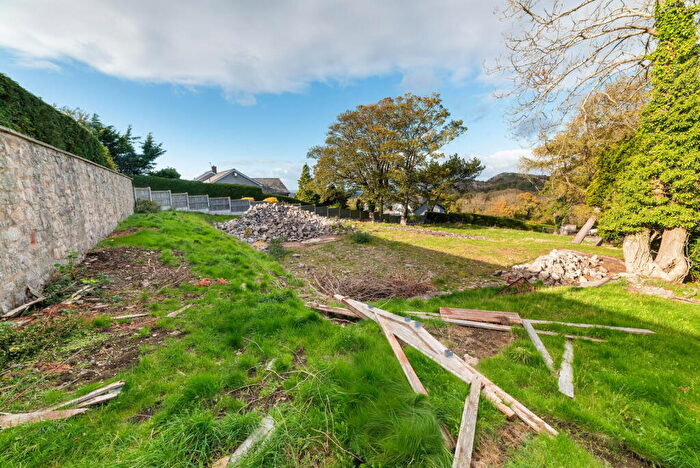
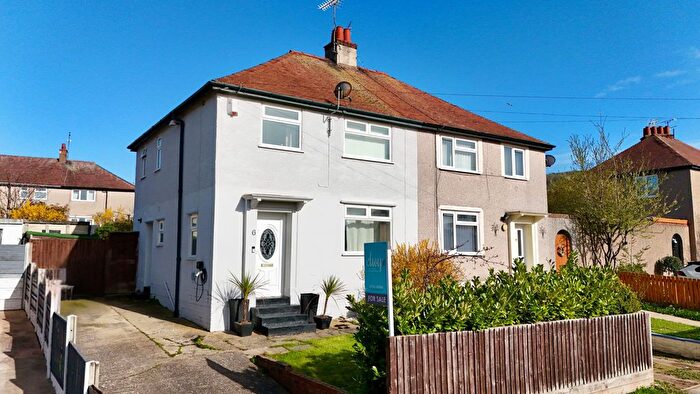
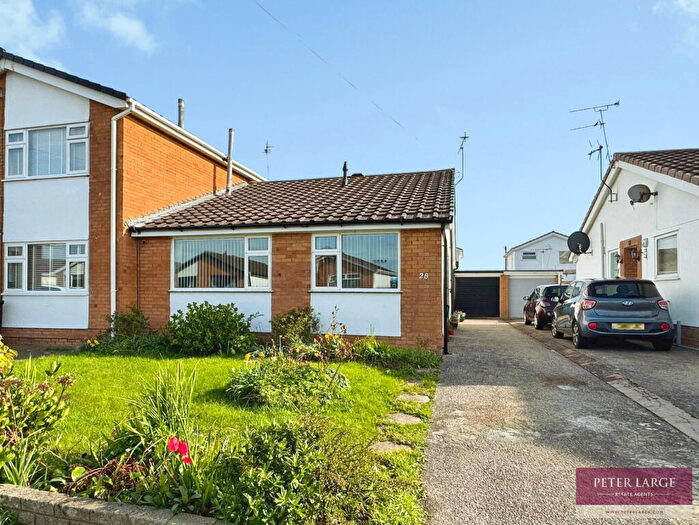
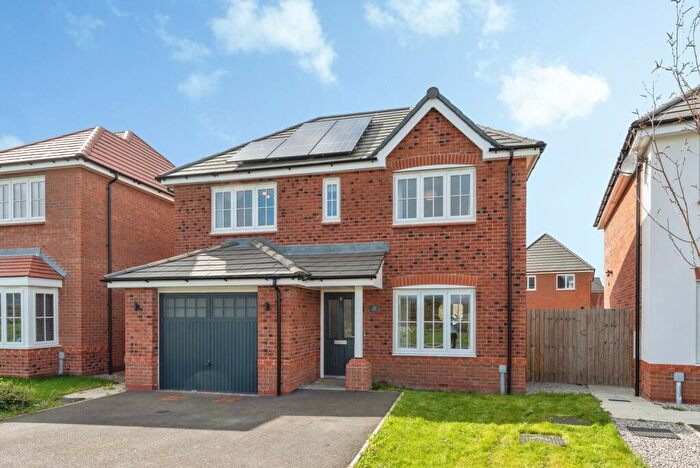
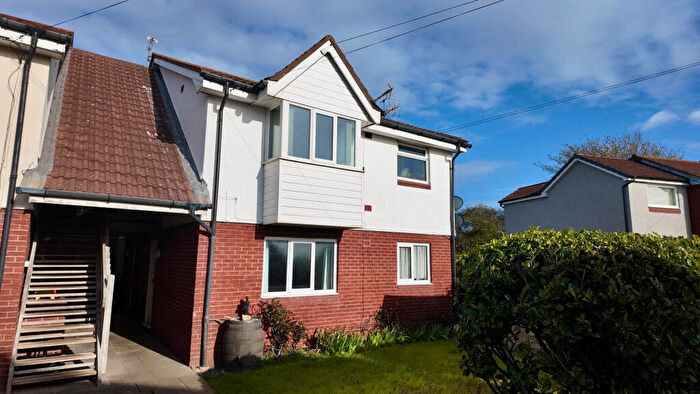
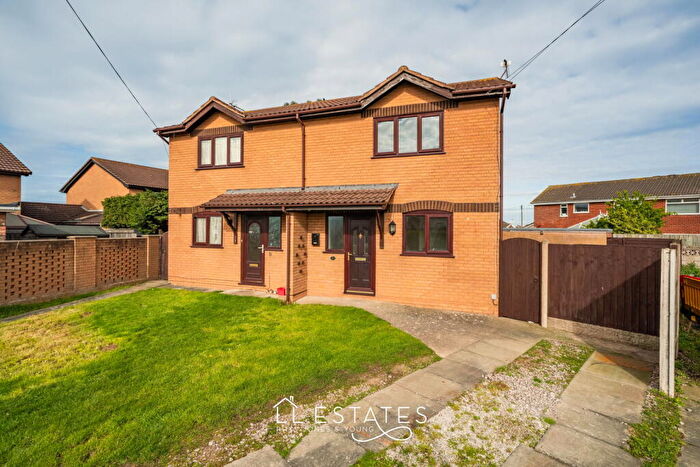
Properties for sale in Rhyl

![]()
If you are looking to sell your house, let it out, or receive a property valuation, an expert can help you.
Click the button below to get started.


Neighbourhoods in Rhyl
Navigate through our locations to find the location of your next house in Rhyl, Sir Ddinbych - Denbighshire for sale or to rent.
Transport in Rhyl
Please see below transportation links in this area:

- FAQ
- Price Paid By Year
- Property Type Price
Frequently asked questions about Rhyl
What is the average price for a property for sale in Rhyl?
The average price for a property for sale in Rhyl is £183,543. This amount is 13% lower than the average price in Sir Ddinbych - Denbighshire. There are 3,618 property listings for sale in Rhyl.
What locations have the most expensive properties for sale in Rhyl?
The locations with the most expensive properties for sale in Rhyl are Tremeirchion at an average of £292,500, Dyserth at an average of £244,661 and Rhuddlan at an average of £223,548.
What locations have the most affordable properties for sale in Rhyl?
The locations with the most affordable properties for sale in Rhyl are Rhyl West at an average of £127,734, Rhyl South West at an average of £146,049 and Rhyl South East at an average of £180,799.
Which train stations are available in or near Rhyl?
Some of the train stations available in or near Rhyl are Rhyl, Prestatyn and Abergele and Pensarn.
Property Price Paid in Rhyl by Year
The average sold property price by year was:
| Year | Average Sold Price | Price Change |
Sold Properties
|
|---|---|---|---|
| 2026 | £182,950 | -5% |
10 Properties |
| 2025 | £191,373 | 5% |
433 Properties |
| 2024 | £181,863 | 2% |
497 Properties |
| 2023 | £178,474 | -2% |
503 Properties |
| 2022 | £182,469 | 2% |
639 Properties |
| 2021 | £179,325 | 10% |
634 Properties |
| 2020 | £161,062 | 10% |
544 Properties |
| 2019 | £144,176 | 0,1% |
608 Properties |
| 2018 | £143,969 | 7% |
601 Properties |
| 2017 | £133,768 | 2% |
587 Properties |
| 2016 | £131,406 | -0,1% |
529 Properties |
| 2015 | £131,552 | 9% |
499 Properties |
| 2014 | £120,083 | -1% |
533 Properties |
| 2013 | £121,397 | 3% |
413 Properties |
| 2012 | £117,437 | -4% |
355 Properties |
| 2011 | £121,657 | -2% |
362 Properties |
| 2010 | £123,954 | 6% |
383 Properties |
| 2009 | £116,672 | -14% |
320 Properties |
| 2008 | £133,384 | 1% |
391 Properties |
| 2007 | £132,460 | -0,3% |
809 Properties |
| 2006 | £132,923 | 9% |
822 Properties |
| 2005 | £121,146 | 15% |
619 Properties |
| 2004 | £103,197 | 16% |
851 Properties |
| 2003 | £86,229 | 24% |
960 Properties |
| 2002 | £65,779 | 15% |
1,007 Properties |
| 2001 | £55,812 | 6% |
935 Properties |
| 2000 | £52,600 | 8% |
794 Properties |
| 1999 | £48,311 | 4% |
730 Properties |
| 1998 | £46,222 | 2% |
654 Properties |
| 1997 | £45,188 | 2% |
617 Properties |
| 1996 | £44,486 | -2% |
592 Properties |
| 1995 | £45,441 | - |
492 Properties |
Property Price per Property Type in Rhyl
Here you can find historic sold price data in order to help with your property search.
The average Property Paid Price for specific property types in the last three years are:
| Property Type | Average Sold Price | Sold Properties |
|---|---|---|
| Semi Detached House | £173,581.00 | 503 Semi Detached Houses |
| Terraced House | £138,740.00 | 237 Terraced Houses |
| Detached House | £219,208.00 | 623 Detached Houses |
| Flat | £101,165.00 | 80 Flats |