
Houses for sale & to rent in Abergele, Conwy - Conwy
House Prices in Abergele
Properties in Abergele have an average house price of £224k and had 923 Property Transactions within the last 3 years.¹
Abergele is an area in Conwy - Conwy with 8,071 households², where the most expensive property was sold for £935k.
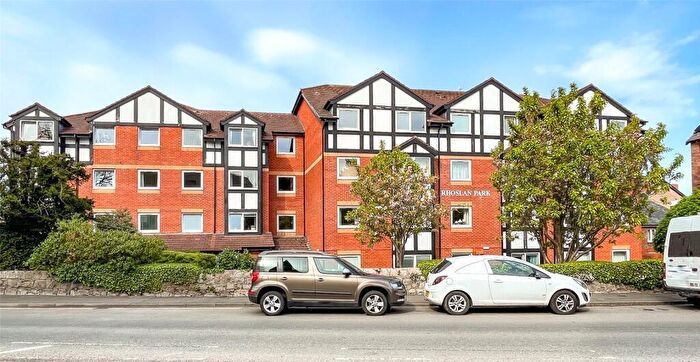
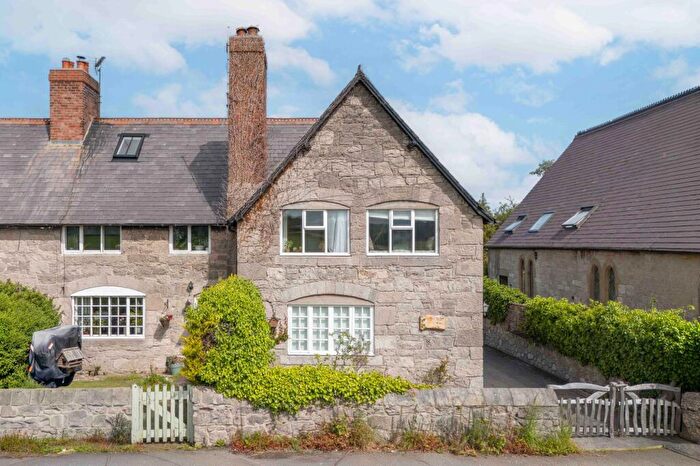
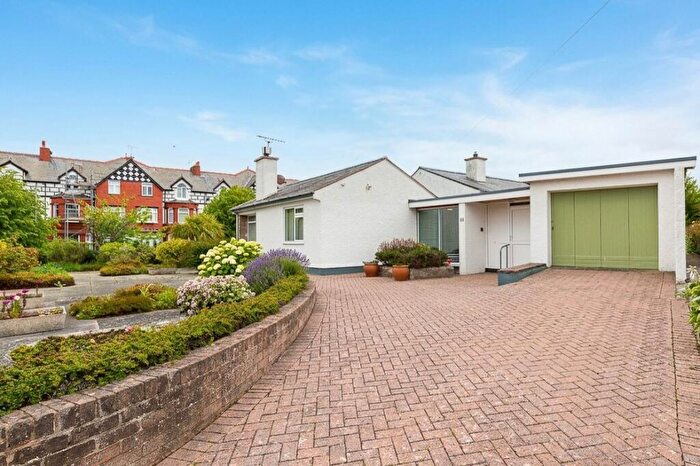
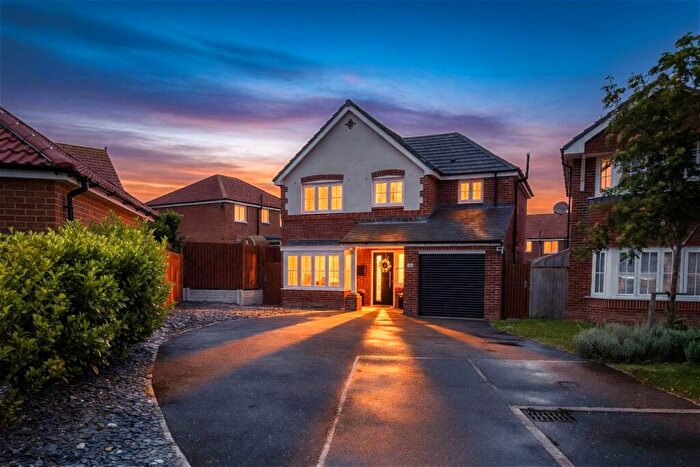
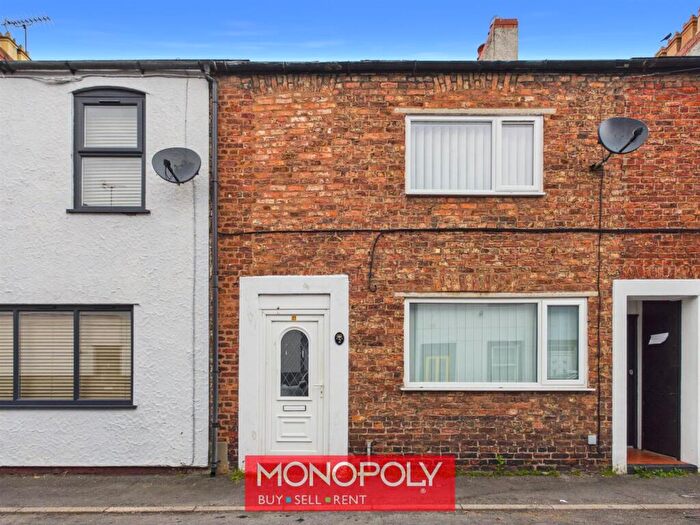
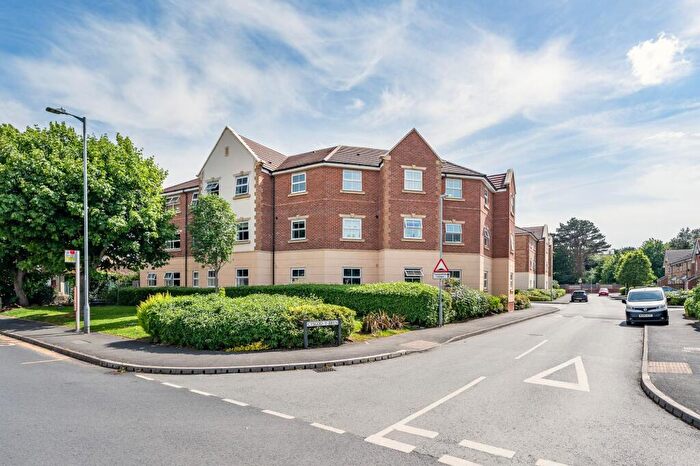
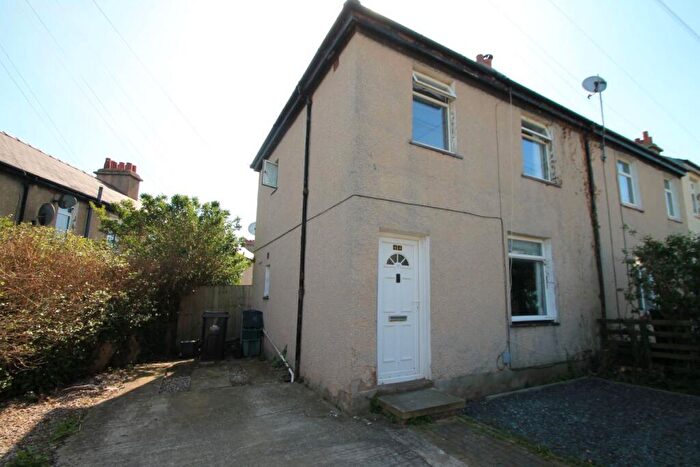
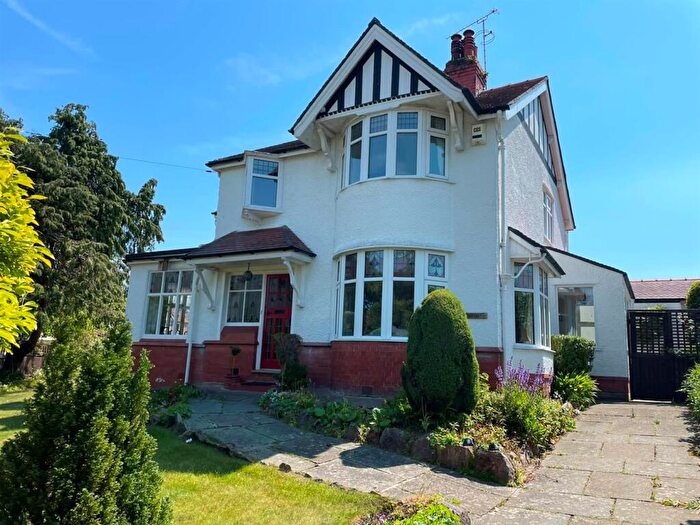
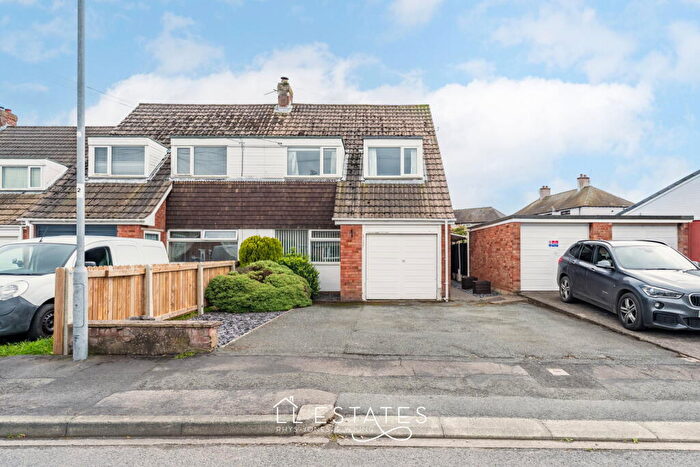
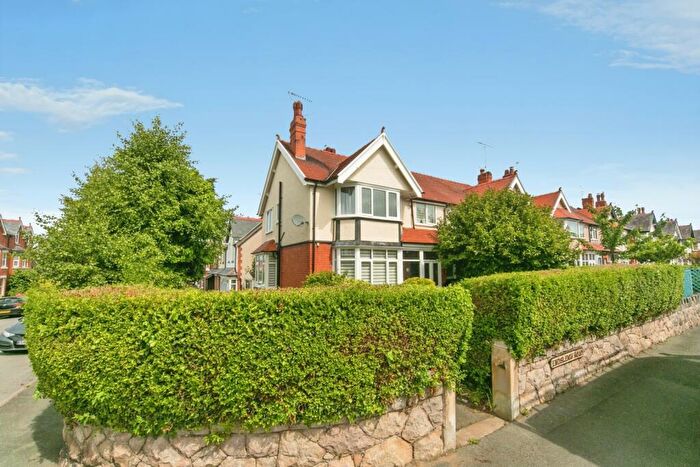
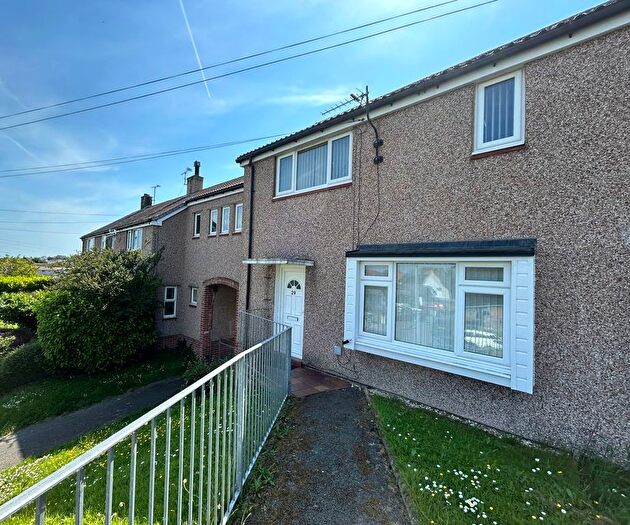
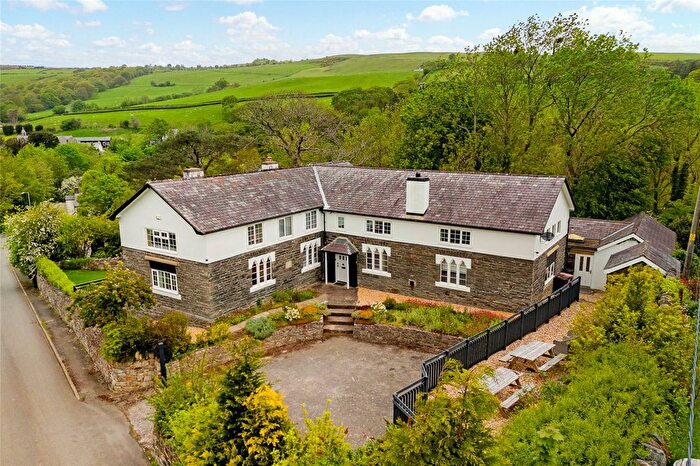
Properties for sale in Abergele
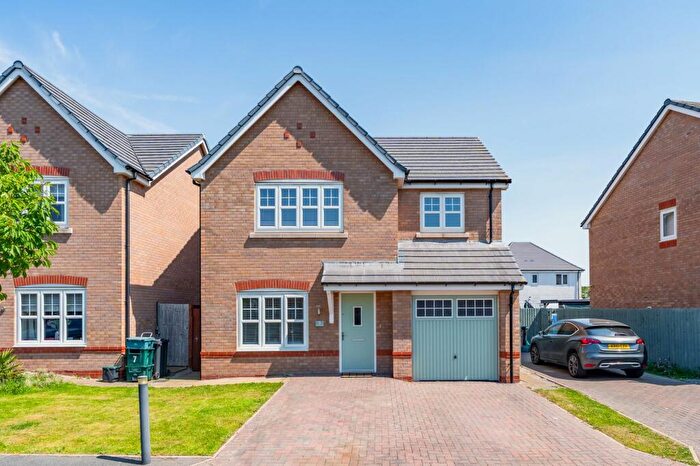
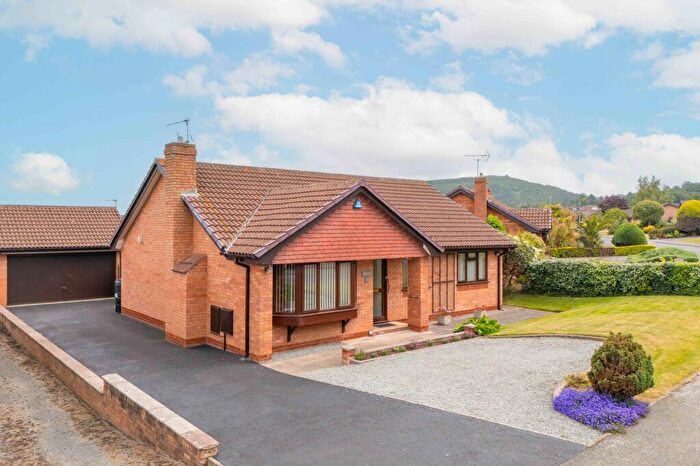
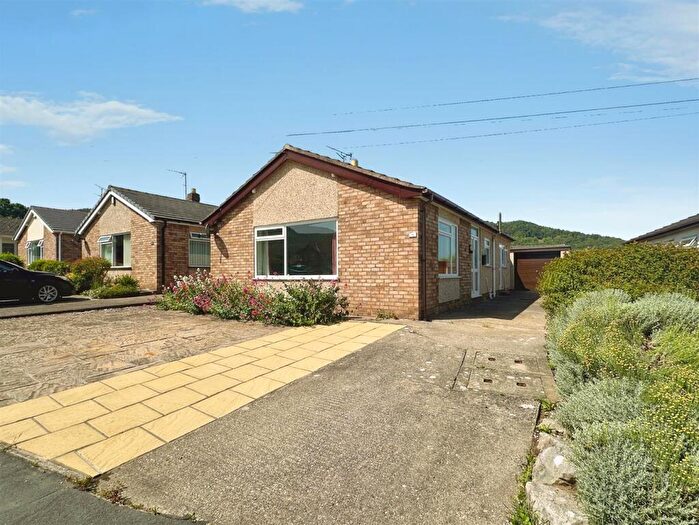
![]()
If you are looking to sell your house, let it out, or receive a property valuation, an expert can help you.
Click the button below to get started.


Neighbourhoods in Abergele
Navigate through our locations to find the location of your next house in Abergele, Conwy - Conwy for sale or to rent.
Transport in Abergele
Please see below transportation links in this area:
-
 Abergele and Pensarn Station
 -
Colwyn Bay Station
-
Rhyl Station
-
Glan Conwy Station
-
Llandudno Junction Station
-
Prestatyn Station
-
Tal-y-Cafn Station
-
Conwy Station
-
Deganwy Station
- FAQ
- Price Paid By Year
- Property Type Price
Frequently asked questions about Abergele
What is the average price for a property for sale in Abergele?
The average price for a property for sale in Abergele is £223,583. This amount is 5% lower than the average price in Conwy - Conwy. There are 5,738 property listings for sale in Abergele.
What locations have the most expensive properties for sale in Abergele?
The locations with the most expensive properties for sale in Abergele are Eglwysbach at an average of £490,000, Llansannan at an average of £320,000 and Betws Yn Rhos at an average of £266,346.
What locations have the most affordable properties for sale in Abergele?
The locations with the most affordable properties for sale in Abergele are Llysfaen at an average of £141,250, Towyn at an average of £177,829 and Abergele Pensarn at an average of £186,659.
Which train stations are available in or near Abergele?
Some of the train stations available in or near Abergele are Abergele and Pensarn, Colwyn Bay and Rhyl.
Property Price Paid in Abergele by Year
The average sold property price by year was:
| Year | Average Sold Price | Price Change |
Sold Properties
|
|---|---|---|---|
| 2026 | £217,606 | -6% |
23 Properties |
| 2025 | £229,914 | 0,3% |
291 Properties |
| 2024 | £229,219 | 8% |
319 Properties |
| 2023 | £211,504 | -6% |
290 Properties |
| 2022 | £224,523 | 7% |
339 Properties |
| 2021 | £209,772 | 9% |
405 Properties |
| 2020 | £190,821 | 6% |
326 Properties |
| 2019 | £178,925 | 6% |
404 Properties |
| 2018 | £168,667 | 1% |
419 Properties |
| 2017 | £167,623 | 9% |
389 Properties |
| 2016 | £151,757 | 5% |
344 Properties |
| 2015 | £144,011 | -1% |
283 Properties |
| 2014 | £145,136 | 6% |
272 Properties |
| 2013 | £136,626 | -4% |
263 Properties |
| 2012 | £141,409 | 3% |
201 Properties |
| 2011 | £137,246 | -10% |
213 Properties |
| 2010 | £151,131 | 9% |
190 Properties |
| 2009 | £137,246 | -16% |
245 Properties |
| 2008 | £158,571 | -5% |
239 Properties |
| 2007 | £166,022 | 8% |
401 Properties |
| 2006 | £153,497 | 5% |
473 Properties |
| 2005 | £146,250 | 9% |
352 Properties |
| 2004 | £132,459 | 22% |
413 Properties |
| 2003 | £103,389 | 16% |
454 Properties |
| 2002 | £86,740 | 21% |
484 Properties |
| 2001 | £68,769 | 8% |
441 Properties |
| 2000 | £63,522 | 4% |
412 Properties |
| 1999 | £60,909 | 5% |
362 Properties |
| 1998 | £57,634 | 10% |
308 Properties |
| 1997 | £52,009 | 4% |
375 Properties |
| 1996 | £50,013 | 1% |
320 Properties |
| 1995 | £49,563 | - |
275 Properties |
Property Price per Property Type in Abergele
Here you can find historic sold price data in order to help with your property search.
The average Property Paid Price for specific property types in the last three years are:
| Property Type | Average Sold Price | Sold Properties |
|---|---|---|
| Semi Detached House | £183,745.00 | 318 Semi Detached Houses |
| Detached House | £281,731.00 | 442 Detached Houses |
| Terraced House | £153,252.00 | 112 Terraced Houses |
| Flat | £122,478.00 | 51 Flats |