
Houses for sale & to rent in LL18 2HS, Poplars Drive, Rhyl South West, Rhyl
House Prices in LL18 2HS, Poplars Drive, Rhyl South West
Properties in LL18 2HS have an average house price of £170,000.00 and had 1 Property Transaction within the last 3 years.¹ LL18 2HS is a postcode in Poplars Drive located in Rhyl South West, an area in Rhyl, Sir Ddinbych - Denbighshire, with 10 households², where the most expensive property was sold for £170,000.00.
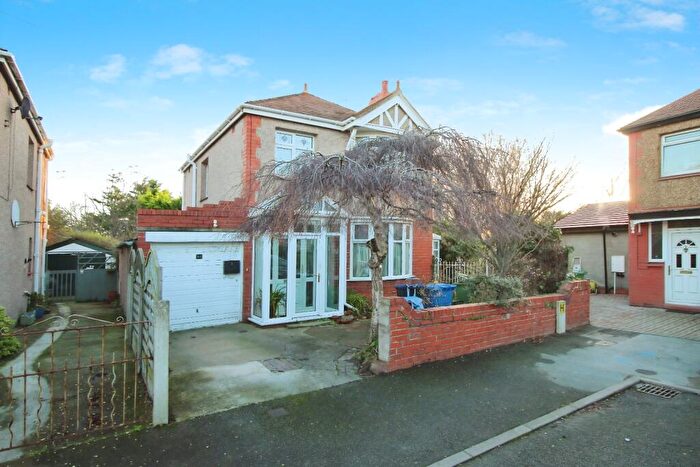
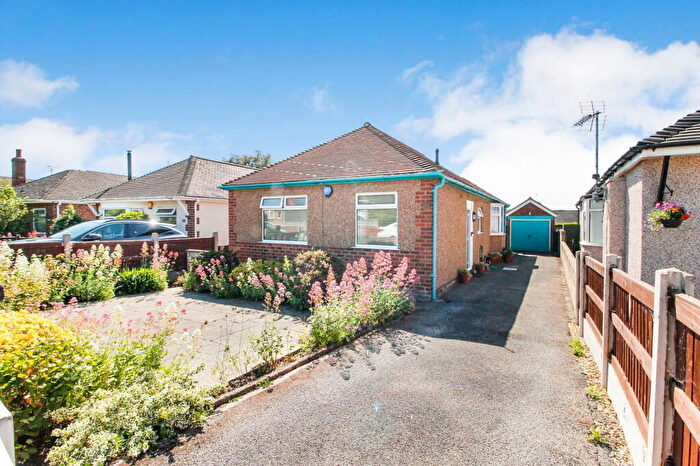
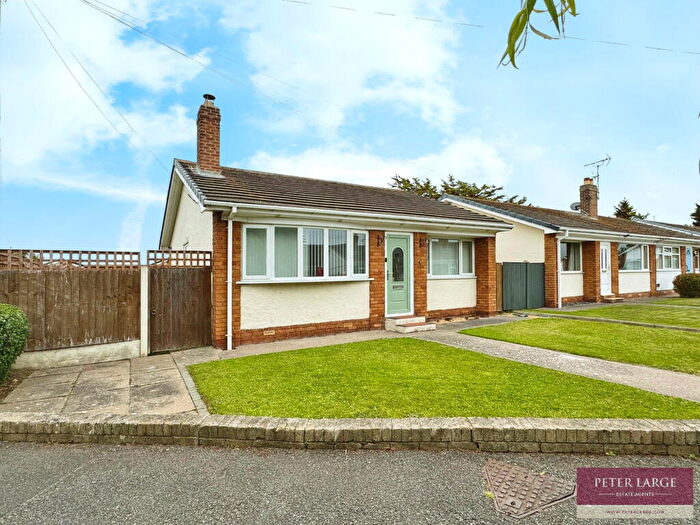
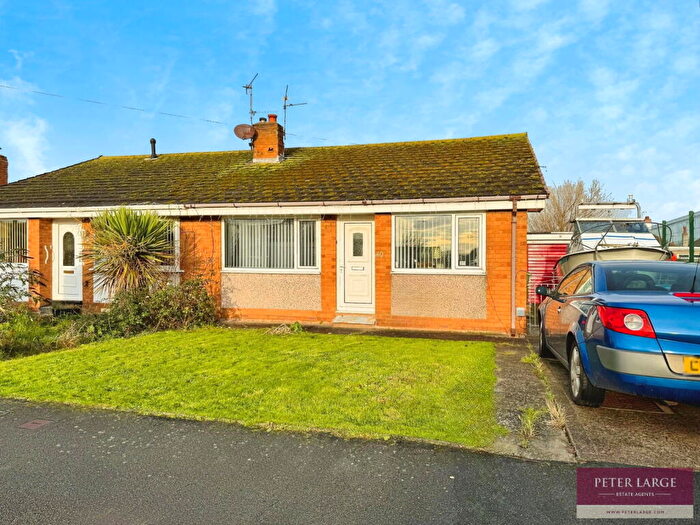
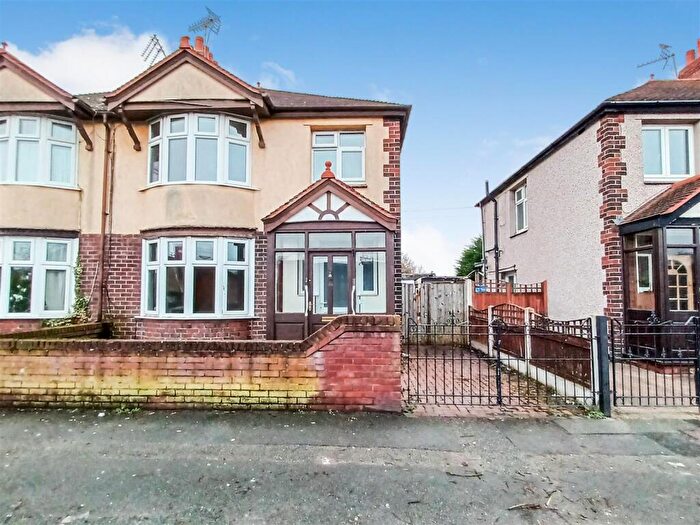
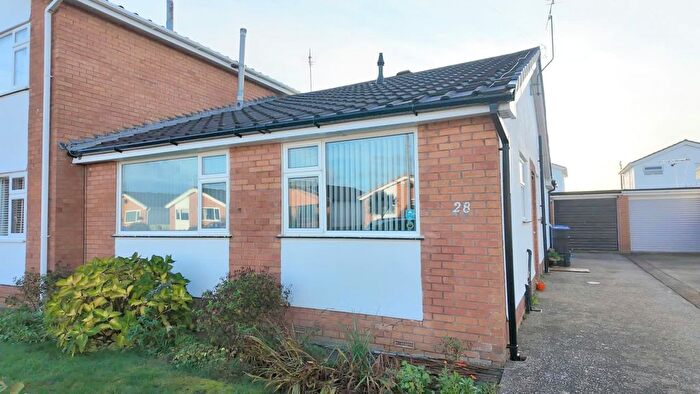
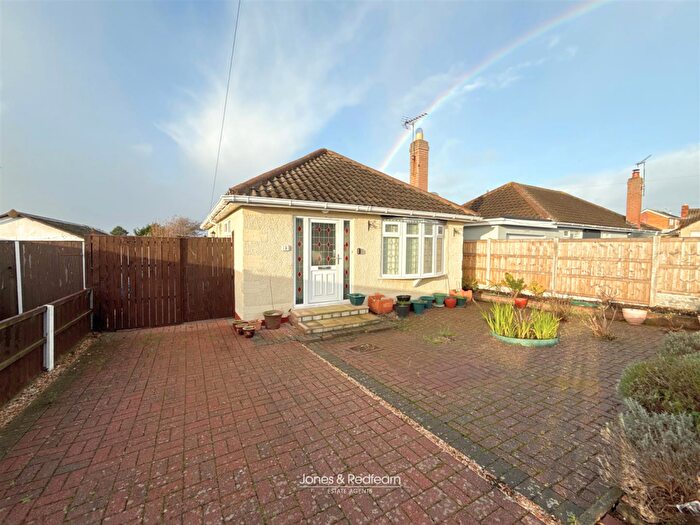
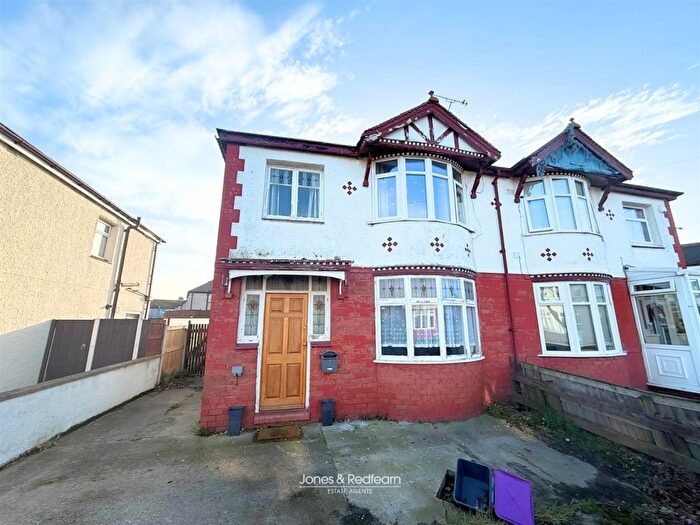
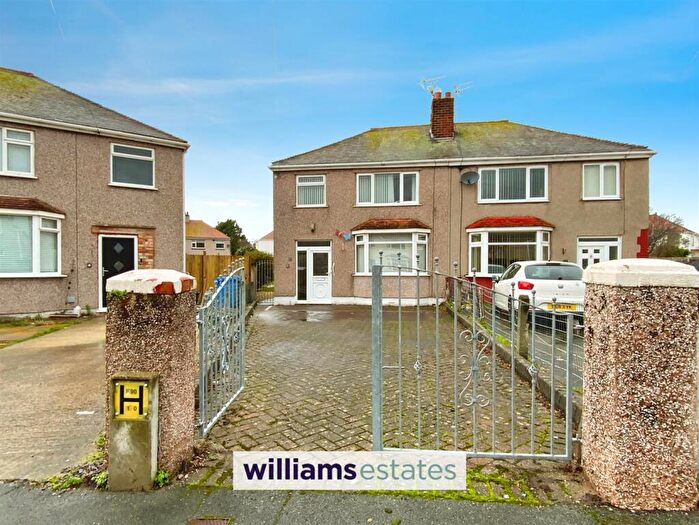
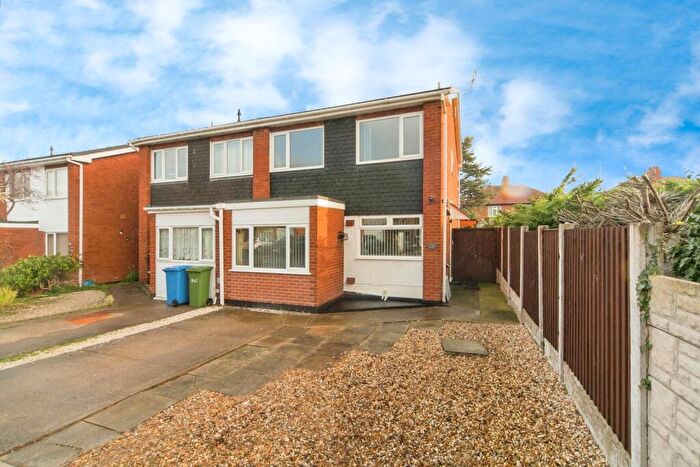
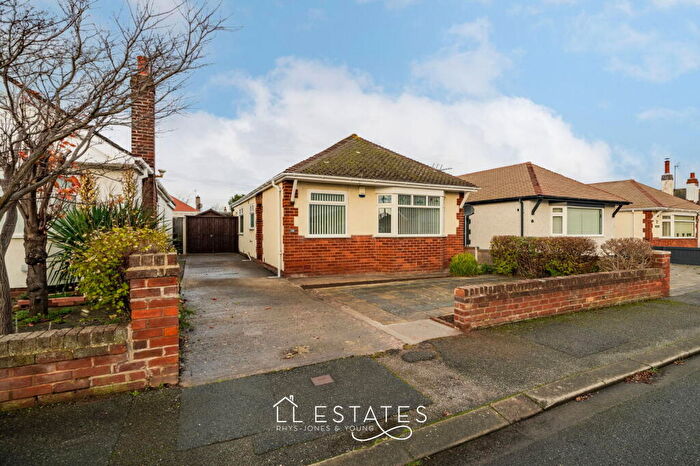
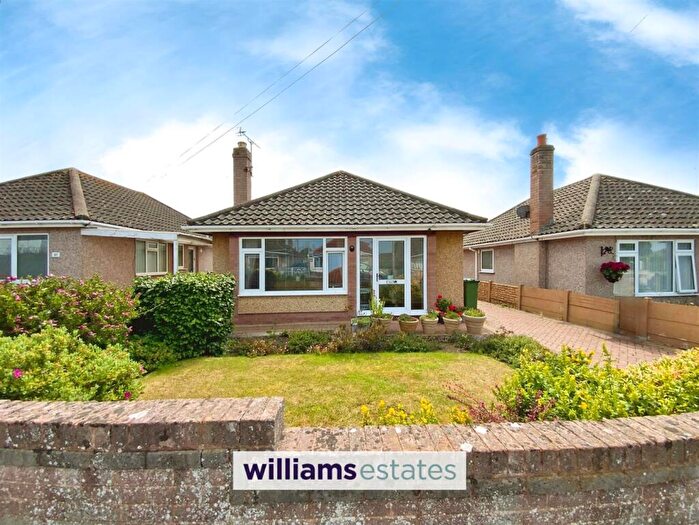
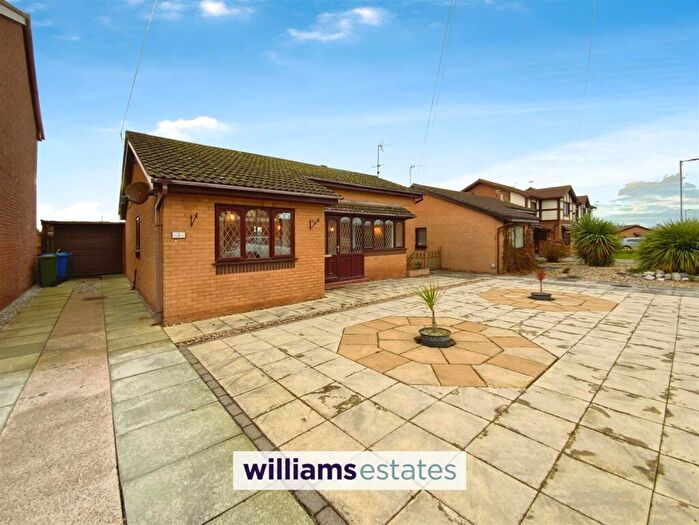
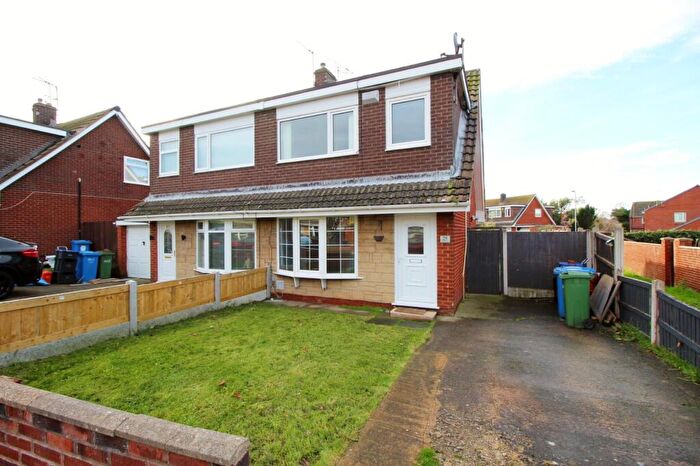
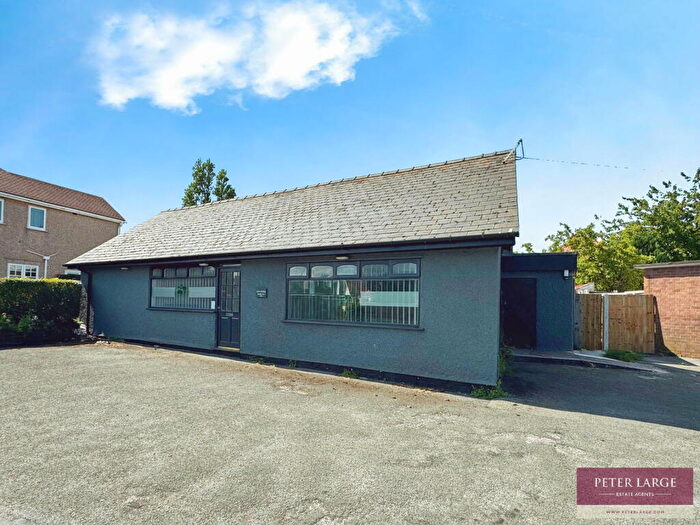
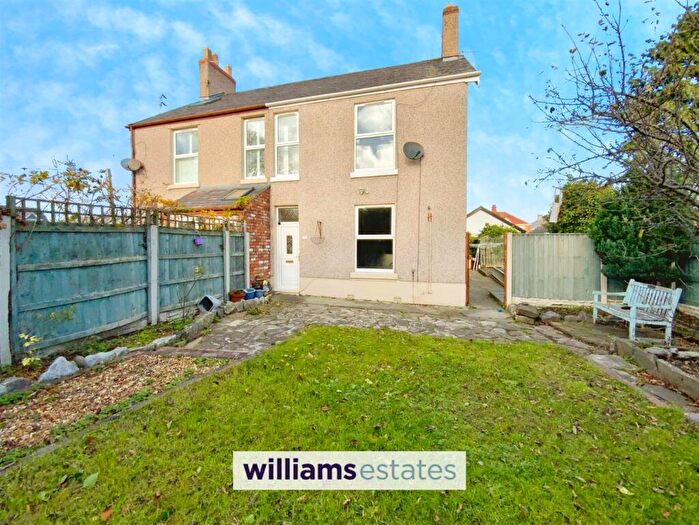
Properties for sale near LL18 2HS, Poplars Drive

![]()
If you are looking to sell your house, let it out, or receive a property valuation, an expert can help you.
Click the button below to get started.


Price Paid in Poplars Drive, LL18 2HS, Rhyl South West
3 Poplars Drive, LL18 2HS, Rhyl South West Rhyl
Property 3 has been sold 2 times. The last time it was sold was in 25/04/2025 and the sold price was £170,000.00.
This semi detached house, sold as a freehold on 25/04/2025, is a 85 sqm semi-detached bungalow with an EPC rating of F.
| Date | Price | Property Type | Tenure | Classification |
|---|---|---|---|---|
| 25/04/2025 | £170,000.00 | Semi Detached House | freehold | Established Building |
| 28/01/2021 | £90,000.00 | Semi Detached House | freehold | Established Building |
4 Poplars Drive, LL18 2HS, Rhyl South West Rhyl
Property 4 has been sold 1 time. The last time it was sold was in 24/02/2016 and the sold price was £120,000.00.
This semi detached house, sold as a freehold on 24/02/2016, is a 79 sqm semi-detached bungalow with an EPC rating of D.
| Date | Price | Property Type | Tenure | Classification |
|---|---|---|---|---|
| 24/02/2016 | £120,000.00 | Semi Detached House | freehold | Established Building |
2 Poplars Drive, LL18 2HS, Rhyl South West Rhyl
Property 2 has been sold 1 time. The last time it was sold was in 17/01/2013 and the sold price was £75,000.00.
This semi detached house, sold as a freehold on 17/01/2013, is a 86 sqm semi-detached house with an EPC rating of C.
| Date | Price | Property Type | Tenure | Classification |
|---|---|---|---|---|
| 17/01/2013 | £75,000.00 | Semi Detached House | freehold | Established Building |
Transport near LL18 2HS, Poplars Drive

House price paid reports for LL18 2HS, Poplars Drive
Click on the buttons below to see price paid reports by year or property price:
- Price Paid By Year
- Property Type Price
Property Price Paid in LL18 2HS, Poplars Drive by Year
The average sold property price by year was:
| Year | Average Sold Price | Price Change |
Sold Properties
|
|---|---|---|---|
| 2025 | £170,000 | 47% |
1 Property |
| 2021 | £90,000 | -33% |
1 Property |
| 2016 | £120,000 | 38% |
1 Property |
| 2013 | £75,000 | - |
1 Property |
Property Price per Property Type in LL18 2HS, Poplars Drive
Here you can find historic sold price data in order to help with your property search.
The average Property Paid Price for specific property types in the last three years are:
| Property Type | Average Sold Price | Sold Properties |
|---|---|---|
| Semi Detached House | £170,000.00 | 1 Semi Detached House |