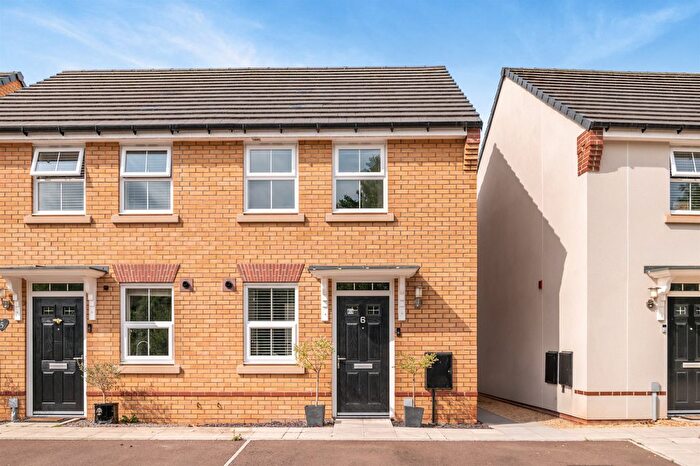
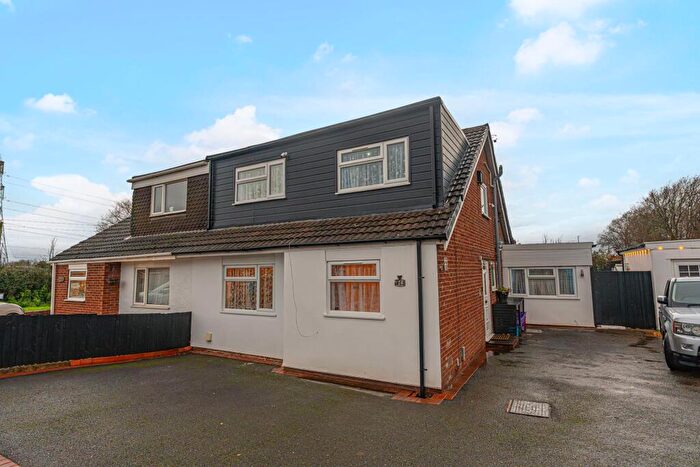
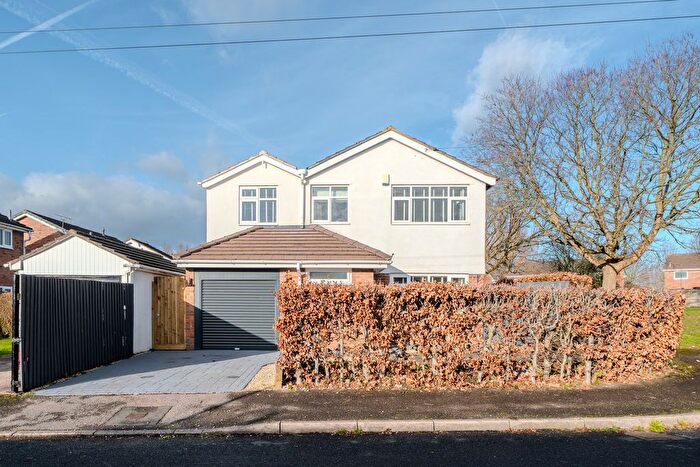
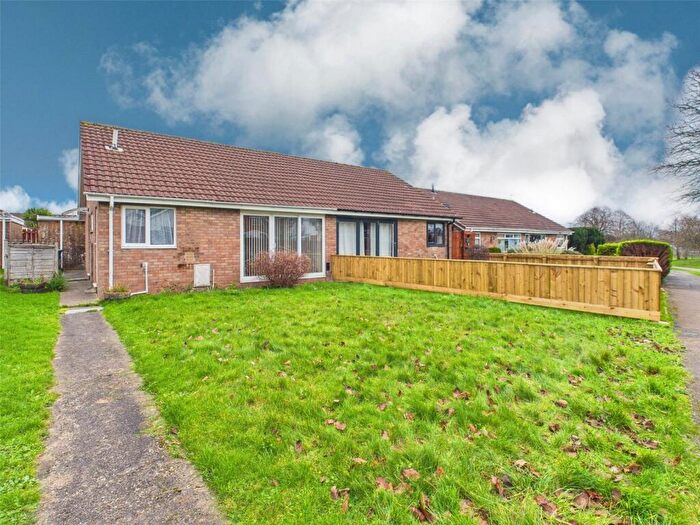
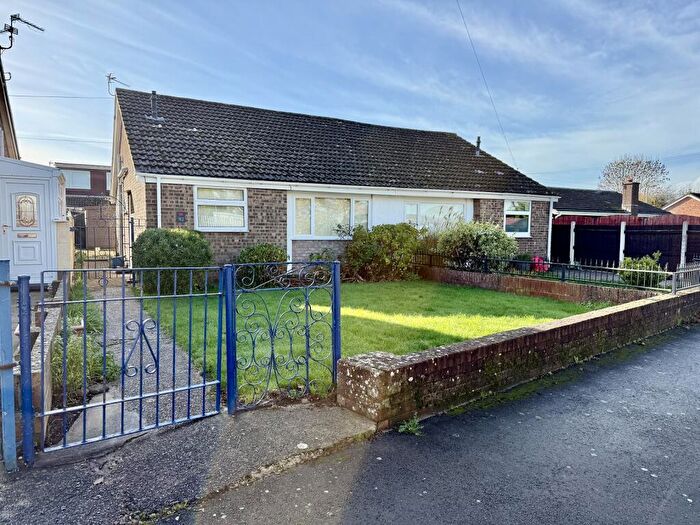
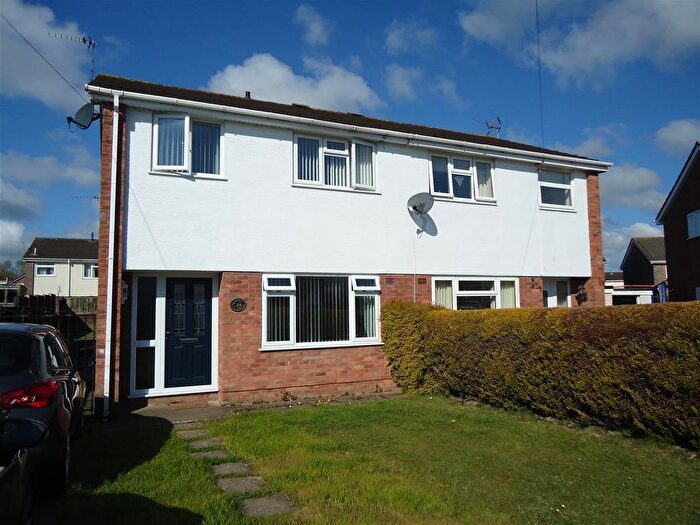
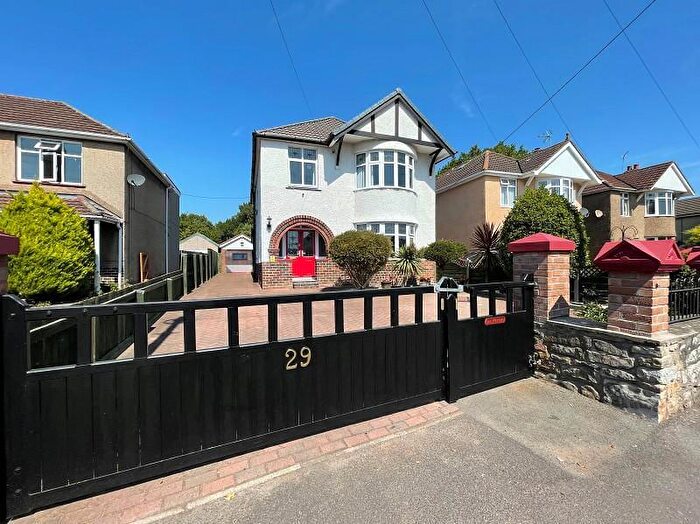
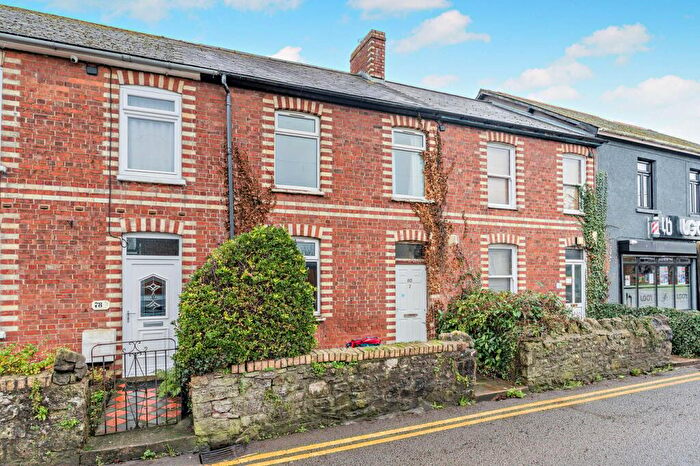
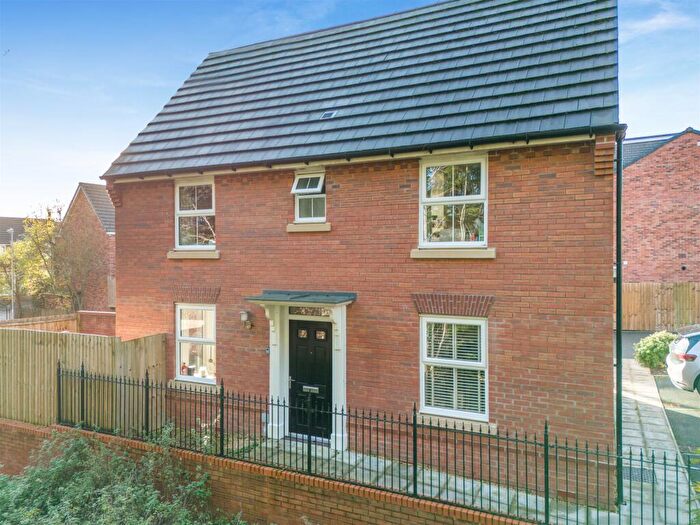
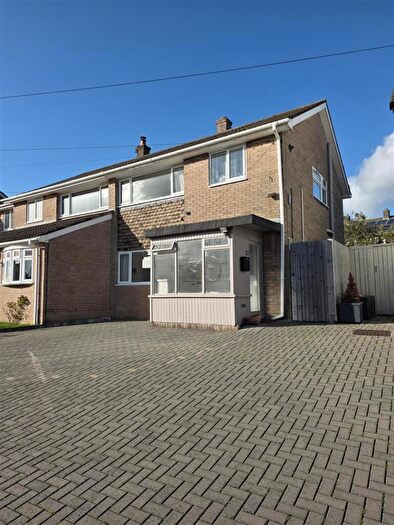
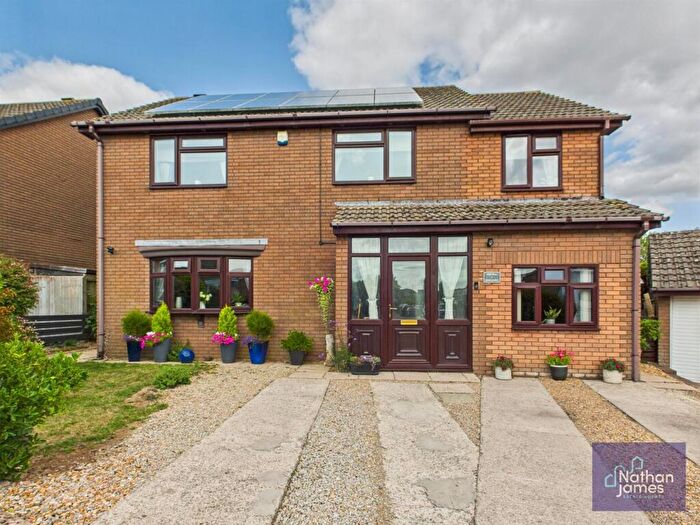
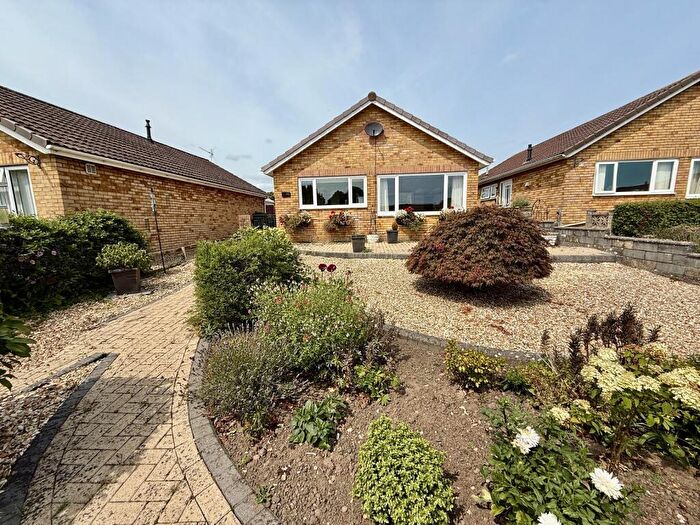
Houses for sale & to rent in Green Lane, Caldicot
House Prices in Green Lane
Properties in Green Lane have an average house price of £261,338.00 and had 74 Property Transactions within the last 3 years¹.
Green Lane is an area in Caldicot, Sir Fynwy - Monmouthshire with 818 households², where the most expensive property was sold for £490,000.00.
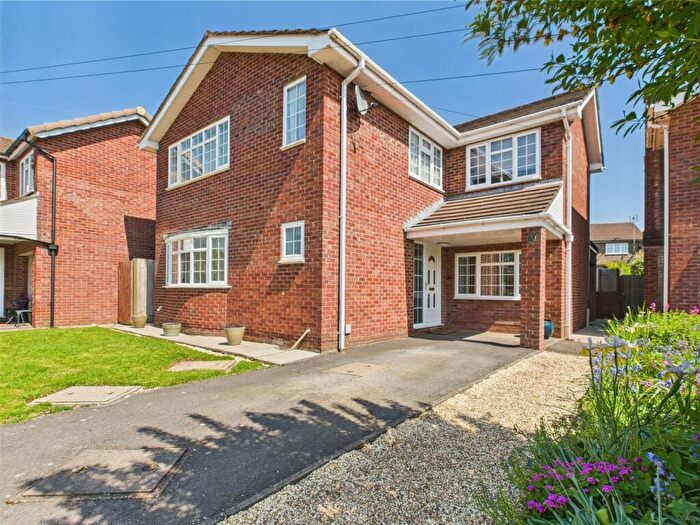
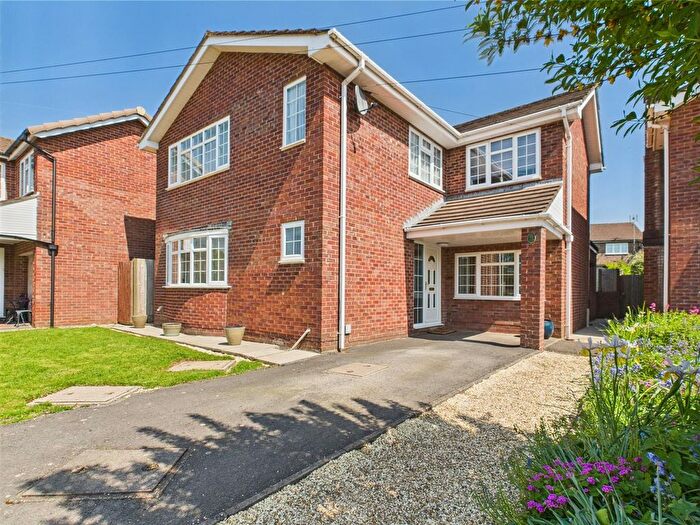
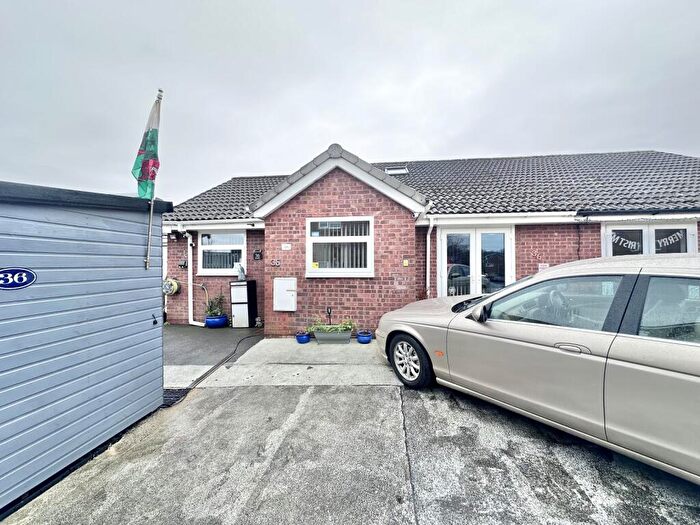
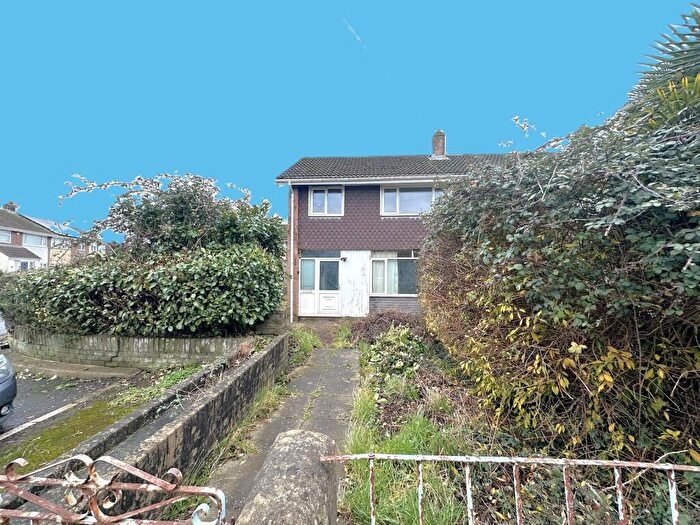
Properties for sale in Green Lane
Roads and Postcodes in Green Lane
Navigate through our locations to find the location of your next house in Green Lane, Caldicot for sale or to rent.
| Streets | Postcodes |
|---|---|
| Caemawr Avenue | NP26 4HA |
| Caemawr Grove | NP26 4EY |
| Caemawr Road | NP26 4EN NP26 4EW |
| Castle Lea | NP26 4HR NP26 4HS NP26 4PJ NP26 4PL |
| Chepstow Road | NP26 4HY |
| Cobb Crescent | NP26 5BY |
| Court House Close | NP26 4GZ |
| Dunlin Avenue | NP26 5DL |
| Durand Road | NP26 5BZ |
| Fernleigh Road | NP26 4HQ |
| Fitzwalter Road | NP26 5DA |
| Green Avenue | NP26 4EZ |
| Green Court | NP26 4HJ |
| Green Lane | NP26 4DP NP26 4HB NP26 4HD NP26 4HH |
| Greenfield | NP26 4NB |
| Jolyons Court | NP26 4QL |
| Longcroft Road | NP26 4EU NP26 4EX |
| New Road | NP26 4HG |
| Newport Road | NP26 4BR NP26 4BS NP26 4BT NP26 4HX NP26 4BG NP26 4BQ NP26 4FE NP26 4FF NP26 4LY |
| Norman Court | NP26 4EQ |
| Waghausel Close | NP26 4QR |
| Westfield | NP26 4HE |
| Westfield Avenue | NP26 4HF |
| Woodstock Close | NP26 4FD |
| Woodstock Court | NP26 4DH |
| Woodstock Way | NP26 5DB |
| Yew Tree Close | NP26 4RQ |
Transport near Green Lane
- FAQ
- Price Paid By Year
- Property Type Price
Frequently asked questions about Green Lane
What is the average price for a property for sale in Green Lane?
The average price for a property for sale in Green Lane is £261,338. This amount is 19% lower than the average price in Caldicot. There are 835 property listings for sale in Green Lane.
What streets have the most expensive properties for sale in Green Lane?
The streets with the most expensive properties for sale in Green Lane are Woodstock Court at an average of £322,475, Castle Lea at an average of £308,345 and Green Lane at an average of £273,690.
What streets have the most affordable properties for sale in Green Lane?
The streets with the most affordable properties for sale in Green Lane are Newport Road at an average of £193,296, Dunlin Avenue at an average of £218,725 and Caemawr Grove at an average of £239,900.
Which train stations are available in or near Green Lane?
Some of the train stations available in or near Green Lane are Caldicot, Severn Tunnel Junction and Severn Beach.
Property Price Paid in Green Lane by Year
The average sold property price by year was:
| Year | Average Sold Price | Price Change |
Sold Properties
|
|---|---|---|---|
| 2025 | £240,843 | -14% |
8 Properties |
| 2024 | £274,642 | 4% |
13 Properties |
| 2023 | £263,206 | 1% |
18 Properties |
| 2022 | £260,120 | 4% |
35 Properties |
| 2021 | £249,498 | 15% |
43 Properties |
| 2020 | £212,041 | -9% |
12 Properties |
| 2019 | £231,238 | 15% |
22 Properties |
| 2018 | £196,138 | 12% |
17 Properties |
| 2017 | £171,781 | 2% |
29 Properties |
| 2016 | £167,638 | 9% |
25 Properties |
| 2015 | £151,747 | -7% |
32 Properties |
| 2014 | £161,975 | 7% |
20 Properties |
| 2013 | £151,104 | 7% |
23 Properties |
| 2012 | £140,315 | 2% |
19 Properties |
| 2011 | £136,833 | -22% |
15 Properties |
| 2010 | £167,422 | 5% |
20 Properties |
| 2009 | £159,562 | 7% |
16 Properties |
| 2008 | £148,987 | -8% |
4 Properties |
| 2007 | £160,636 | 8% |
42 Properties |
| 2006 | £148,326 | -1% |
34 Properties |
| 2005 | £150,438 | 10% |
28 Properties |
| 2004 | £135,560 | 19% |
32 Properties |
| 2003 | £109,672 | 23% |
27 Properties |
| 2002 | £84,353 | 5% |
27 Properties |
| 2001 | £79,925 | 21% |
28 Properties |
| 2000 | £62,804 | 7% |
27 Properties |
| 1999 | £58,474 | -16% |
35 Properties |
| 1998 | £67,789 | 17% |
24 Properties |
| 1997 | £56,148 | -2% |
33 Properties |
| 1996 | £57,497 | 9% |
18 Properties |
| 1995 | £52,304 | - |
23 Properties |
Property Price per Property Type in Green Lane
Here you can find historic sold price data in order to help with your property search.
The average Property Paid Price for specific property types in the last three years are:
| Property Type | Average Sold Price | Sold Properties |
|---|---|---|
| Semi Detached House | £257,465.00 | 41 Semi Detached Houses |
| Detached House | £382,825.00 | 12 Detached Houses |
| Terraced House | £224,921.00 | 16 Terraced Houses |
| Flat | £118,052.00 | 5 Flats |

