
Houses for sale & to rent in Sir Fynwy - Monmouthshire, Wales
House Prices in Sir Fynwy - Monmouthshire
Properties in Sir Fynwy - Monmouthshire have
an average house price of
£356k
and had 3,391 Property Transactions
within the last 3 years.¹
Sir Fynwy - Monmouthshire is a location in
Wales with
38,130 households², where the most expensive property was sold for £2.06M.
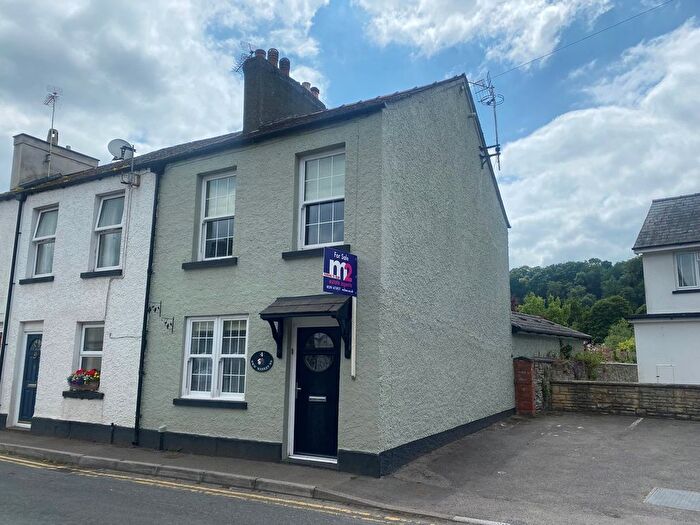
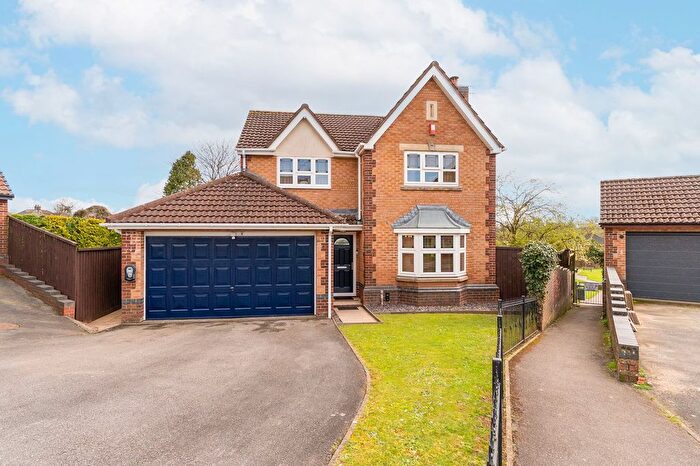
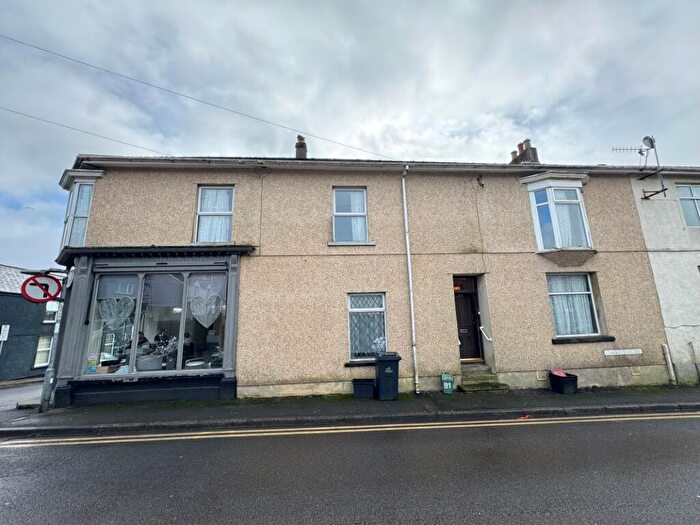
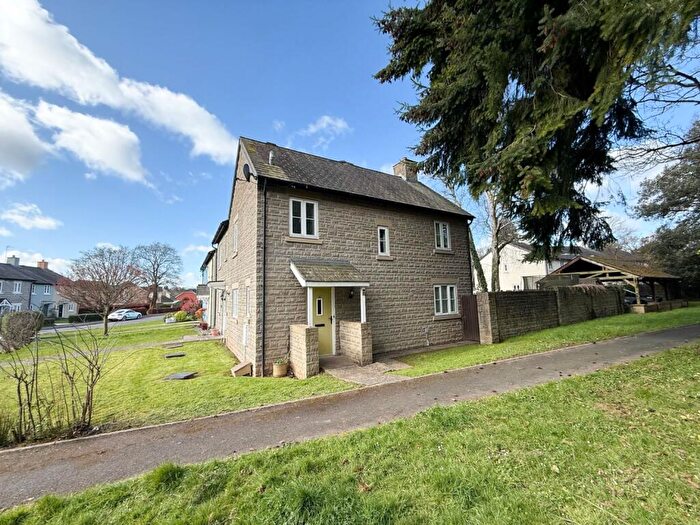
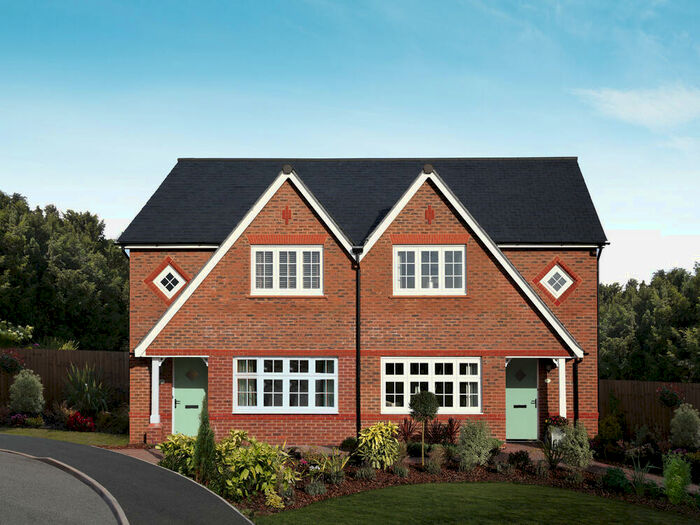
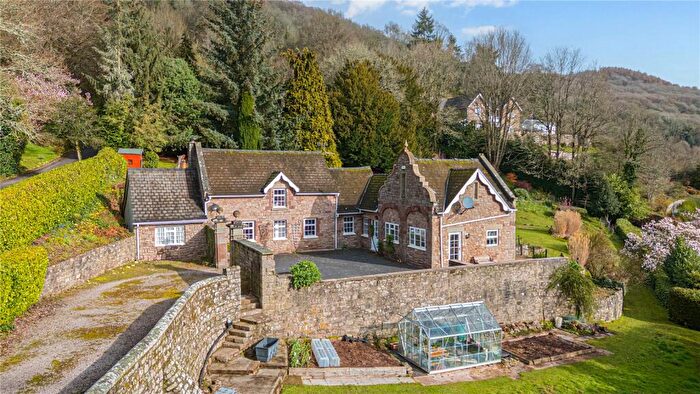
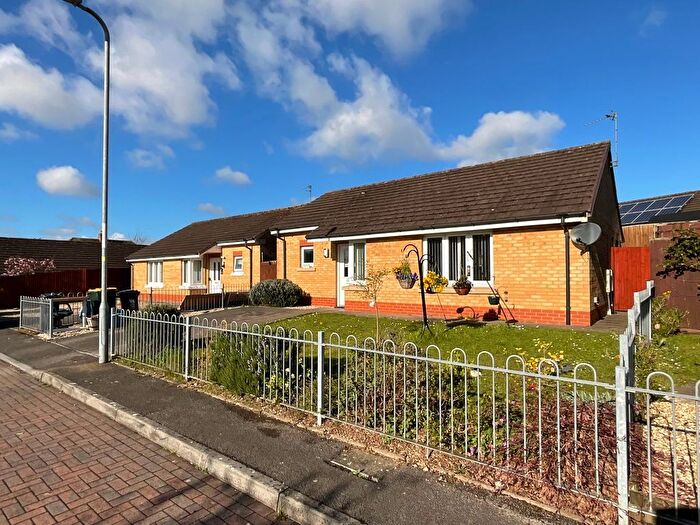
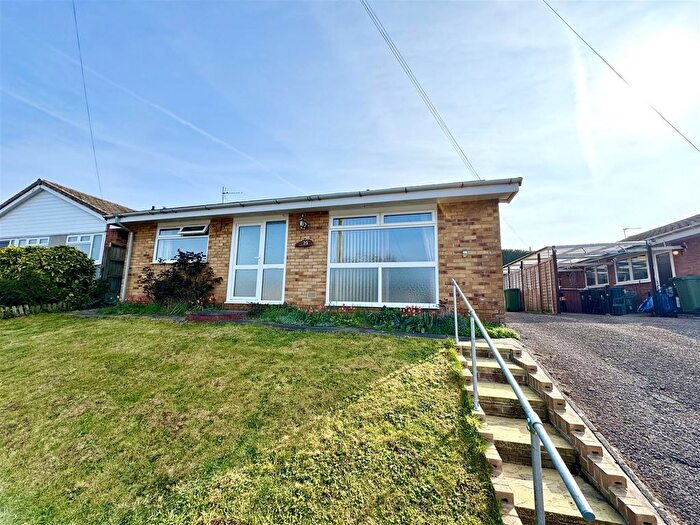
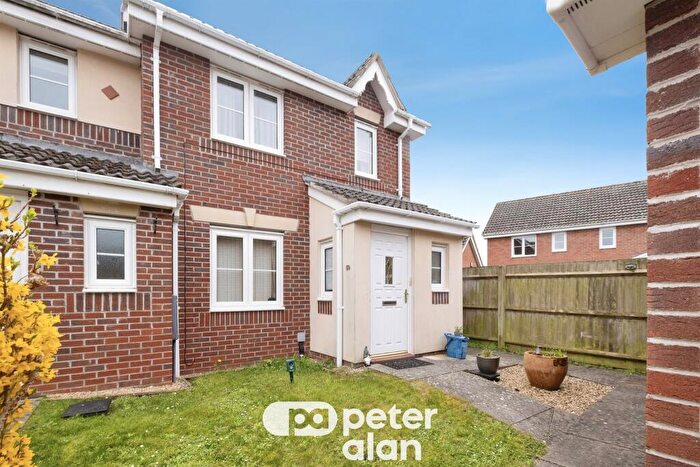
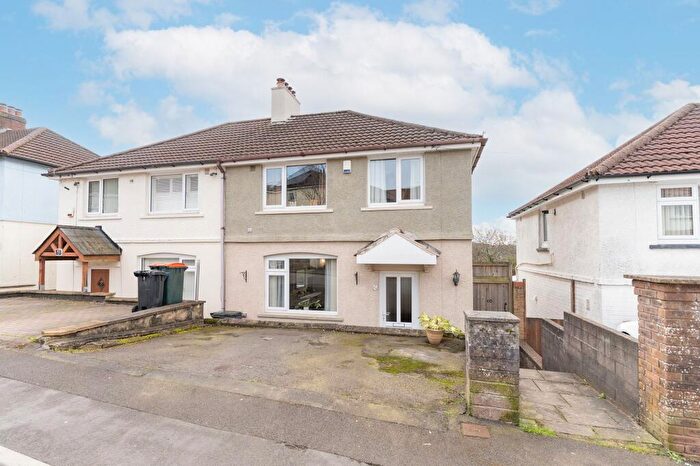
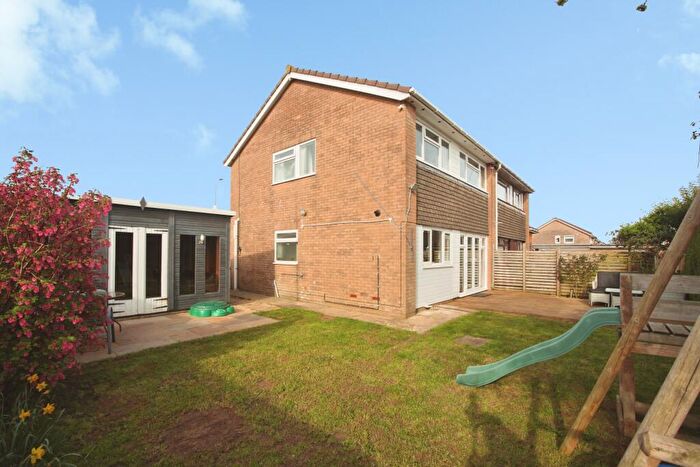
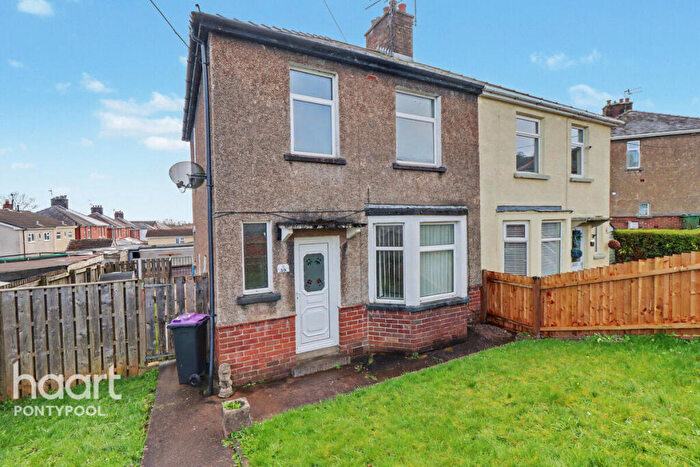
Properties for sale in Sir Fynwy - Monmouthshire
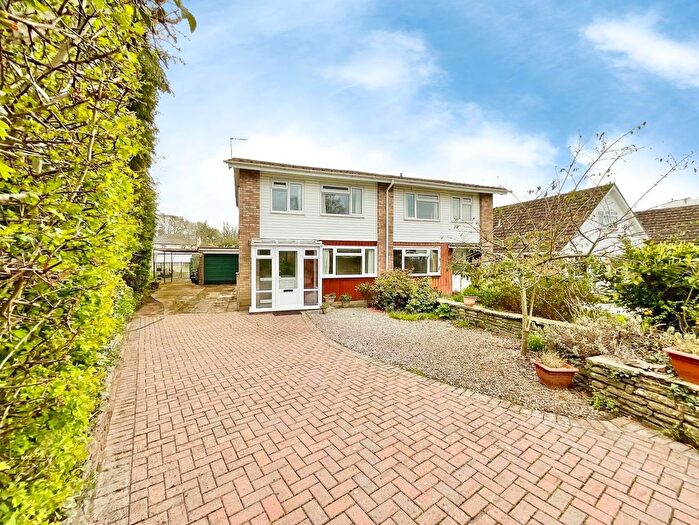
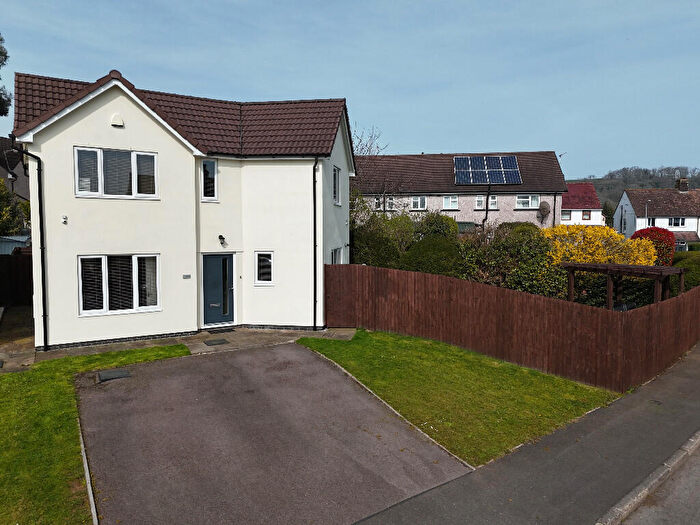
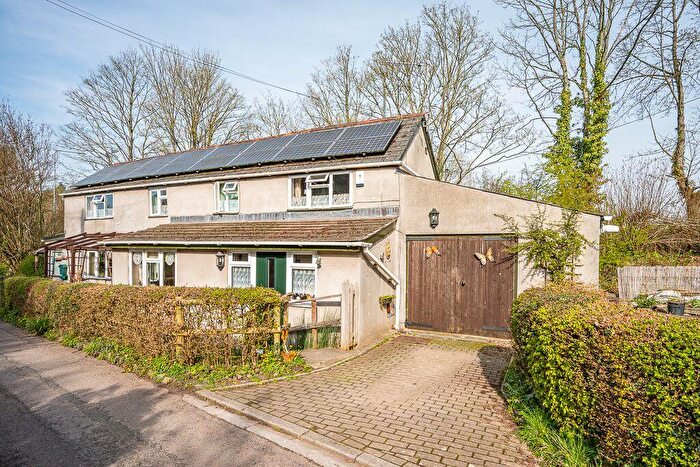
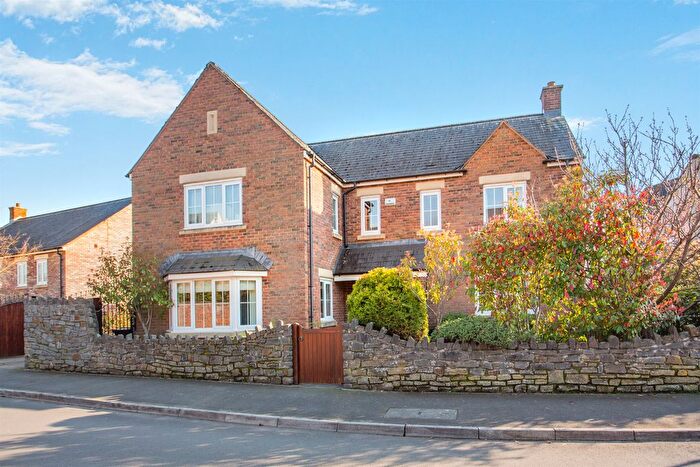
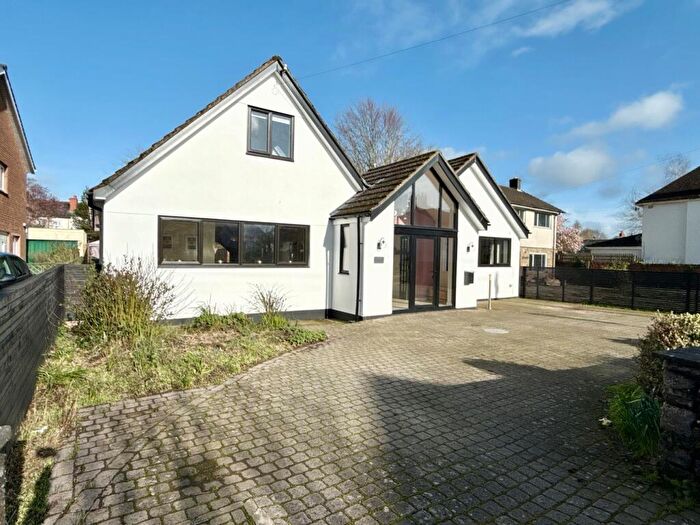
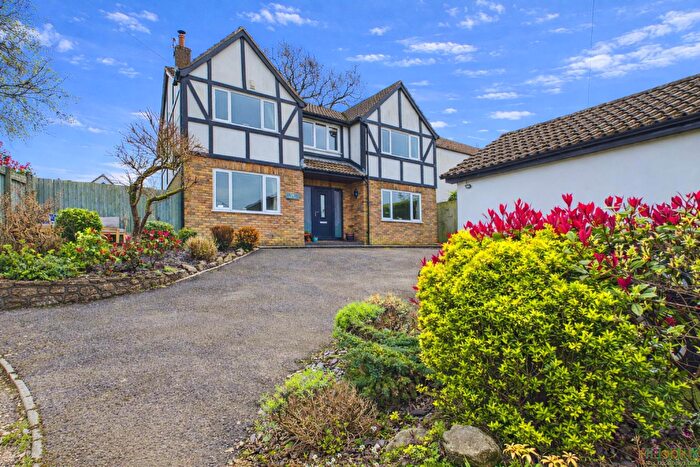
![]()
If you are looking to sell your house, let it out, or receive a property valuation, an expert can help you.
Click the button below to get started.


Towns in Sir Fynwy - Monmouthshire
Navigate through our locations to find the location of your next house in Sir Fynwy - Monmouthshire, Wales for sale or to rent.
Transport in Sir Fynwy - Monmouthshire
Please see below transportation links in this area:

- FAQ
- Price Paid By Year
- Property Type Price
Frequently asked questions about Sir Fynwy - Monmouthshire
What is the average price for a property for sale in Sir Fynwy - Monmouthshire?
The average price for a property for sale in Sir Fynwy - Monmouthshire is £356,114. This amount is 55% higher than the average price in Wales. There are more than 10,000 property listings for sale in Sir Fynwy - Monmouthshire.
What locations have the most expensive properties for sale in Sir Fynwy - Monmouthshire?
The locations with the most expensive properties for sale in Sir Fynwy - Monmouthshire are Cwmbran at an average of £790,000, Newport at an average of £652,875 and Usk at an average of £424,686.
What locations have the most affordable properties for sale in Sir Fynwy - Monmouthshire?
The locations with the most affordable properties for sale in Sir Fynwy - Monmouthshire are Ebbw Vale at an average of £126,000, Caldicot at an average of £319,272 and Abergavenny at an average of £340,290.
Which train stations are available in or near Sir Fynwy - Monmouthshire?
Some of the train stations available in or near Sir Fynwy - Monmouthshire are Pontypool and New Inn, Abergavenny and Cwmbran.
Property Price Paid in Sir Fynwy - Monmouthshire by Year
The average sold property price by year was:
| Year | Average Sold Price | Price Change |
Sold Properties
|
|---|---|---|---|
| 2026 | £341,170 | -4% |
31 Properties |
| 2025 | £354,933 | -1% |
1,074 Properties |
| 2024 | £358,954 | 1% |
1,204 Properties |
| 2023 | £354,554 | -1% |
1,082 Properties |
| 2022 | £356,433 | 7% |
1,409 Properties |
| 2021 | £332,061 | 7% |
1,836 Properties |
| 2020 | £307,784 | 8% |
1,168 Properties |
| 2019 | £284,378 | 2% |
1,389 Properties |
| 2018 | £277,864 | 7% |
1,522 Properties |
| 2017 | £258,758 | 3% |
1,657 Properties |
| 2016 | £249,813 | 5% |
1,662 Properties |
| 2015 | £238,109 | 3% |
1,525 Properties |
| 2014 | £231,809 | 8% |
1,483 Properties |
| 2013 | £214,035 | -4% |
1,320 Properties |
| 2012 | £221,955 | 1% |
1,132 Properties |
| 2011 | £219,049 | -2% |
1,058 Properties |
| 2010 | £224,401 | 8% |
1,070 Properties |
| 2009 | £206,995 | -6% |
912 Properties |
| 2008 | £219,812 | -4% |
817 Properties |
| 2007 | £229,268 | 7% |
1,683 Properties |
| 2006 | £213,648 | 4% |
1,653 Properties |
| 2005 | £204,245 | 10% |
1,394 Properties |
| 2004 | £183,726 | 13% |
1,903 Properties |
| 2003 | £159,754 | 16% |
1,779 Properties |
| 2002 | £134,941 | 16% |
2,110 Properties |
| 2001 | £113,364 | 13% |
1,846 Properties |
| 2000 | £98,580 | 9% |
1,946 Properties |
| 1999 | £89,769 | 9% |
1,898 Properties |
| 1998 | £81,908 | 9% |
1,460 Properties |
| 1997 | £74,355 | 6% |
1,704 Properties |
| 1996 | £69,756 | 1% |
1,506 Properties |
| 1995 | £68,869 | - |
1,201 Properties |
Property Price per Property Type in Sir Fynwy - Monmouthshire
Here you can find historic sold price data in order to help with your property search.
The average Property Paid Price for specific property types in the last three years are:
| Property Type | Average Sold Price | Sold Properties |
|---|---|---|
| Semi Detached House | £293,803.00 | 941 Semi Detached Houses |
| Terraced House | £255,554.00 | 773 Terraced Houses |
| Detached House | £482,329.00 | 1,425 Detached Houses |
| Flat | £183,541.00 | 252 Flats |