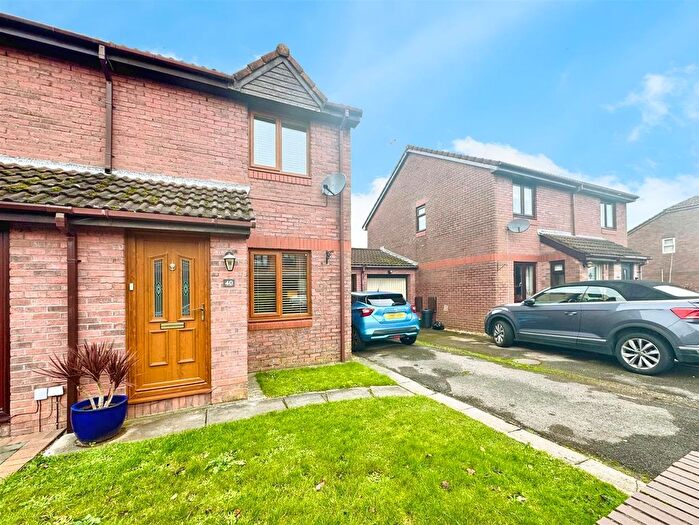
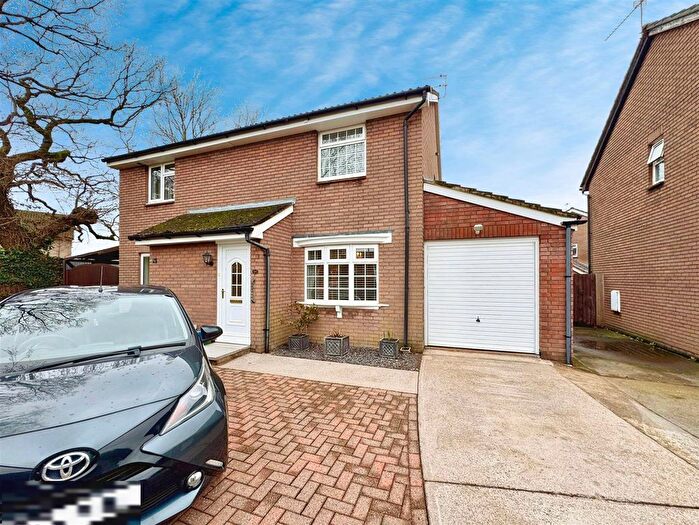
Houses for sale & to rent in Mill, Caldicot
House Prices in Mill
Properties in Mill have an average house price of £370,011.00 and had 73 Property Transactions within the last 3 years¹.
Mill is an area in Caldicot, Sir Fynwy - Monmouthshire with 1,061 households², where the most expensive property was sold for £650,000.00.
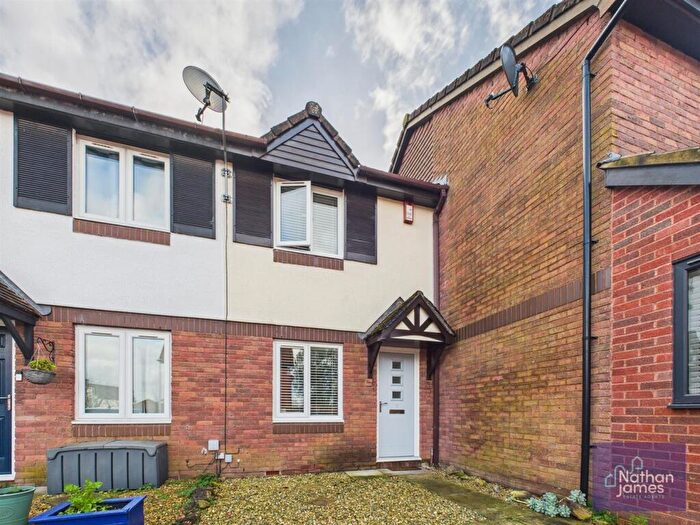
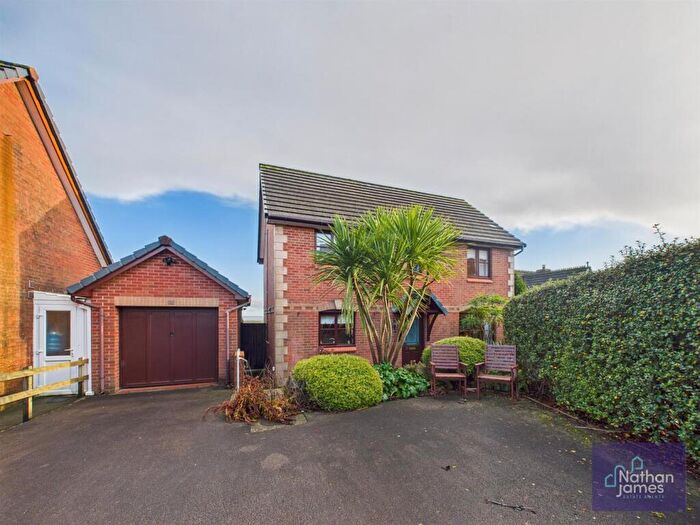
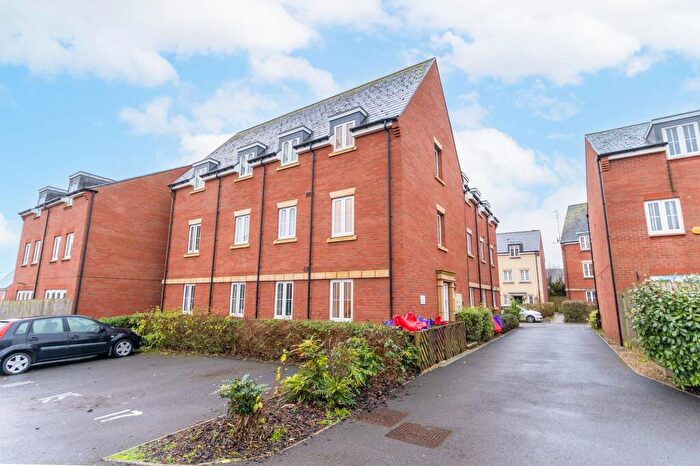
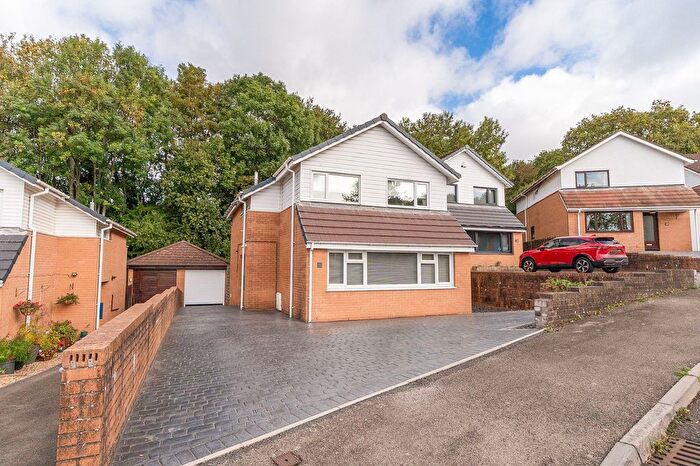
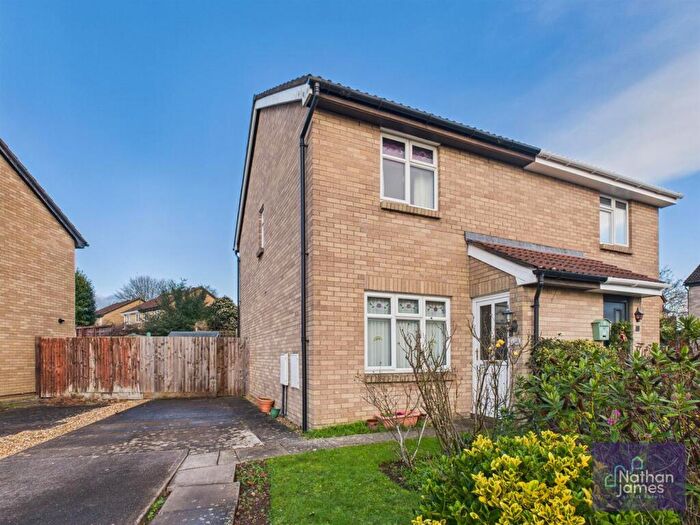
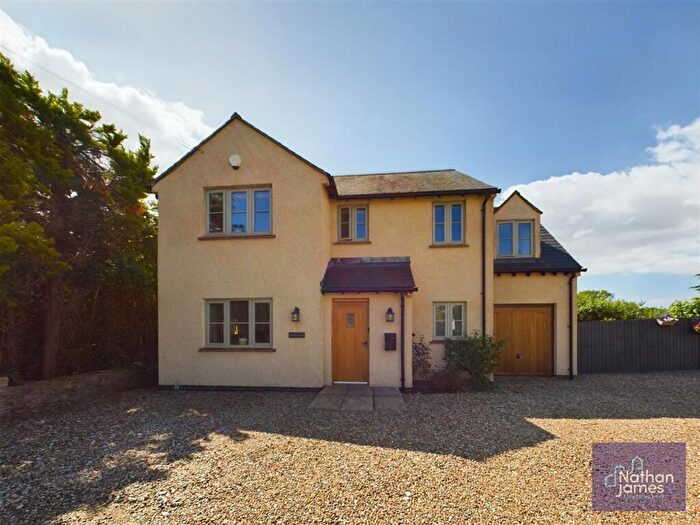
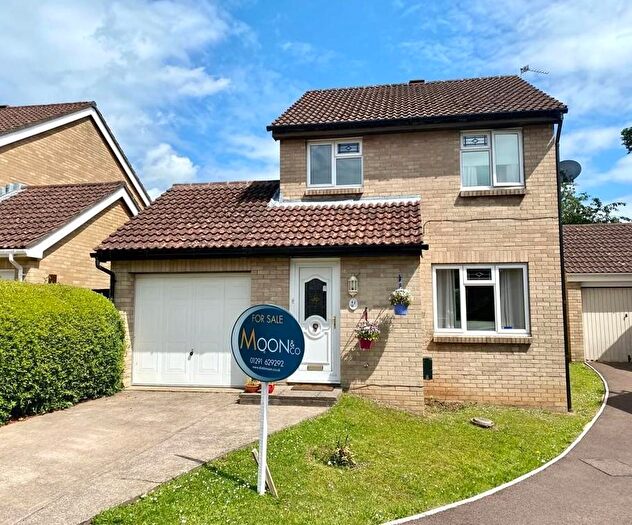
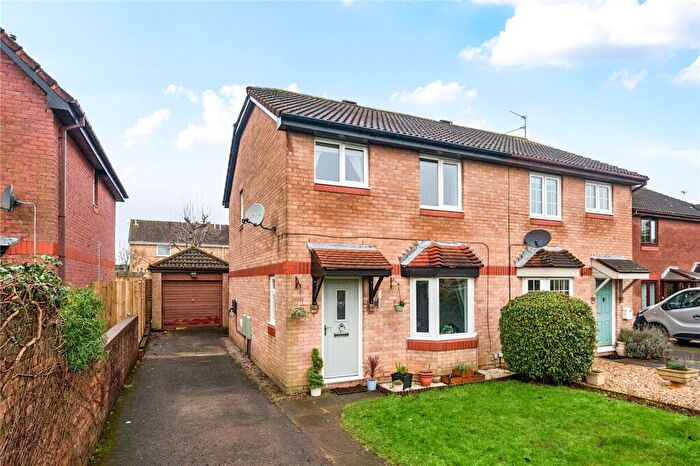
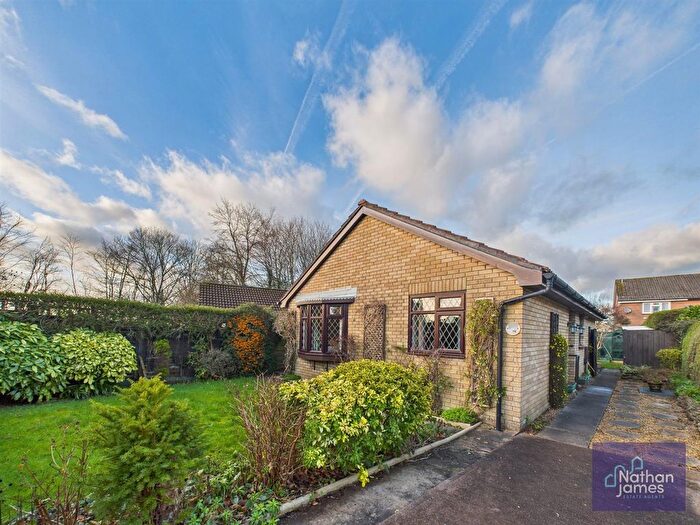
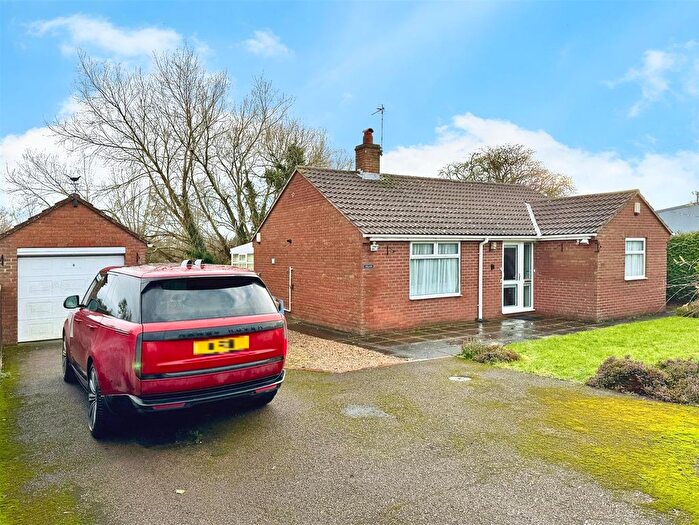
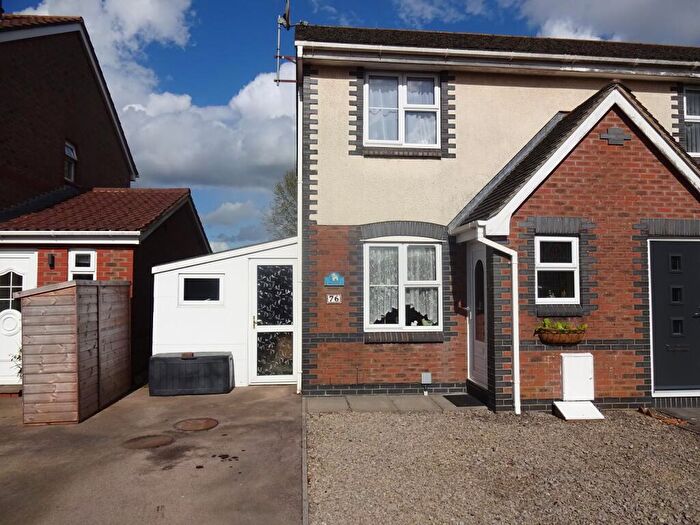
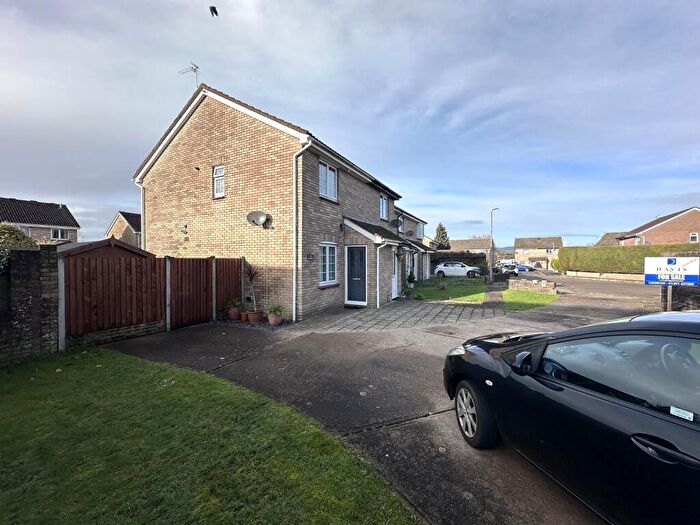
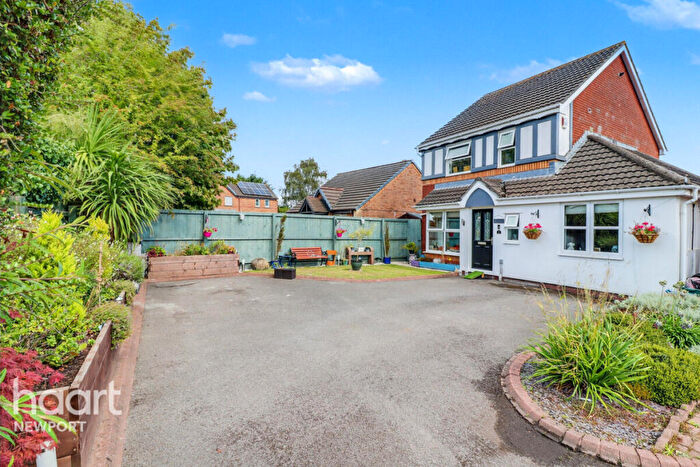
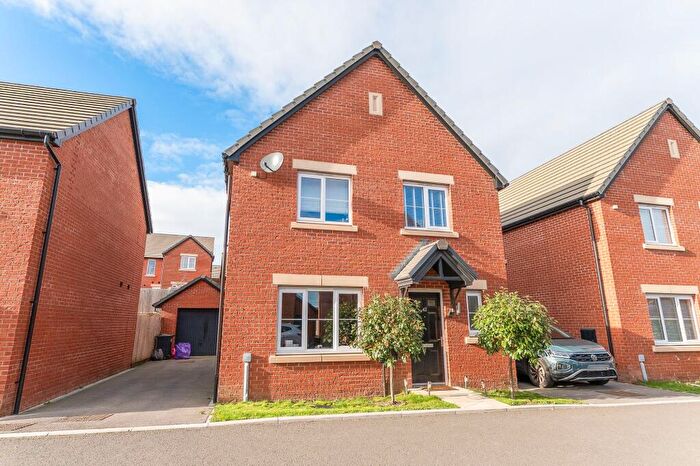
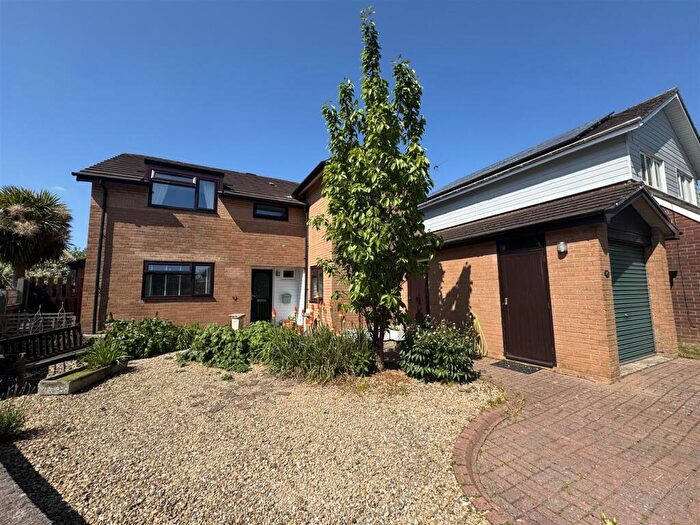
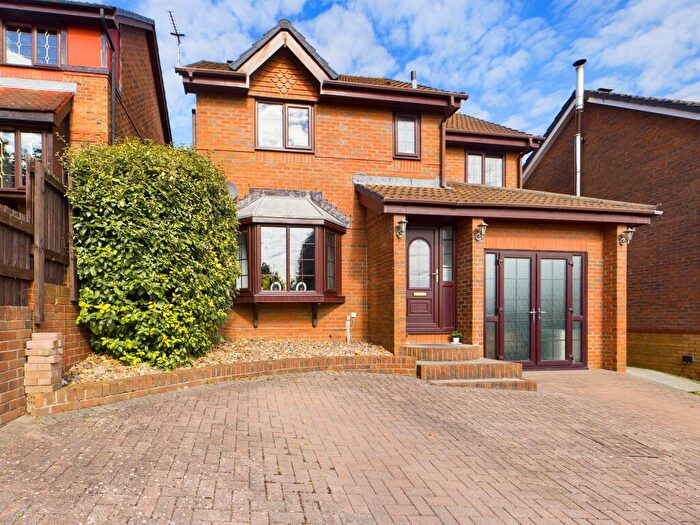
Properties for sale in Mill
Roads and Postcodes in Mill
Navigate through our locations to find the location of your next house in Mill, Caldicot for sale or to rent.
| Streets | Postcodes |
|---|---|
| Albion Way | NP26 3NY |
| Barecroft Common | NP26 3EB |
| Beeches Caravan Park | NP26 3HG |
| Blenheim Avenue | NP26 3NB |
| Blenheim Close | NP26 3ND |
| Blenheim Court | NP26 3NZ |
| Blenheim Drive | NP26 3NF |
| Blenheim Gardens | NP26 3NA |
| Blenheim Park | NP26 3NE |
| Chapel Terrace | NP26 3ES |
| Chestnut Close | NP26 3EU |
| Cowleaze | NP26 3LE |
| Dancing Hill | NP26 3BY |
| Dinch Hill | NP26 3JL |
| Kensington Park | NP26 3QG NP26 3QH |
| Langley Close | NP26 3HW |
| Llandavenny | NP26 3DB |
| Magor Interchange | NP26 3FP |
| Martin Row | NP26 3ER |
| Mill Common | NP26 3JH NP26 3JJ |
| Mill Reen | NP26 3JP |
| Millbrook Court | NP26 3JN |
| Millfield Park | NP26 3LF NP26 3LL |
| Netherwent View | NP26 3LG |
| Newport Road | NP26 3BZ NP26 3HU |
| Priory Court | NP26 3LY |
| Priory Gardens | NP26 3HL |
| Queens Gardens | NP26 3BU |
| Redwick | NP26 3DR |
| Redwick Road | NP26 3GU |
| Salisbury Walk | NP26 3GG |
| School Park | NP26 3LX |
| Seasons Close | NP26 3NX |
| Seymour Way | NP26 3GF |
| Somerset Grove | NP26 3GH |
| St Brides Close | NP26 3JB |
| St Brides Road | NP26 3JE NP26 3HX NP26 3JD |
| St Davids Court | NP26 3LP |
| The Briars | NP26 3LH |
| The Gardens | NP26 3HP |
| The Greenways | NP26 3LJ |
| The Lawns | NP26 3HS |
| The Meadow | NP26 3LA |
| The Plantation | NP26 3HR |
| The Square | NP26 3HY |
| The Willows | NP26 3HQ |
| Wales 1 Business Park | NP26 3DG |
| West End | NP26 3HT NP26 3HZ NP26 3JA |
| Wheatsheaf Court | NP26 3LD |
| Whitewall | NP26 3DD NP26 3DN NP26 3DW |
| Wilcrick | NP26 3DJ NP26 3RA |
| Windsor Close | NP26 3PX |
| Windsor Drive | NP26 3NG |
| Windsor Gardens | NP26 3NH |
| Windsor Park | NP26 3NJ |
| Withy Close | NP26 3LB |
| Withy Walk | NP26 3LN |
| Woodbine Gardens | NP26 3EZ |
| NP26 3AL NP26 3BX NP26 3DP NP26 3EG NP26 3EP NP26 3EQ NP26 3ET NP26 3AP NP26 3BB NP26 3ED NP26 3EE NP26 3HN NP26 3QP NP26 3YL |
Transport near Mill
-
Severn Tunnel Junction Station
-
Caldicot Station
-
Newport (Gwent) Station
-
Severn Beach Station
-
St.Andrew's Road Station
-
Avonmouth Station
-
Chepstow Station
-
Pye Corner Station
-
Pilning Station
-
Shirehampton Station
- FAQ
- Price Paid By Year
- Property Type Price
Frequently asked questions about Mill
What is the average price for a property for sale in Mill?
The average price for a property for sale in Mill is £370,011. This amount is 15% higher than the average price in Caldicot. There are 769 property listings for sale in Mill.
What streets have the most expensive properties for sale in Mill?
The streets with the most expensive properties for sale in Mill are The Greenways at an average of £650,000, Dancing Hill at an average of £530,000 and Blenheim Drive at an average of £497,500.
What streets have the most affordable properties for sale in Mill?
The streets with the most affordable properties for sale in Mill are Salisbury Walk at an average of £203,362, Seymour Way at an average of £258,395 and Wheatsheaf Court at an average of £277,500.
Which train stations are available in or near Mill?
Some of the train stations available in or near Mill are Severn Tunnel Junction, Caldicot and Newport (Gwent).
Property Price Paid in Mill by Year
The average sold property price by year was:
| Year | Average Sold Price | Price Change |
Sold Properties
|
|---|---|---|---|
| 2025 | £359,374 | -11% |
25 Properties |
| 2024 | £400,250 | 12% |
24 Properties |
| 2023 | £350,854 | -7% |
24 Properties |
| 2022 | £377,006 | 17% |
33 Properties |
| 2021 | £313,985 | 9% |
50 Properties |
| 2020 | £285,466 | -2% |
30 Properties |
| 2019 | £290,530 | 6% |
40 Properties |
| 2018 | £273,109 | 10% |
32 Properties |
| 2017 | £246,086 | -1% |
48 Properties |
| 2016 | £247,931 | -3% |
41 Properties |
| 2015 | £254,887 | 25% |
37 Properties |
| 2014 | £192,021 | 3% |
57 Properties |
| 2013 | £186,453 | -8% |
52 Properties |
| 2012 | £201,927 | 3% |
32 Properties |
| 2011 | £195,903 | -19% |
31 Properties |
| 2010 | £232,901 | 15% |
26 Properties |
| 2009 | £198,922 | -15% |
30 Properties |
| 2008 | £228,014 | -10% |
17 Properties |
| 2007 | £251,021 | 12% |
53 Properties |
| 2006 | £219,647 | -2% |
37 Properties |
| 2005 | £224,677 | 13% |
38 Properties |
| 2004 | £196,398 | 21% |
52 Properties |
| 2003 | £154,675 | 7% |
38 Properties |
| 2002 | £144,236 | 19% |
63 Properties |
| 2001 | £116,880 | 15% |
45 Properties |
| 2000 | £98,912 | 2% |
115 Properties |
| 1999 | £97,301 | 5% |
84 Properties |
| 1998 | £92,524 | 4% |
42 Properties |
| 1997 | £88,582 | 16% |
53 Properties |
| 1996 | £74,107 | -0,4% |
39 Properties |
| 1995 | £74,430 | - |
33 Properties |
Property Price per Property Type in Mill
Here you can find historic sold price data in order to help with your property search.
The average Property Paid Price for specific property types in the last three years are:
| Property Type | Average Sold Price | Sold Properties |
|---|---|---|
| Semi Detached House | £317,365.00 | 13 Semi Detached Houses |
| Detached House | £414,840.00 | 47 Detached Houses |
| Terraced House | £260,633.00 | 12 Terraced Houses |
| Flat | £260,000.00 | 1 Flat |

