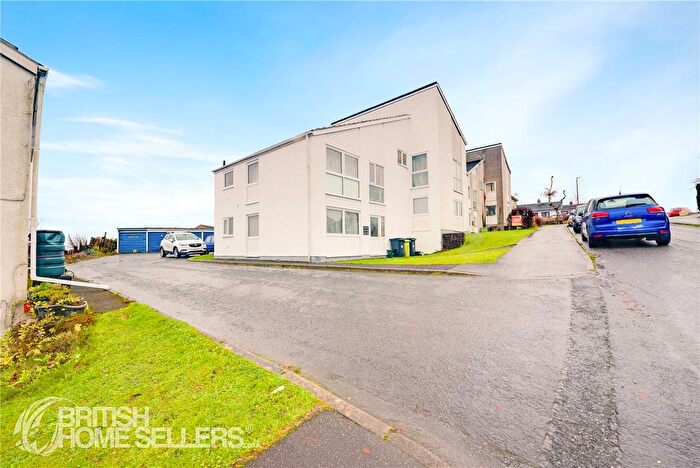
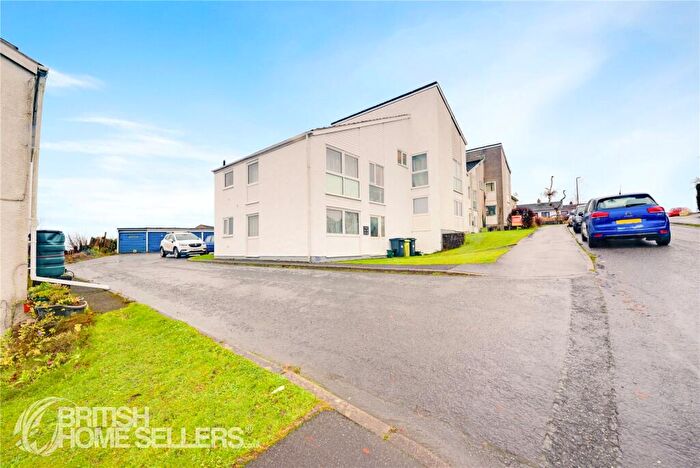
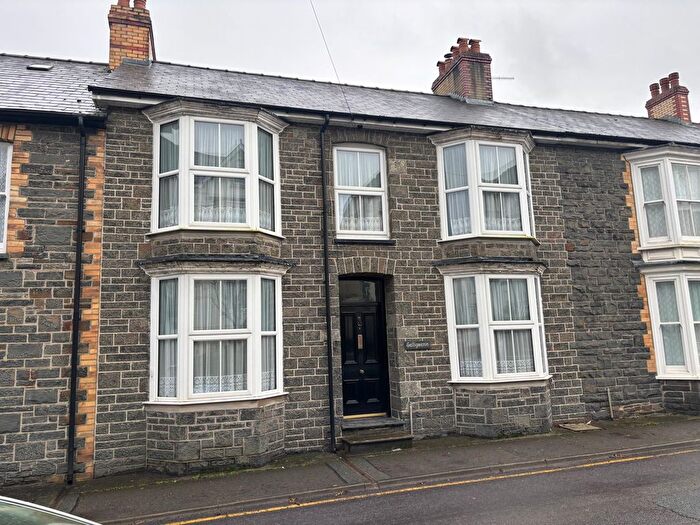
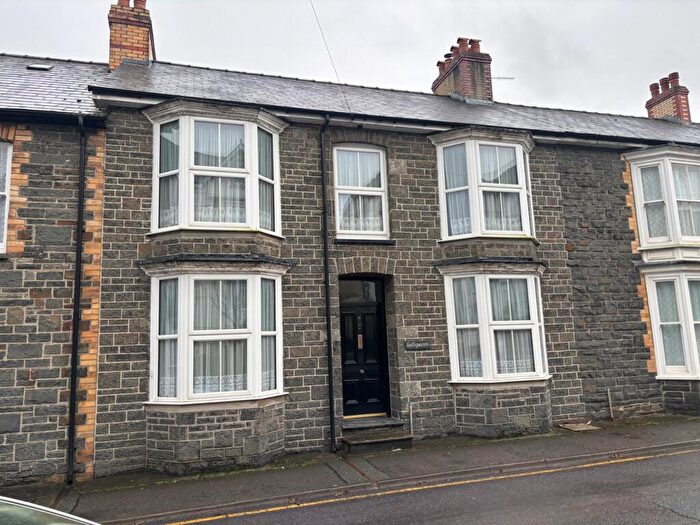
Houses for sale & to rent in Llanybydder, Lampeter
House Prices in Llanybydder
Properties in Llanybydder have an average house price of £230,042.00 and had 38 Property Transactions within the last 3 years¹.
Llanybydder is an area in Lampeter, Sir Gaerfyrddin - Carmarthenshire with 430 households², where the most expensive property was sold for £585,000.00.
Properties for sale in Llanybydder
Roads and Postcodes in Llanybydder
Navigate through our locations to find the location of your next house in Llanybydder, Lampeter for sale or to rent.
| Streets | Postcodes |
|---|---|
| Cae Coedmore | SA48 8EH |
| Cellan Road | SA48 8HT |
| Cwmann Terrace | SA48 8DR |
| Cwrt Deri | SA48 8EJ |
| Cysgod Y Coed | SA48 8DN |
| Dan Yr Allt | SA48 8EF |
| Heol Hathren | SA48 8JR |
| Heol Y Fedw | SA48 8HP |
| Nant Y Glyn | SA48 8JT |
| Treherbert Street | SA48 8EP |
| SA48 8DT SA48 8DU SA48 8DX SA48 8DY SA48 8DZ SA48 8EA SA48 8ED SA48 8EE SA48 8EL SA48 8ES SA48 8ET SA48 8EU SA48 8EW SA48 8EZ SA48 8HA SA48 8HG SA48 8HH SA48 8HQ SA48 8JN SA48 8JP SA48 8JU SA48 8JW SA32 7RT SA48 8DS SA48 8EB SA48 8EG SA48 8EN SA48 8ER SA48 8EX SA48 8EY |
Transport near Llanybydder
- FAQ
- Price Paid By Year
- Property Type Price
Frequently asked questions about Llanybydder
What is the average price for a property for sale in Llanybydder?
The average price for a property for sale in Llanybydder is £230,042. This amount is 2% lower than the average price in Lampeter. There are 207 property listings for sale in Llanybydder.
What streets have the most expensive properties for sale in Llanybydder?
The streets with the most expensive properties for sale in Llanybydder are Cae Coedmore at an average of £241,250 and Heol Y Fedw at an average of £207,500.
What streets have the most affordable properties for sale in Llanybydder?
The streets with the most affordable properties for sale in Llanybydder are Heol Hathren at an average of £130,666 and Cwrt Deri at an average of £196,500.
Which train stations are available in or near Llanybydder?
Some of the train stations available in or near Llanybydder are Llanwrda, Llangadog and Llandovery.
Property Price Paid in Llanybydder by Year
The average sold property price by year was:
| Year | Average Sold Price | Price Change |
Sold Properties
|
|---|---|---|---|
| 2025 | £305,691 | 28% |
5 Properties |
| 2024 | £220,730 | -5% |
13 Properties |
| 2023 | £232,045 | 14% |
11 Properties |
| 2022 | £199,016 | -22% |
9 Properties |
| 2021 | £242,809 | 29% |
16 Properties |
| 2020 | £171,758 | 5% |
17 Properties |
| 2019 | £163,813 | -6% |
11 Properties |
| 2018 | £174,062 | 11% |
24 Properties |
| 2017 | £155,461 | 4% |
13 Properties |
| 2016 | £148,653 | -10% |
13 Properties |
| 2015 | £164,247 | -1% |
19 Properties |
| 2014 | £165,418 | 21% |
8 Properties |
| 2013 | £130,892 | -21% |
14 Properties |
| 2012 | £158,890 | 7% |
15 Properties |
| 2011 | £148,444 | -5% |
9 Properties |
| 2010 | £155,307 | 5% |
13 Properties |
| 2009 | £146,833 | -4% |
12 Properties |
| 2008 | £152,960 | -29% |
15 Properties |
| 2007 | £197,261 | 17% |
23 Properties |
| 2006 | £163,165 | -7% |
19 Properties |
| 2005 | £174,738 | -11% |
12 Properties |
| 2004 | £194,050 | 52% |
5 Properties |
| 2003 | £93,586 | 23% |
10 Properties |
| 2002 | £72,200 | 5% |
10 Properties |
| 2001 | £68,250 | -12% |
10 Properties |
| 2000 | £76,483 | 6% |
12 Properties |
| 1999 | £71,988 | 30% |
9 Properties |
| 1998 | £50,438 | -9% |
9 Properties |
| 1997 | £55,223 | -5% |
17 Properties |
| 1996 | £58,136 | 5% |
11 Properties |
| 1995 | £55,125 | - |
6 Properties |
Property Price per Property Type in Llanybydder
Here you can find historic sold price data in order to help with your property search.
The average Property Paid Price for specific property types in the last three years are:
| Property Type | Average Sold Price | Sold Properties |
|---|---|---|
| Semi Detached House | £192,579.00 | 12 Semi Detached Houses |
| Detached House | £277,932.00 | 20 Detached Houses |
| Terraced House | £157,400.00 | 5 Terraced Houses |
| Flat | £85,000.00 | 1 Flat |

