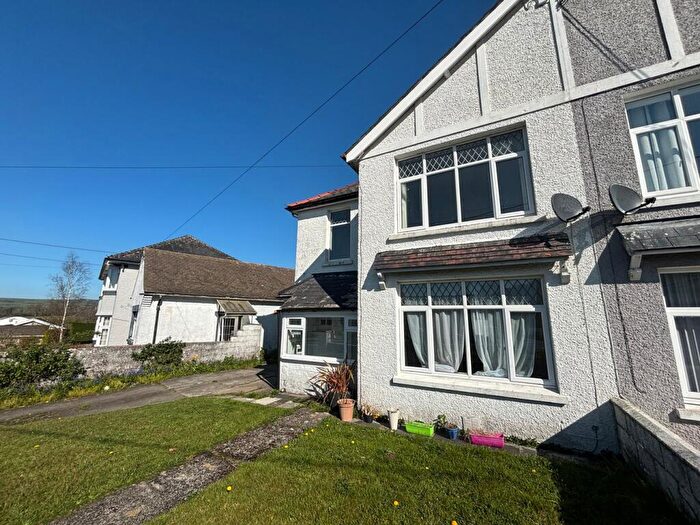
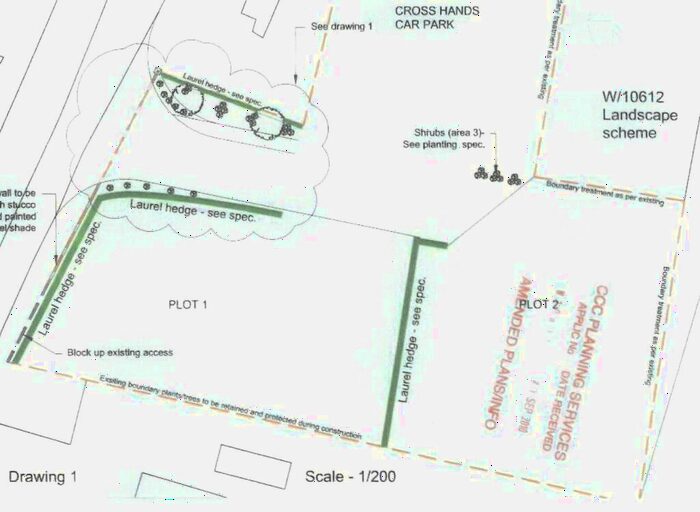
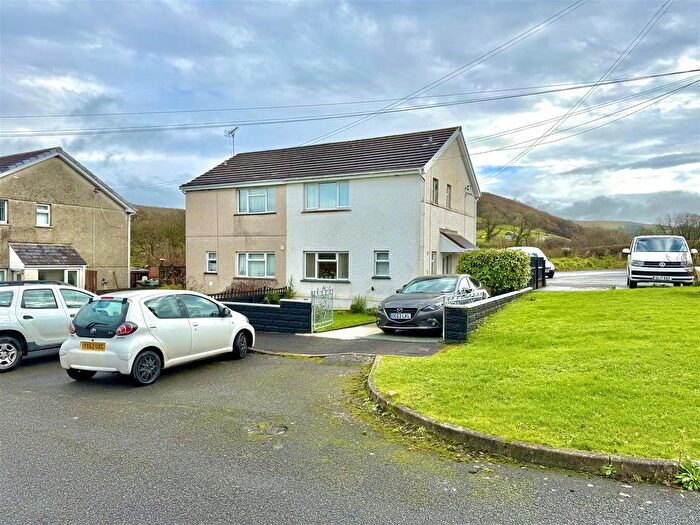
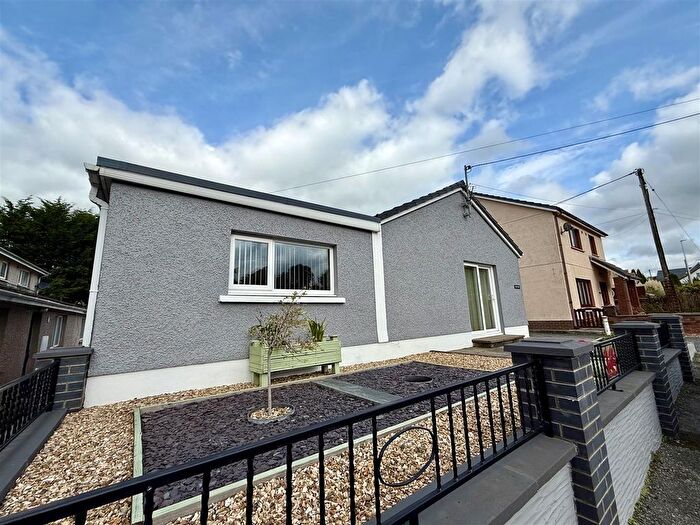
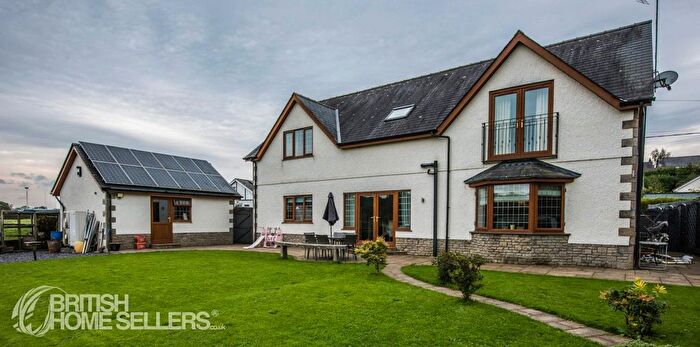
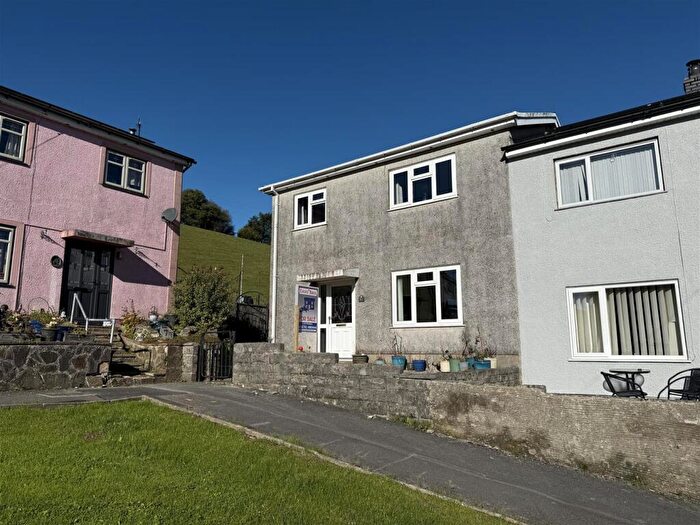
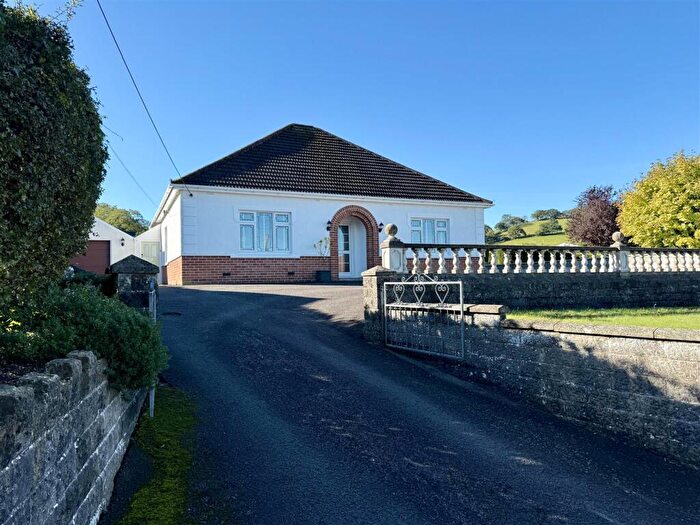
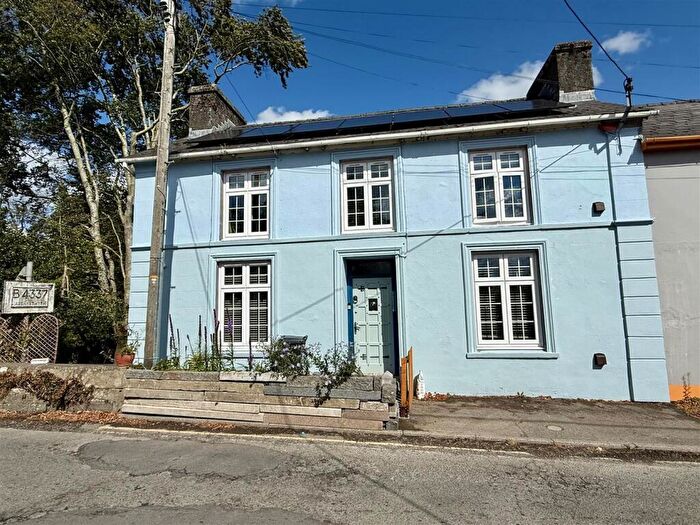
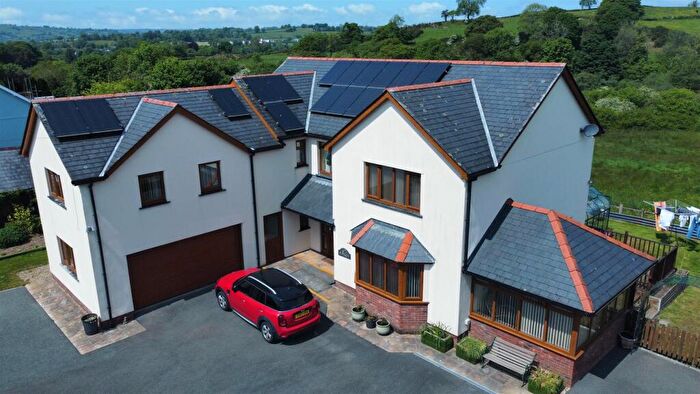
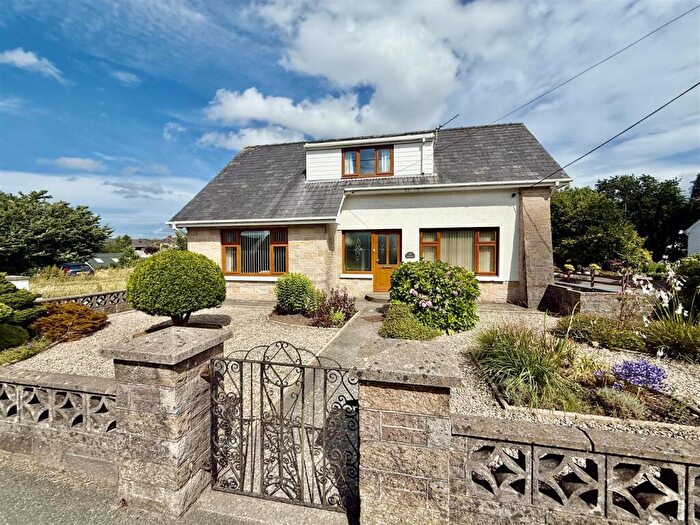
Houses for sale & to rent in Llanybydder, Llanybydder
House Prices in Llanybydder
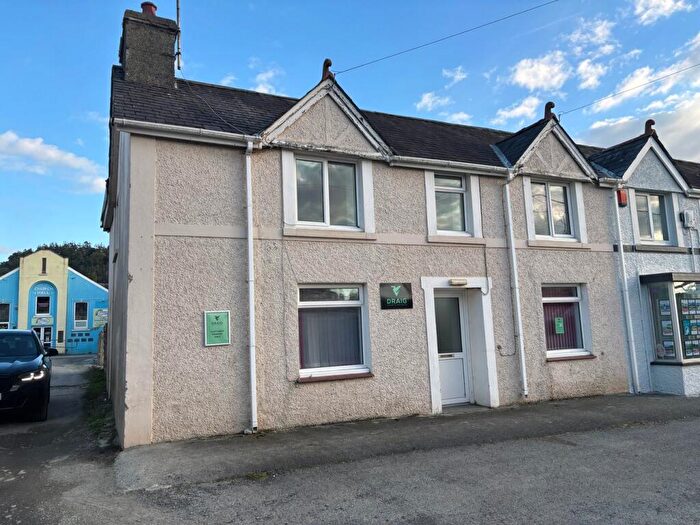
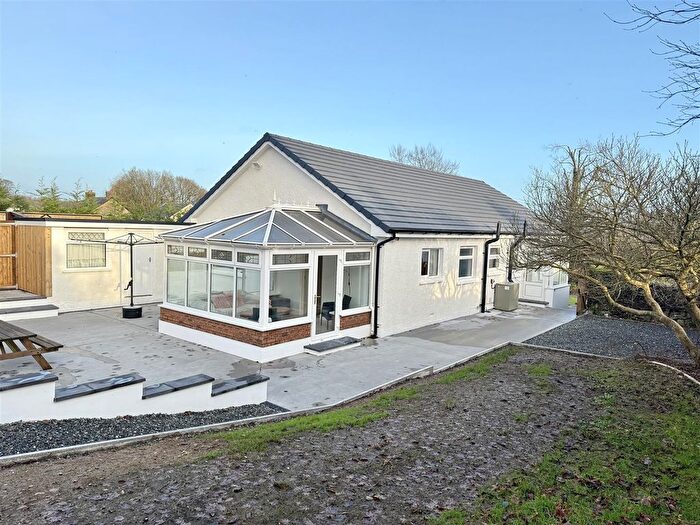
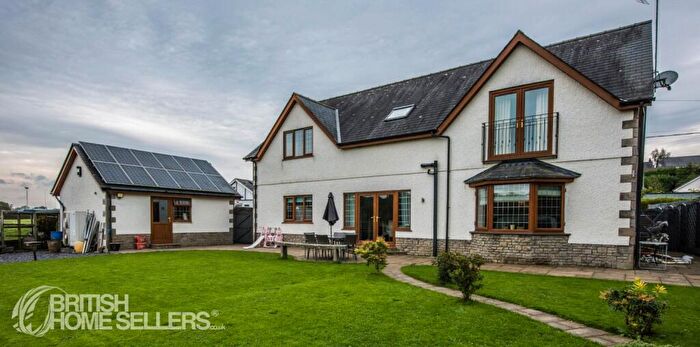
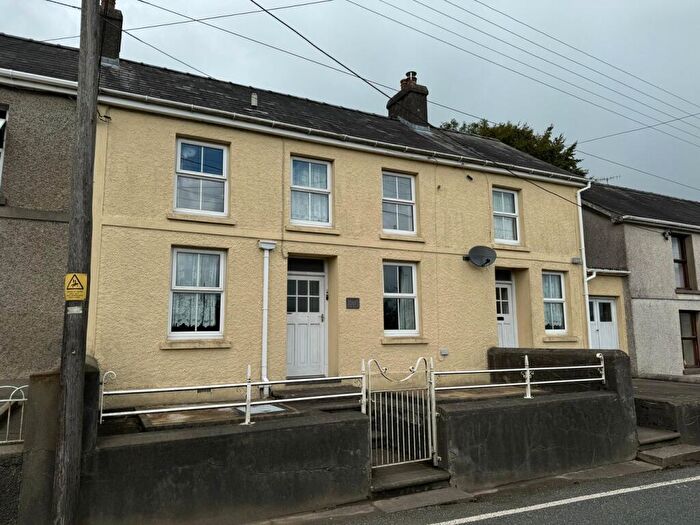
Properties in Llanybydder have an average house price of £222,925.00 and had 54 Property Transactions within the last 3 years¹.
Llanybydder is an area in Llanybydder, Sir Gaerfyrddin - Carmarthenshire with 664 households², where the most expensive property was sold for £550,000.00.
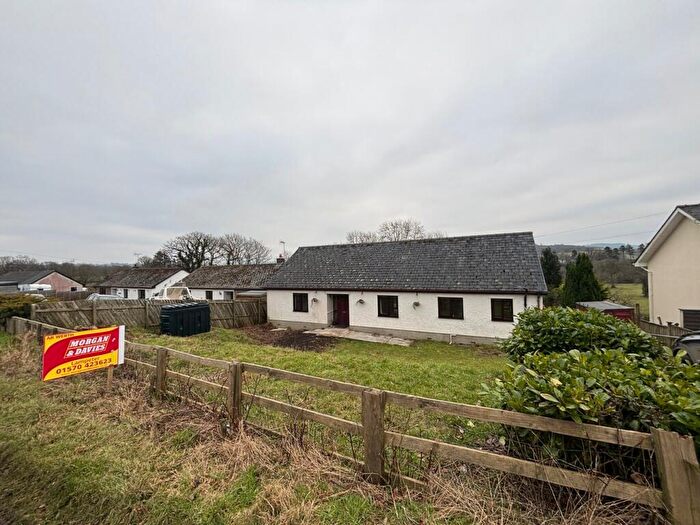
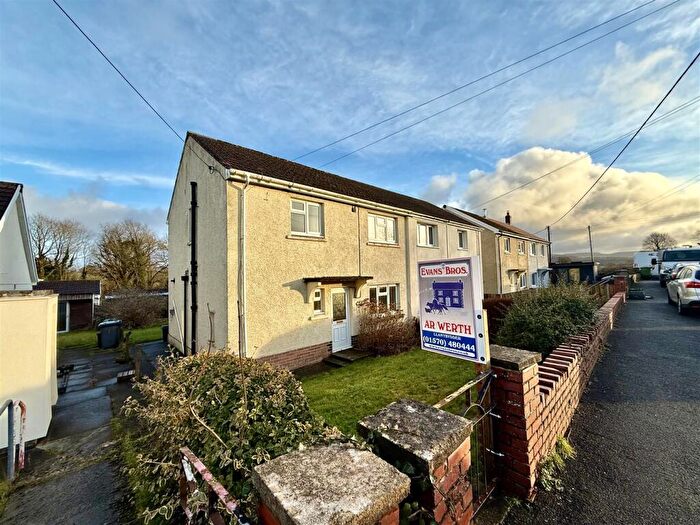
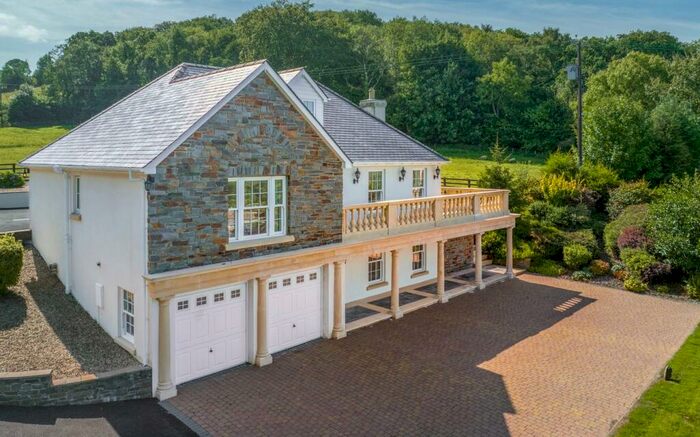
Properties for sale in Llanybydder
Previously listed properties in Llanybydder
Roads and Postcodes in Llanybydder
Navigate through our locations to find the location of your next house in Llanybydder, Llanybydder for sale or to rent.
| Streets | Postcodes |
|---|---|
| Bridge Street | SA40 9XY |
| Bro Duar | SA40 9RQ |
| Bro Einon | SA40 9RT SA40 9SF |
| Bro Rhydybont | SA40 9QT SA40 9QX |
| Cysgod Y Cwm | SA40 9AA |
| Gwynfryn Terrace | SA40 9QB |
| Heol Y Dderi | SA40 9RG SA40 9AB |
| Heol Y Gaer | SA40 9RX |
| Market Place | SA40 9UE |
| Station Terrace | SA40 9XX |
| SA40 9QA SA40 9QD SA40 9QE SA40 9QG SA40 9QJ SA40 9QL SA40 9QP SA40 9QQ SA40 9QS SA40 9QU SA40 9QZ SA40 9RA SA40 9RB SA40 9RD SA40 9RE SA40 9RL SA40 9RN SA40 9RP SA40 9RR SA40 9RS SA40 9RZ SA40 9SA SA40 9SD SA40 9TX SA40 9TY SA40 9TZ SA40 9UB SA40 9UD SA40 9XP SA40 9XS SA40 9QN SA40 9QR SA40 9RF SA40 9RU SA40 9SE SA40 9UA SA40 9XT |
Transport near Llanybydder
- FAQ
- Price Paid By Year
- Property Type Price
Frequently asked questions about Llanybydder
What is the average price for a property for sale in Llanybydder?
The average price for a property for sale in Llanybydder is £222,925. This amount is 0.7% lower than the average price in Llanybydder. There are 164 property listings for sale in Llanybydder.
What streets have the most expensive properties for sale in Llanybydder?
The streets with the most expensive properties for sale in Llanybydder are Heol Y Gaer at an average of £163,833 and Bro Einon at an average of £119,666.
What streets have the most affordable properties for sale in Llanybydder?
The streets with the most affordable properties for sale in Llanybydder are Bridge Street at an average of £58,000 and Station Terrace at an average of £68,500.
Which train stations are available in or near Llanybydder?
Some of the train stations available in or near Llanybydder are Llanwrda, Llangadog and Llandeilo.
Property Price Paid in Llanybydder by Year
The average sold property price by year was:
| Year | Average Sold Price | Price Change |
Sold Properties
|
|---|---|---|---|
| 2025 | £255,500 | 15% |
5 Properties |
| 2024 | £216,000 | 9% |
17 Properties |
| 2023 | £196,041 | -21% |
12 Properties |
| 2022 | £236,800 | 31% |
20 Properties |
| 2021 | £163,156 | -3% |
28 Properties |
| 2020 | £167,925 | 21% |
8 Properties |
| 2019 | £132,583 | -26% |
24 Properties |
| 2018 | £167,033 | 7% |
28 Properties |
| 2017 | £155,794 | 18% |
17 Properties |
| 2016 | £128,523 | 0,3% |
21 Properties |
| 2015 | £128,140 | -10% |
25 Properties |
| 2014 | £140,897 | 4% |
20 Properties |
| 2013 | £135,615 | 12% |
13 Properties |
| 2012 | £119,211 | -29% |
13 Properties |
| 2011 | £153,666 | 13% |
9 Properties |
| 2010 | £133,421 | 3% |
7 Properties |
| 2009 | £129,000 | 3% |
8 Properties |
| 2008 | £125,700 | -41% |
17 Properties |
| 2007 | £177,671 | 26% |
16 Properties |
| 2006 | £130,733 | -10% |
15 Properties |
| 2005 | £144,347 | 24% |
20 Properties |
| 2004 | £109,647 | 24% |
27 Properties |
| 2003 | £83,429 | 22% |
23 Properties |
| 2002 | £64,779 | 10% |
34 Properties |
| 2001 | £58,072 | 6% |
24 Properties |
| 2000 | £54,326 | -9% |
16 Properties |
| 1999 | £59,409 | 2% |
11 Properties |
| 1998 | £58,343 | 29% |
16 Properties |
| 1997 | £41,520 | 14% |
12 Properties |
| 1996 | £35,643 | -33% |
13 Properties |
| 1995 | £47,300 | - |
5 Properties |
Property Price per Property Type in Llanybydder
Here you can find historic sold price data in order to help with your property search.
The average Property Paid Price for specific property types in the last three years are:
| Property Type | Average Sold Price | Sold Properties |
|---|---|---|
| Semi Detached House | £164,673.00 | 23 Semi Detached Houses |
| Detached House | £294,076.00 | 26 Detached Houses |
| Terraced House | £120,900.00 | 5 Terraced Houses |

