
Houses for sale & to rent in Llannon, Llanelli
House Prices in Llannon
Properties in Llannon have an average house price of £196,506.00 and had 267 Property Transactions within the last 3 years¹.
Llannon is an area in Llanelli, Sir Gaerfyrddin - Carmarthenshire with 2,163 households², where the most expensive property was sold for £615,000.00.
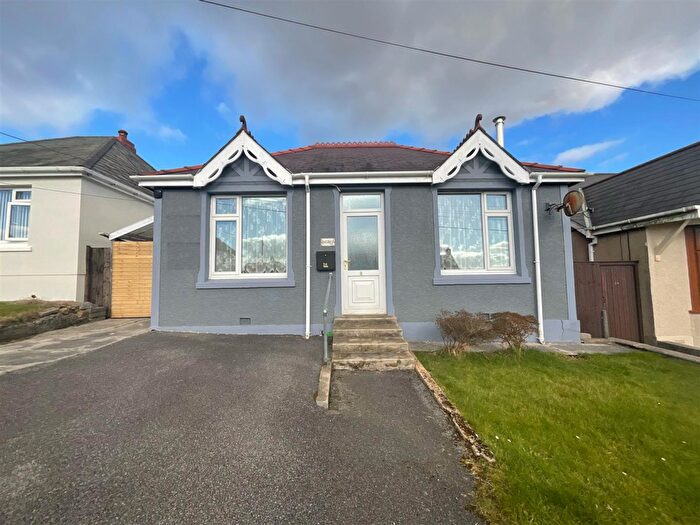
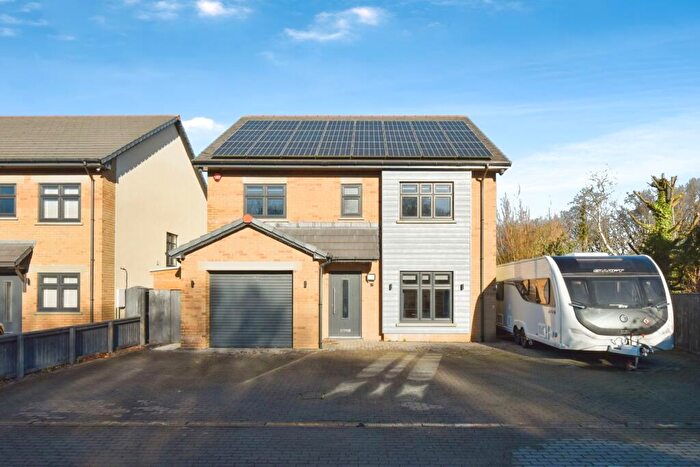
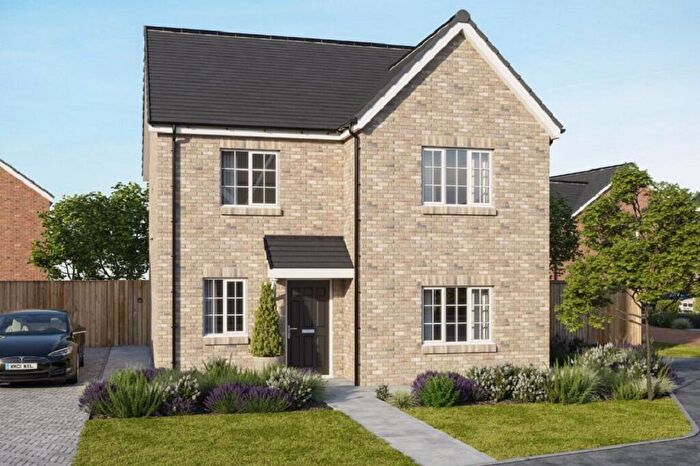
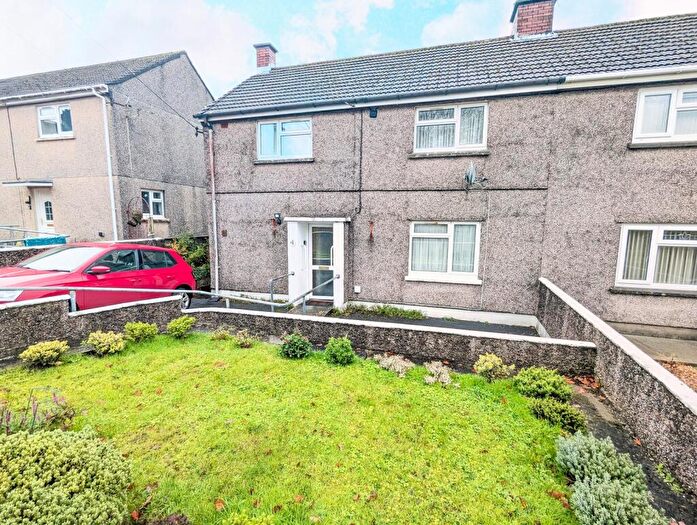
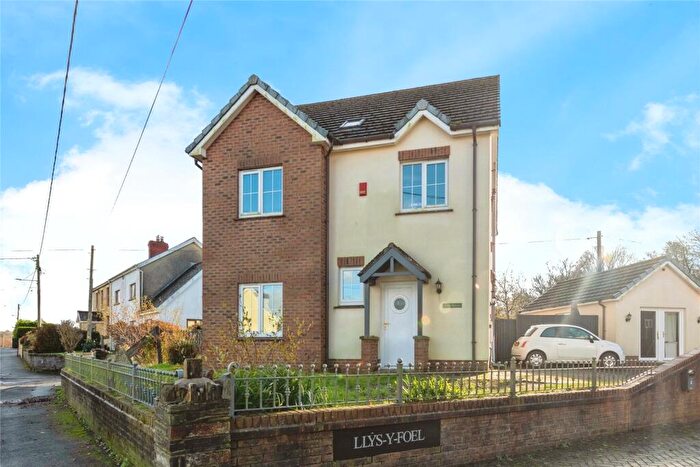
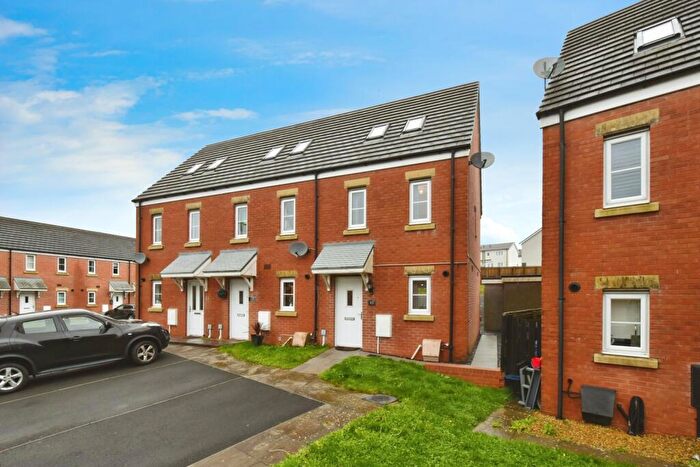
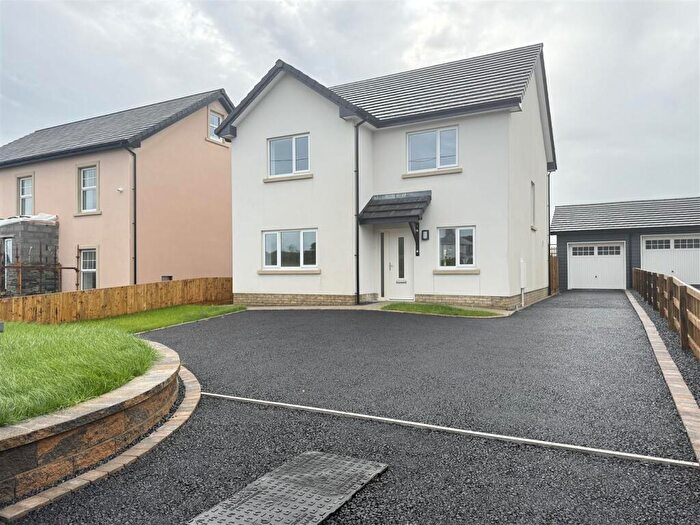
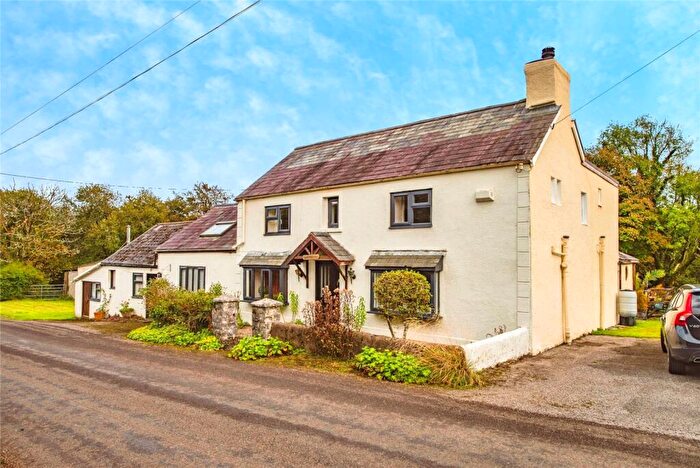
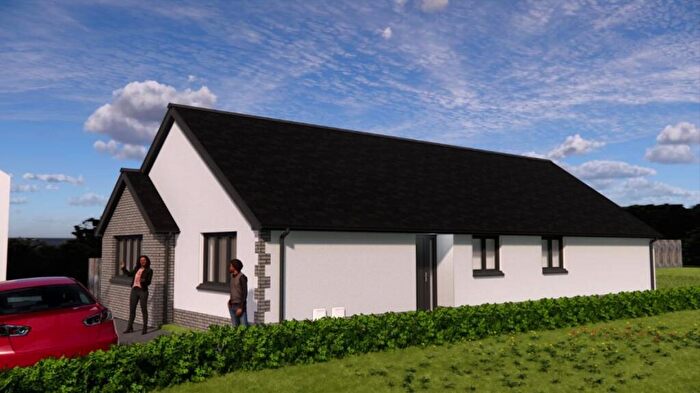
Properties for sale in Llannon
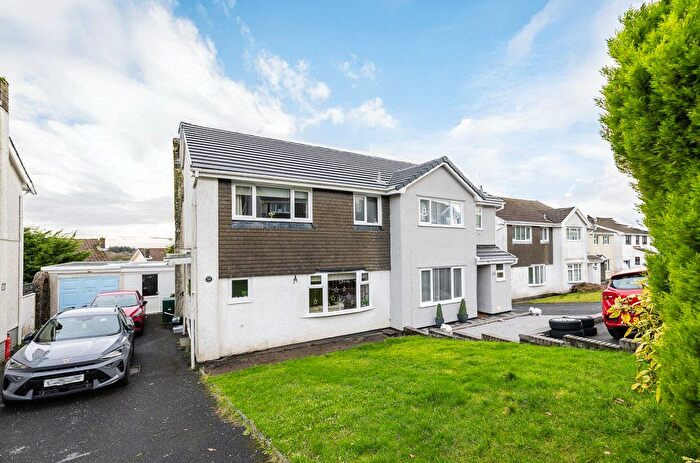
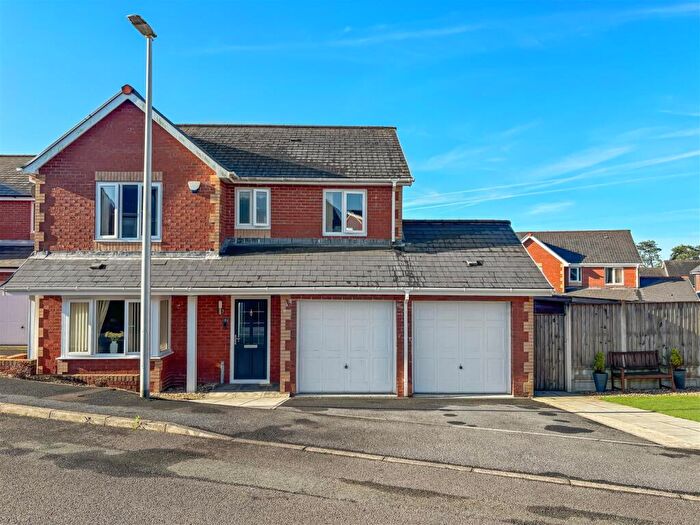
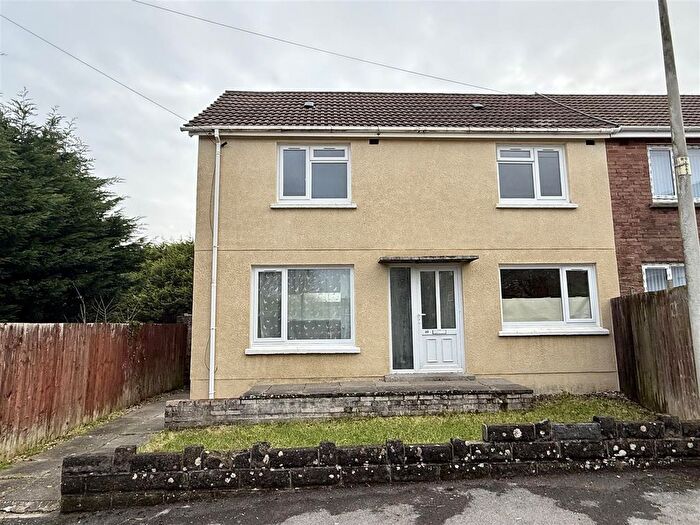
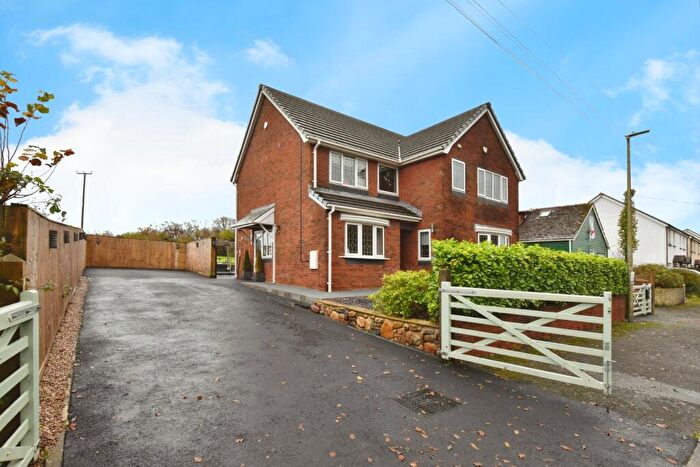
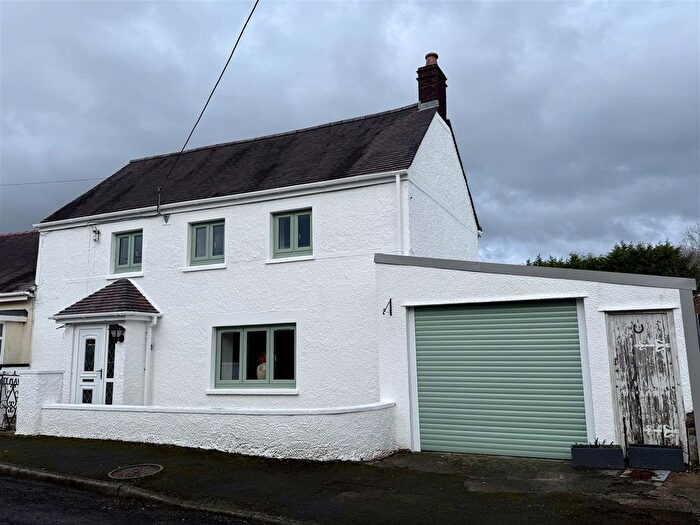
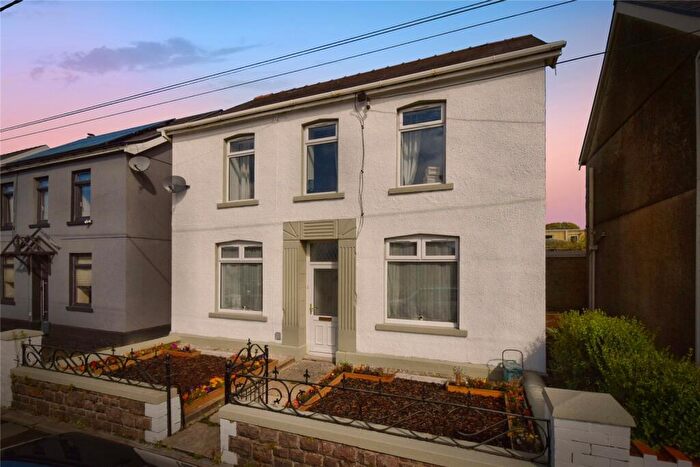
![]()
If you are looking to sell your house, let it out, or receive a property valuation, an expert can help you.
Click the button below to get started.
Roads and Postcodes in Llannon
Navigate through our locations to find the location of your next house in Llannon, Llanelli for sale or to rent.
Transport near Llannon

- FAQ
- Price Paid By Year
- Property Type Price
Frequently asked questions about Llannon
What is the average price for a property for sale in Llannon?
The average price for a property for sale in Llannon is £196,506. This amount is 9% higher than the average price in Llanelli. There are 1,347 property listings for sale in Llannon.
What streets have the most expensive properties for sale in Llannon?
The streets with the most expensive properties for sale in Llannon are Waungoch at an average of £397,500, Heol Y Nant at an average of £371,750 and Maes Y Ffynnon at an average of £370,500.
What streets have the most affordable properties for sale in Llannon?
The streets with the most affordable properties for sale in Llannon are High Street at an average of £105,355, Troed Y Bryn at an average of £110,000 and Maesgwern at an average of £122,475.
Which train stations are available in or near Llannon?
Some of the train stations available in or near Llannon are Pantyffynnon, Ammanford and Pontarddulais.
Property Price Paid in Llannon by Year
The average sold property price by year was:
| Year | Average Sold Price | Price Change |
Sold Properties
|
|---|---|---|---|
| 2025 | £198,460 | 7% |
53 Properties |
| 2024 | £184,129 | -3% |
76 Properties |
| 2023 | £189,194 | -14% |
68 Properties |
| 2022 | £215,569 | 17% |
70 Properties |
| 2021 | £179,304 | 11% |
92 Properties |
| 2020 | £159,739 | 15% |
77 Properties |
| 2019 | £135,508 | -8% |
79 Properties |
| 2018 | £146,155 | 9% |
94 Properties |
| 2017 | £132,897 | -3% |
98 Properties |
| 2016 | £137,011 | 1% |
79 Properties |
| 2015 | £135,727 | -4% |
88 Properties |
| 2014 | £140,944 | 12% |
91 Properties |
| 2013 | £123,522 | 11% |
60 Properties |
| 2012 | £109,773 | 1% |
43 Properties |
| 2011 | £108,948 | -12% |
44 Properties |
| 2010 | £121,747 | -18% |
45 Properties |
| 2009 | £143,910 | 11% |
34 Properties |
| 2008 | £128,665 | 0,3% |
53 Properties |
| 2007 | £128,264 | -4% |
99 Properties |
| 2006 | £132,842 | 5% |
105 Properties |
| 2005 | £126,680 | 20% |
68 Properties |
| 2004 | £101,708 | 5% |
85 Properties |
| 2003 | £96,784 | 34% |
134 Properties |
| 2002 | £63,720 | 25% |
105 Properties |
| 2001 | £47,988 | 8% |
85 Properties |
| 2000 | £43,991 | -38% |
67 Properties |
| 1999 | £60,858 | 27% |
66 Properties |
| 1998 | £44,440 | 10% |
55 Properties |
| 1997 | £39,959 | 9% |
52 Properties |
| 1996 | £36,517 | 3% |
53 Properties |
| 1995 | £35,306 | - |
41 Properties |
Property Price per Property Type in Llannon
Here you can find historic sold price data in order to help with your property search.
The average Property Paid Price for specific property types in the last three years are:
| Property Type | Average Sold Price | Sold Properties |
|---|---|---|
| Semi Detached House | £163,905.00 | 120 Semi Detached Houses |
| Detached House | £287,171.00 | 90 Detached Houses |
| Terraced House | £121,986.00 | 57 Terraced Houses |