
Houses for sale & to rent in Llanelli, Sir Gaerfyrddin - Carmarthenshire
House Prices in Llanelli
Properties in Llanelli have an average house price of £184k and had 2,803 Property Transactions within the last 3 years.¹
Llanelli is an area in Sir Gaerfyrddin - Carmarthenshire with 30,329 households², where the most expensive property was sold for £870k.
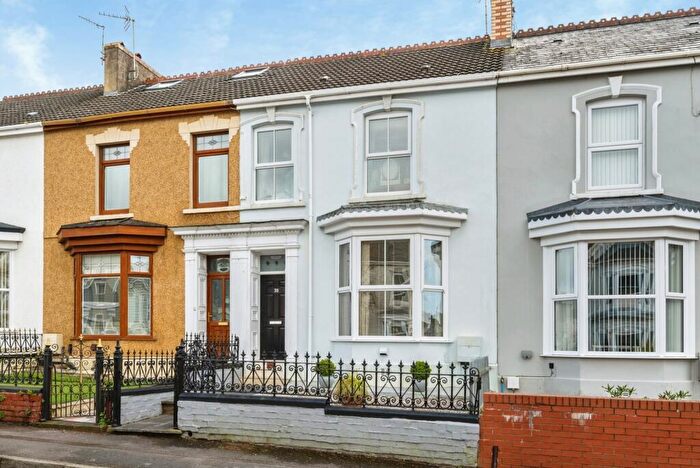
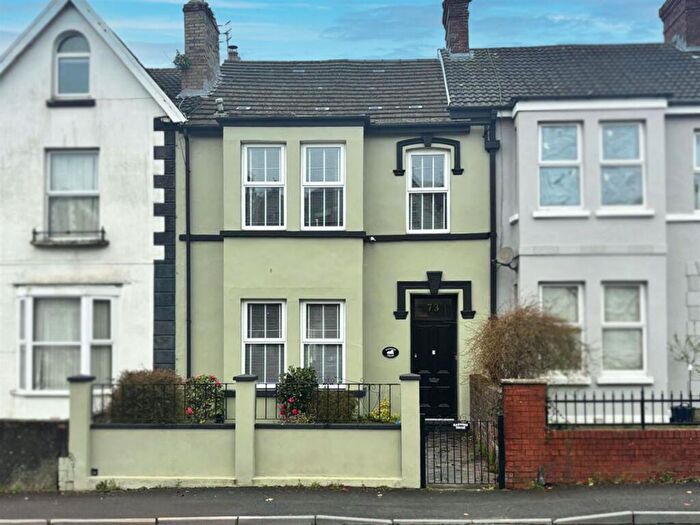
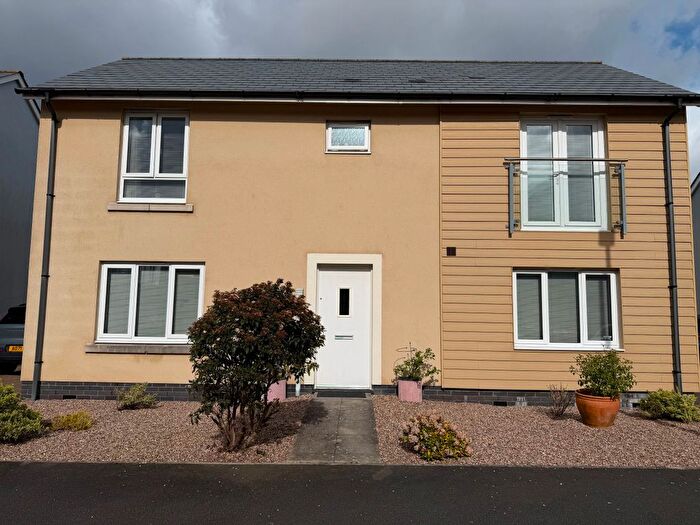
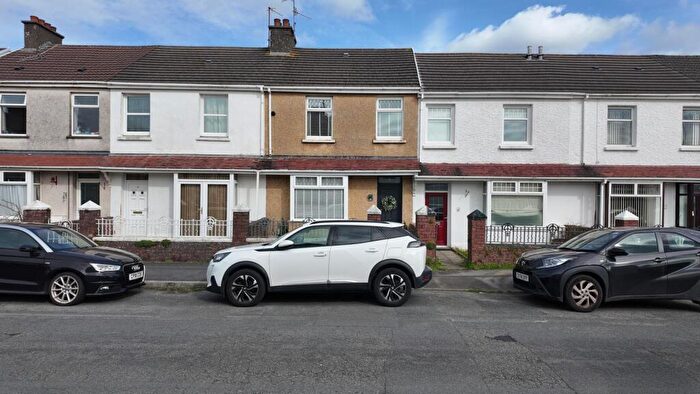
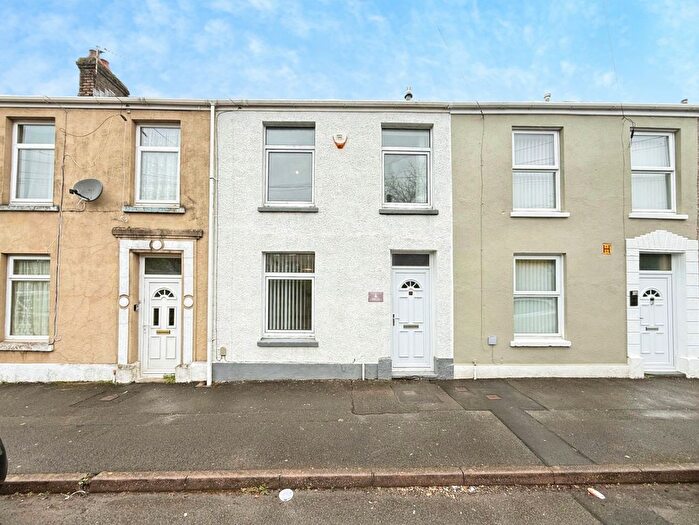
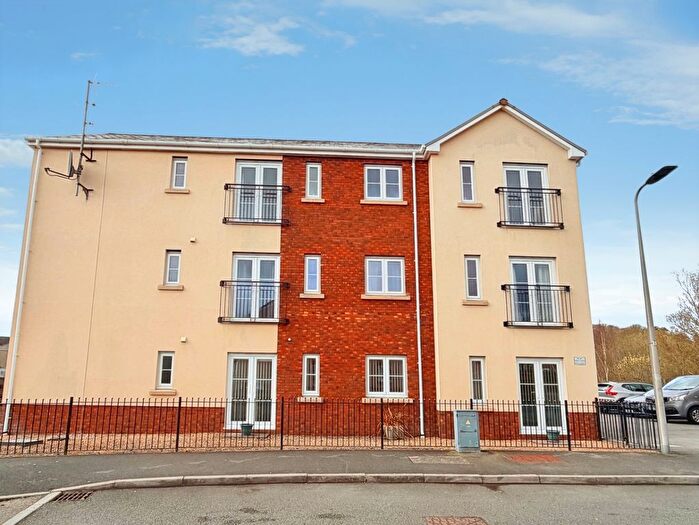
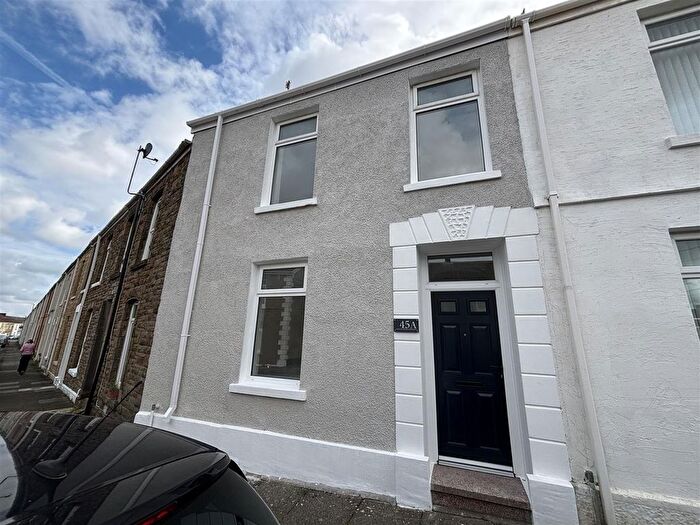
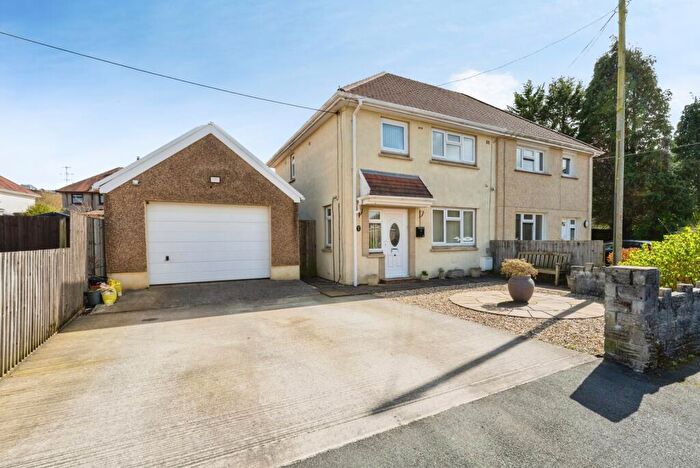
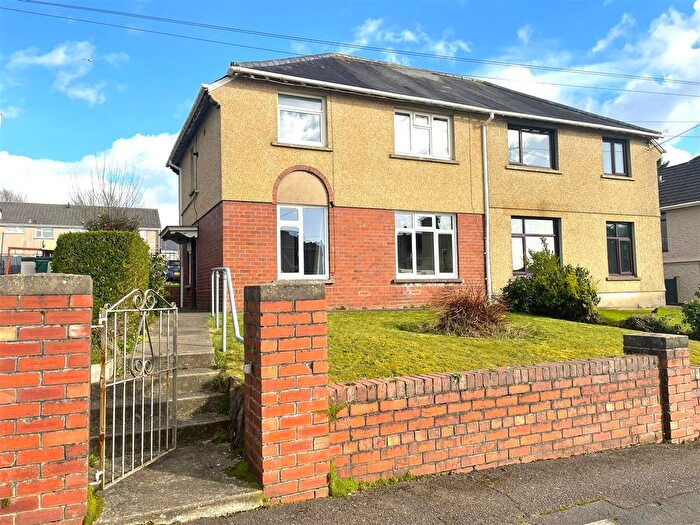
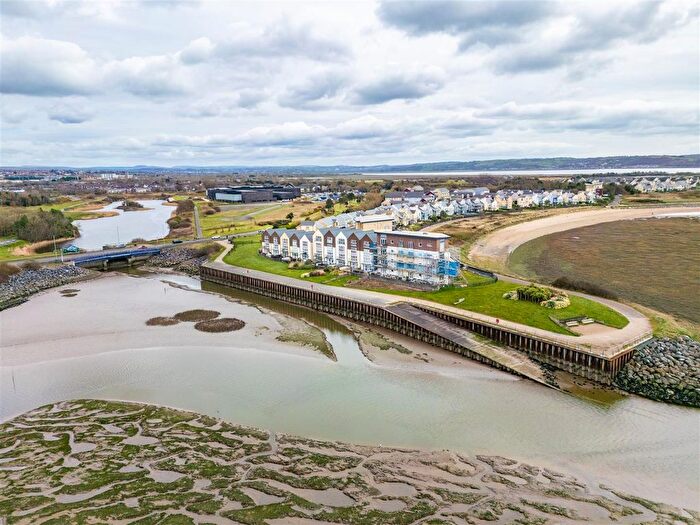
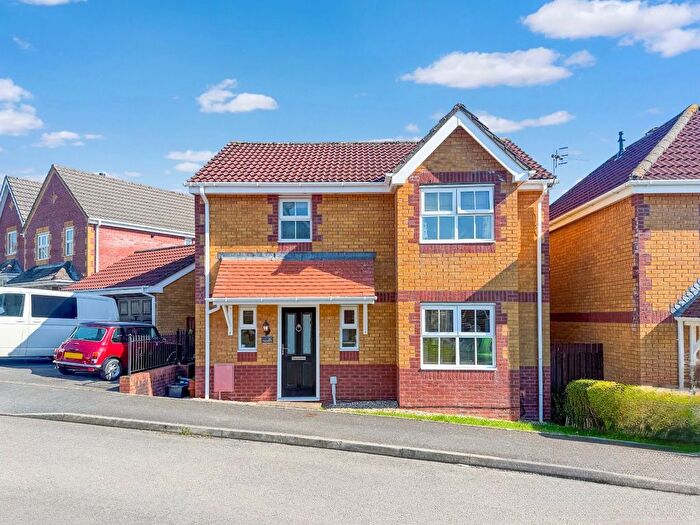
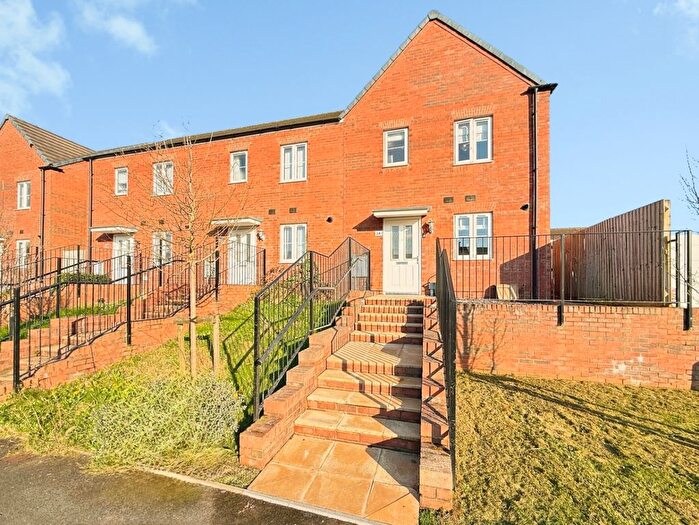
Properties for sale in Llanelli
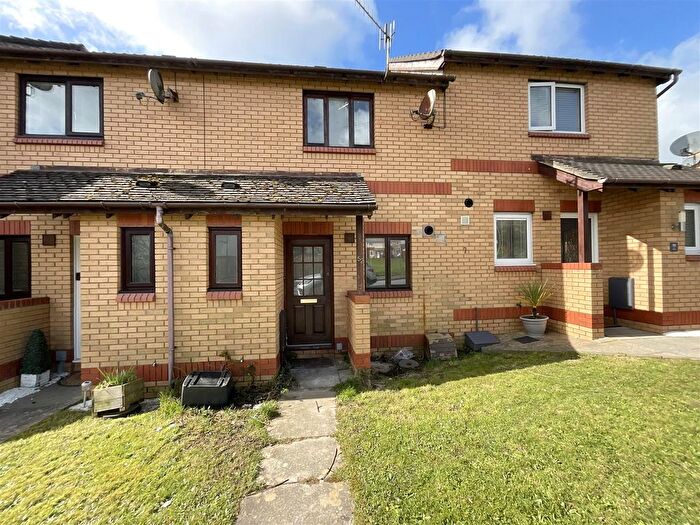
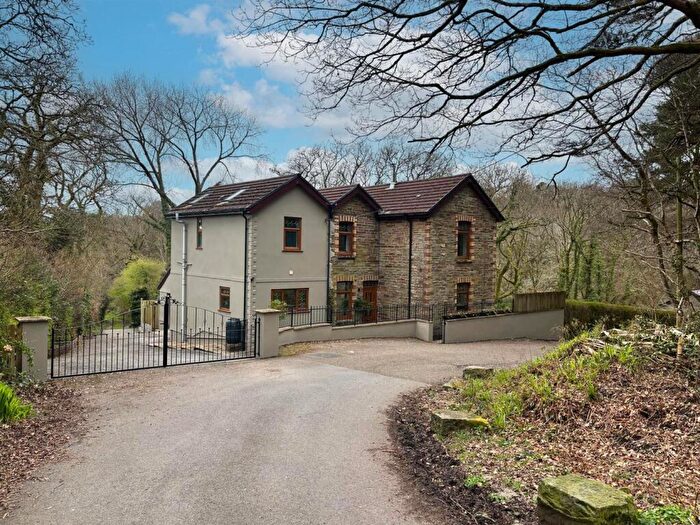
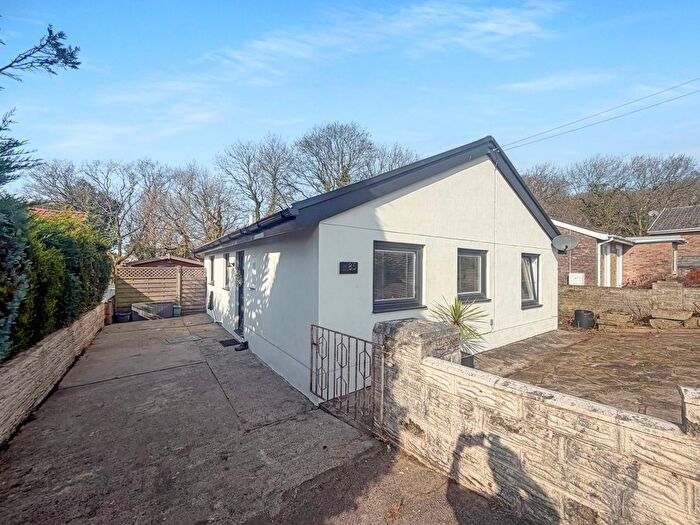
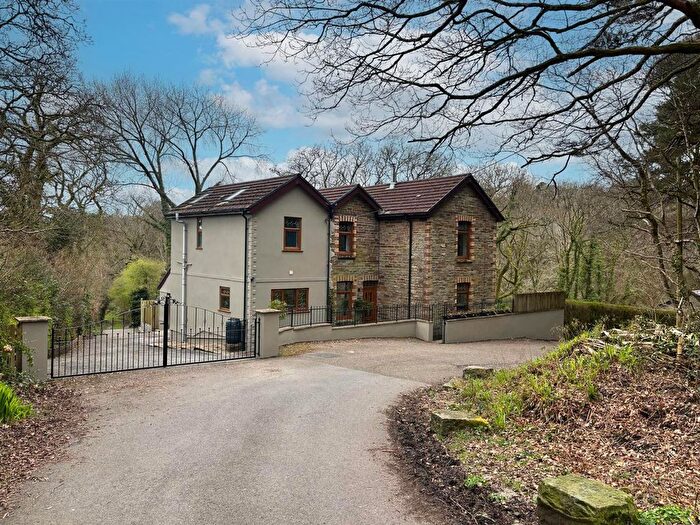
![]()
If you are looking to sell your house, let it out, or receive a property valuation, an expert can help you.
Click the button below to get started.


Neighbourhoods in Llanelli
Navigate through our locations to find the location of your next house in Llanelli, Sir Gaerfyrddin - Carmarthenshire for sale or to rent.
Transport in Llanelli
Please see below transportation links in this area:

- FAQ
- Price Paid By Year
- Property Type Price
Frequently asked questions about Llanelli
What is the average price for a property for sale in Llanelli?
The average price for a property for sale in Llanelli is £183,585. This amount is 12% lower than the average price in Sir Gaerfyrddin - Carmarthenshire. There are more than 10,000 property listings for sale in Llanelli.
What locations have the most expensive properties for sale in Llanelli?
The locations with the most expensive properties for sale in Llanelli are Llanfihangel Aberbythych at an average of £275,805, Trimsaran at an average of £268,605 and Llanddarog at an average of £257,000.
What locations have the most affordable properties for sale in Llanelli?
The locations with the most affordable properties for sale in Llanelli are Tyisha at an average of £108,761, Felinfoel at an average of £141,066 and Bigyn at an average of £141,407.
Which train stations are available in or near Llanelli?
Some of the train stations available in or near Llanelli are Llanelli, Llangennech and Bynea.
Property Price Paid in Llanelli by Year
The average sold property price by year was:
| Year | Average Sold Price | Price Change |
Sold Properties
|
|---|---|---|---|
| 2026 | £205,789 | 9% |
19 Properties |
| 2025 | £187,166 | 2% |
829 Properties |
| 2024 | £183,300 | 2% |
1,009 Properties |
| 2023 | £180,304 | 3% |
946 Properties |
| 2022 | £175,119 | 8% |
1,167 Properties |
| 2021 | £160,513 | 9% |
1,323 Properties |
| 2020 | £145,376 | 4% |
953 Properties |
| 2019 | £140,077 | 1% |
1,325 Properties |
| 2018 | £138,435 | 6% |
1,261 Properties |
| 2017 | £130,515 | 1% |
1,256 Properties |
| 2016 | £129,756 | -1% |
1,210 Properties |
| 2015 | £130,441 | 1% |
1,081 Properties |
| 2014 | £128,847 | 4% |
1,171 Properties |
| 2013 | £123,543 | -0,2% |
858 Properties |
| 2012 | £123,805 | 2% |
699 Properties |
| 2011 | £121,451 | -0,1% |
674 Properties |
| 2010 | £121,620 | -5% |
707 Properties |
| 2009 | £127,829 | -3% |
598 Properties |
| 2008 | £131,057 | -7% |
677 Properties |
| 2007 | £140,043 | 10% |
1,370 Properties |
| 2006 | £126,415 | 6% |
1,556 Properties |
| 2005 | £119,156 | 13% |
1,161 Properties |
| 2004 | £103,871 | 25% |
1,279 Properties |
| 2003 | £78,349 | 26% |
1,415 Properties |
| 2002 | £57,612 | 13% |
1,355 Properties |
| 2001 | £50,082 | 7% |
1,150 Properties |
| 2000 | £46,699 | 3% |
1,065 Properties |
| 1999 | £45,110 | 4% |
856 Properties |
| 1998 | £43,507 | 5% |
893 Properties |
| 1997 | £41,132 | 2% |
924 Properties |
| 1996 | £40,316 | 4% |
840 Properties |
| 1995 | £38,541 | - |
689 Properties |
Property Price per Property Type in Llanelli
Here you can find historic sold price data in order to help with your property search.
The average Property Paid Price for specific property types in the last three years are:
| Property Type | Average Sold Price | Sold Properties |
|---|---|---|
| Semi Detached House | £169,701.00 | 1,035 Semi Detached Houses |
| Terraced House | £128,908.00 | 1,039 Terraced Houses |
| Detached House | £290,953.00 | 692 Detached Houses |
| Flat | £99,243.00 | 37 Flats |