Houses for sale & to rent in Flint Castle, Flint
House Prices in Flint Castle
Properties in Flint Castle have an average house price of £131,207.00 and had 65 Property Transactions within the last 3 years¹.
Flint Castle is an area in Flint, Sir y Fflint - Flintshire with 891 households², where the most expensive property was sold for £250,000.00.
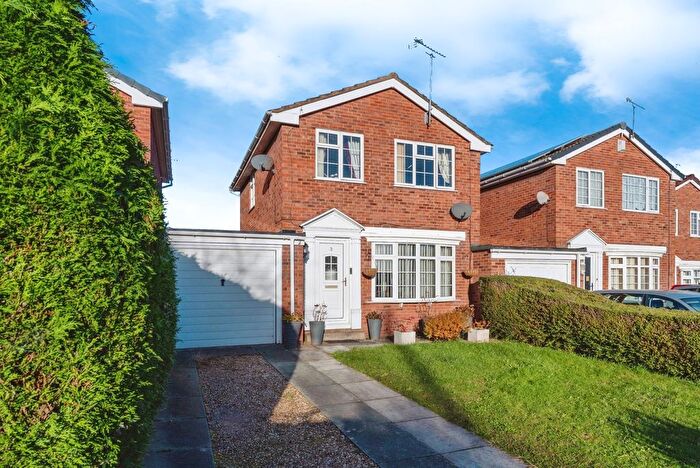
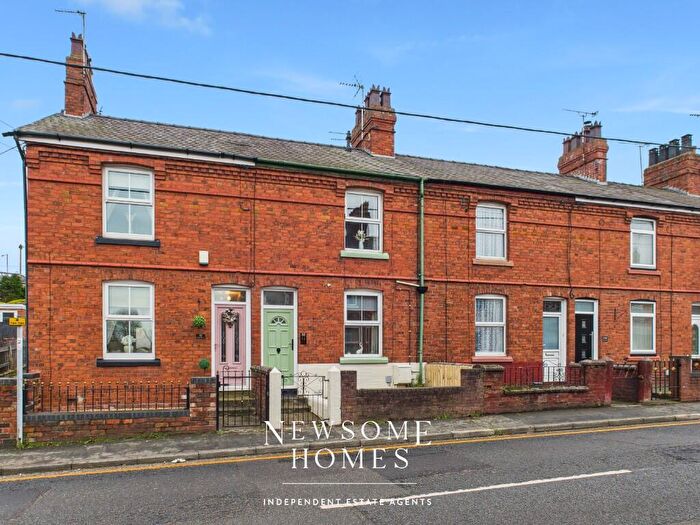
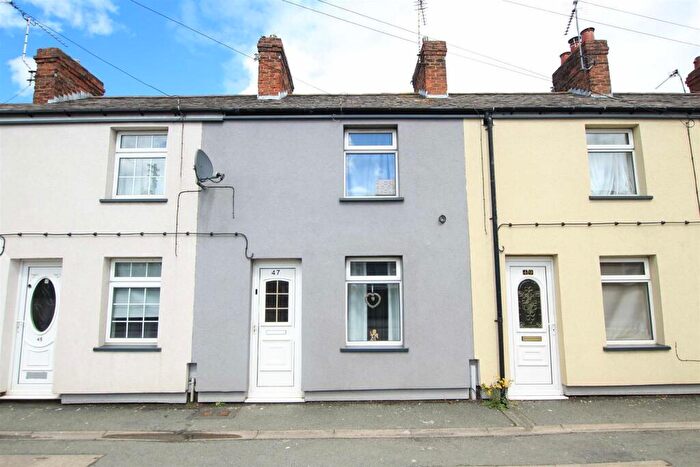
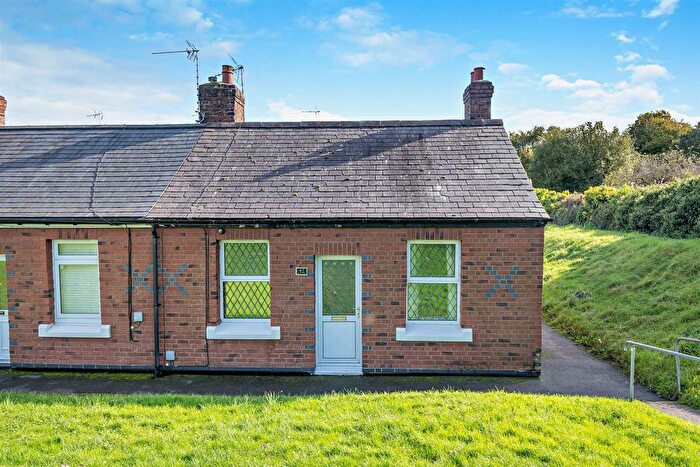
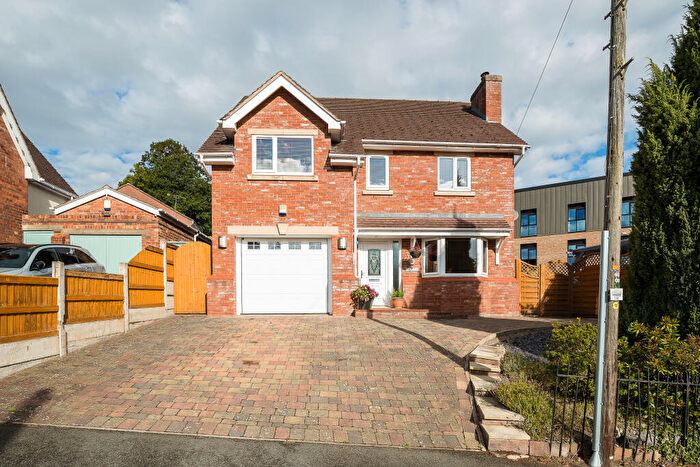
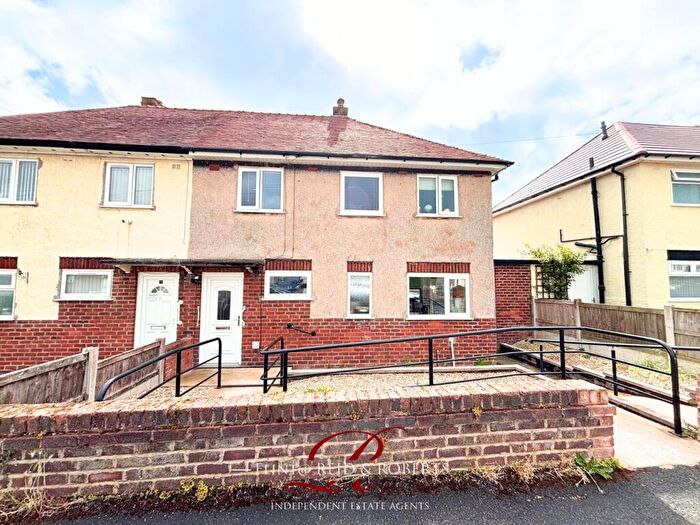
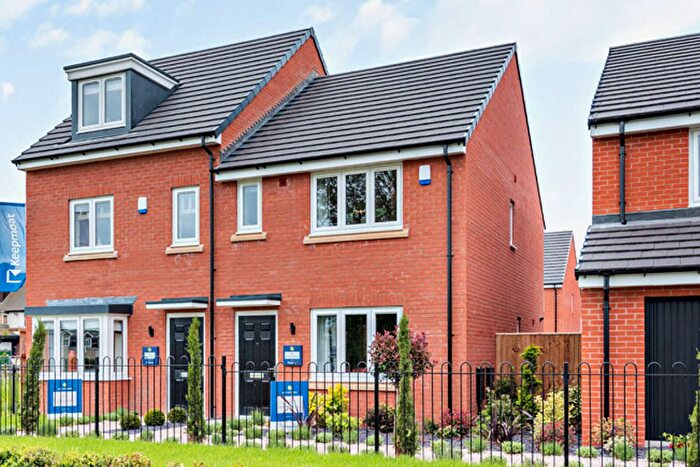
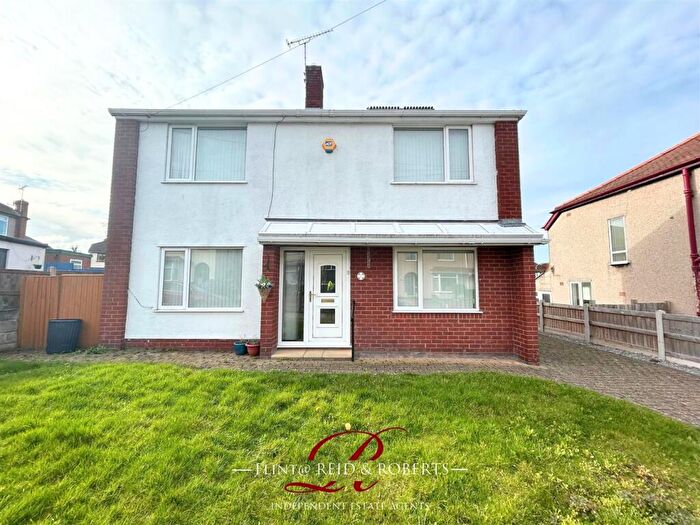
Properties for sale in Flint Castle
Roads and Postcodes in Flint Castle
Navigate through our locations to find the location of your next house in Flint Castle, Flint for sale or to rent.
| Streets | Postcodes |
|---|---|
| Barons Close | CH6 5DQ |
| Bodhyfryd | CH6 5BE |
| Borough Grove | CH6 5DR CH6 5DS |
| Castle Dyke Street | CH6 5PE |
| Castle Heights | CH6 5NA CH6 5NG |
| Castle Park Industrial Estate | CH6 5XA |
| Castle Road | CH6 5PH |
| Castle Street | CH6 5PF |
| Centenary Square | CH6 5AZ |
| Chapel Street | CH6 5AY CH6 5BD |
| Chester Road | CH6 5DT |
| Chester Street | CH6 5DH CH6 5BL CH6 5NR |
| Church Street | CH6 5AD CH6 5AJ |
| Corporation Street | CH6 5PG |
| Dee Cottages | CH6 5PT |
| Duke Street | CH6 5DJ CH6 5GR |
| Evans Street | CH6 5NT CH6 5AX |
| Gwynedd Drive | CH6 5DP |
| Henry Taylor Street | CH6 5PP CH6 5PR CH6 5PS |
| Knights Green | CH6 5DE CH6 5DF CH6 5DG |
| Lloyd Street | CH6 5PD |
| Lower Mumforth Street | CH6 5GE |
| Lower Sydney Street | CH6 5FB |
| Maes Y Dre Avenue | CH6 5JE CH6 5JF |
| Market Square | CH6 5NW |
| Marsh Lane | CH6 5PJ |
| New Roskell Square | CH6 5PQ |
| New Swan Lane | CH6 5FF |
| Park Avenue | CH6 5DN CH6 5DW |
| Perrins Walk | CH6 5BX |
| Prince Of Wales Avenue | CH6 5DL CH6 5JT |
| Princes Street | CH6 5SQ |
| Queen Elizabeth Court | CH6 5FG |
| Queen Street | CH6 5DD |
| Salisbury Street | CH6 5NX |
| St Catherines Close | CH6 5NY |
| St Marys Walk | CH6 5FD |
| Swan Street | CH6 5BP |
| Sydney Street | CH6 5FE |
| Sydney Walk | CH6 5LA |
| Thomas Street | CH6 5NU |
| Trelawney Avenue | CH6 5JD |
| Trelawney Square | CH6 5NN |
| CH6 5AS CH6 5UZ |
Transport near Flint Castle
- FAQ
- Price Paid By Year
- Property Type Price
Frequently asked questions about Flint Castle
What is the average price for a property for sale in Flint Castle?
The average price for a property for sale in Flint Castle is £131,207. This amount is 31% lower than the average price in Flint. There are 621 property listings for sale in Flint Castle.
What streets have the most expensive properties for sale in Flint Castle?
The streets with the most expensive properties for sale in Flint Castle are Bodhyfryd at an average of £250,000, Gwynedd Drive at an average of £203,750 and Trelawney Avenue at an average of £155,000.
What streets have the most affordable properties for sale in Flint Castle?
The streets with the most affordable properties for sale in Flint Castle are Lloyd Street at an average of £88,000, Thomas Street at an average of £93,333 and Chester Street at an average of £100,000.
Which train stations are available in or near Flint Castle?
Some of the train stations available in or near Flint Castle are Flint, Neston and Shotton.
Property Price Paid in Flint Castle by Year
The average sold property price by year was:
| Year | Average Sold Price | Price Change |
Sold Properties
|
|---|---|---|---|
| 2025 | £140,277 | 5% |
9 Properties |
| 2024 | £132,722 | -4% |
18 Properties |
| 2023 | £137,633 | 11% |
15 Properties |
| 2022 | £122,282 | 8% |
23 Properties |
| 2021 | £111,950 | 7% |
20 Properties |
| 2020 | £103,992 | -5% |
12 Properties |
| 2019 | £109,166 | 14% |
21 Properties |
| 2018 | £93,475 | -6% |
20 Properties |
| 2017 | £98,711 | 16% |
26 Properties |
| 2016 | £82,846 | -17% |
13 Properties |
| 2015 | £96,970 | 3% |
17 Properties |
| 2014 | £93,875 | 4% |
12 Properties |
| 2013 | £90,269 | 4% |
13 Properties |
| 2012 | £86,433 | -7% |
12 Properties |
| 2011 | £92,653 | -10% |
13 Properties |
| 2010 | £101,832 | 21% |
6 Properties |
| 2009 | £80,388 | -66% |
9 Properties |
| 2008 | £133,050 | 15% |
10 Properties |
| 2007 | £112,749 | -0,1% |
26 Properties |
| 2006 | £112,871 | 11% |
35 Properties |
| 2005 | £99,891 | 16% |
30 Properties |
| 2004 | £84,071 | 7% |
35 Properties |
| 2003 | £78,355 | 49% |
39 Properties |
| 2002 | £40,197 | 2% |
34 Properties |
| 2001 | £39,242 | 17% |
32 Properties |
| 2000 | £32,602 | 4% |
24 Properties |
| 1999 | £31,188 | -3% |
13 Properties |
| 1998 | £32,196 | 13% |
14 Properties |
| 1997 | £27,873 | -10% |
16 Properties |
| 1996 | £30,732 | -15% |
17 Properties |
| 1995 | £35,475 | - |
12 Properties |
Property Price per Property Type in Flint Castle
Here you can find historic sold price data in order to help with your property search.
The average Property Paid Price for specific property types in the last three years are:
| Property Type | Average Sold Price | Sold Properties |
|---|---|---|
| Semi Detached House | £144,925.00 | 20 Semi Detached Houses |
| Detached House | £203,750.00 | 2 Detached Houses |
| Terraced House | £121,453.00 | 43 Terraced Houses |

