
Houses for sale & to rent in Sir y Fflint - Flintshire, Wales
House Prices in Sir y Fflint - Flintshire
Properties in Sir y Fflint - Flintshire have
an average house price of
£225k
and had 5,756 Property Transactions
within the last 3 years.¹
Sir y Fflint - Flintshire is a location in
Wales with
63,589 households², where the most expensive property was sold for £2.38M.
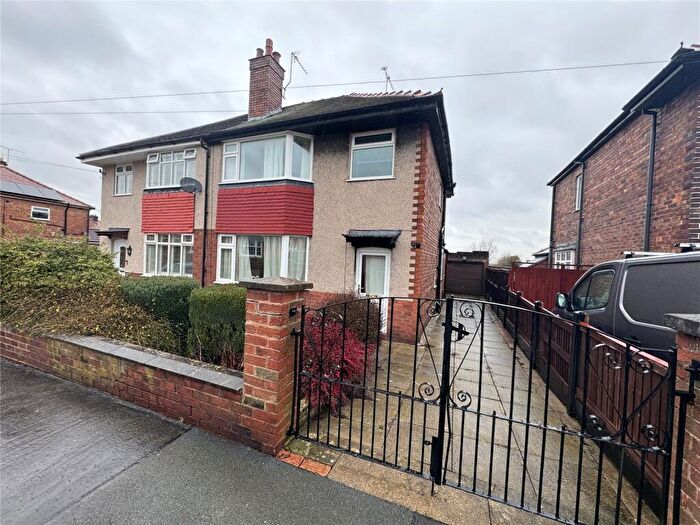
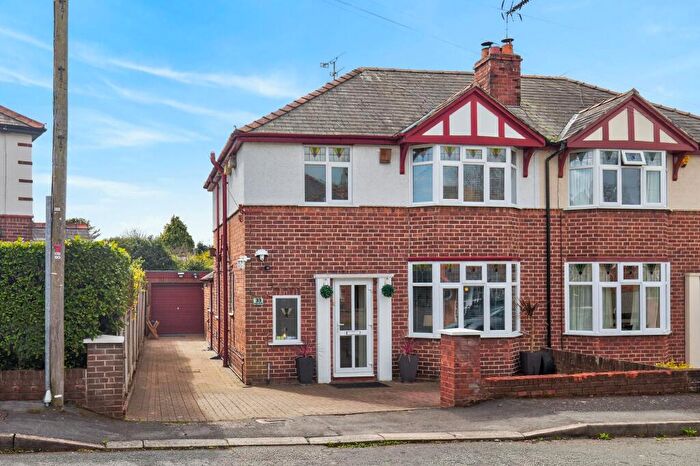
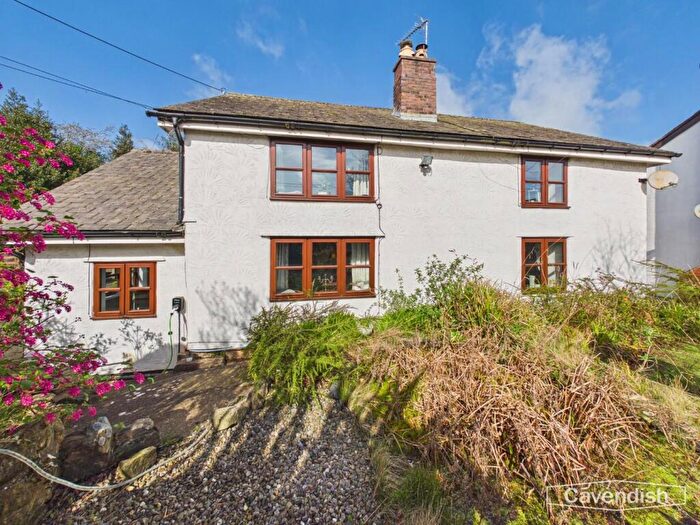
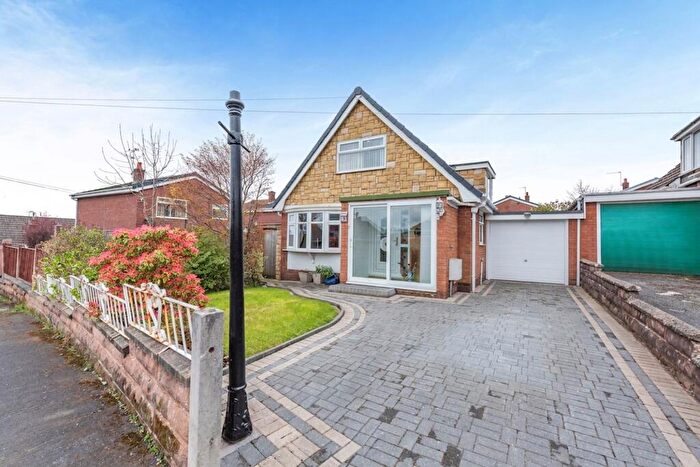
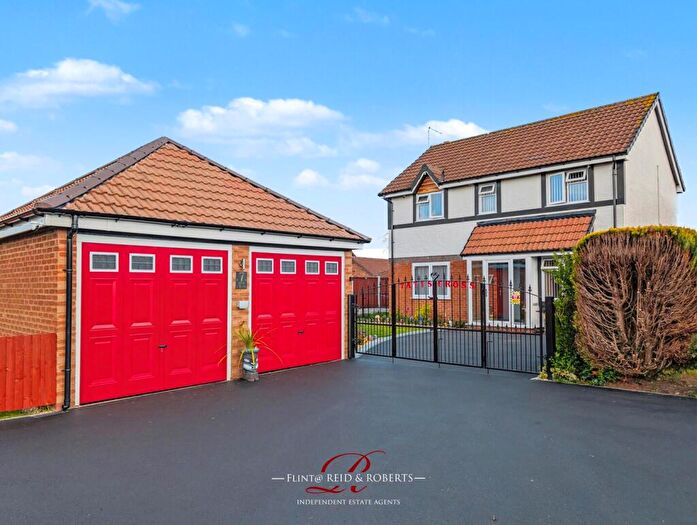
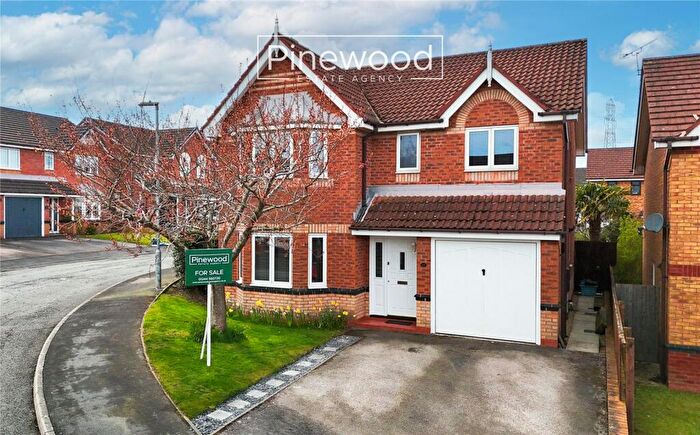
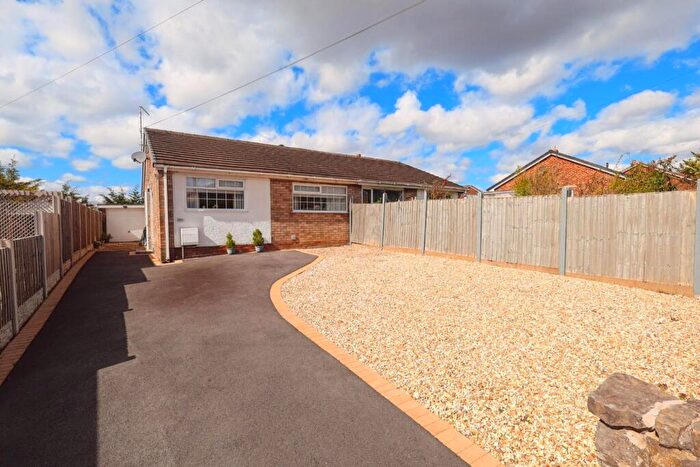
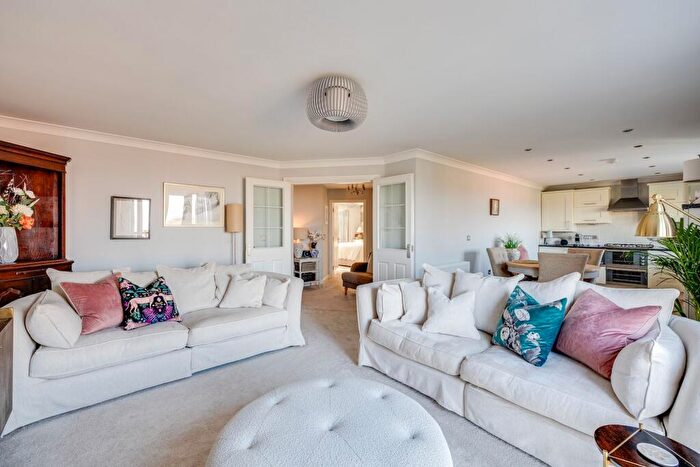
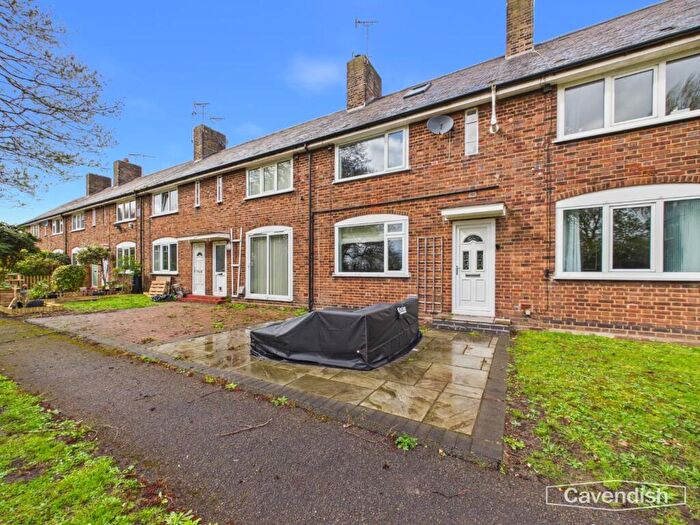
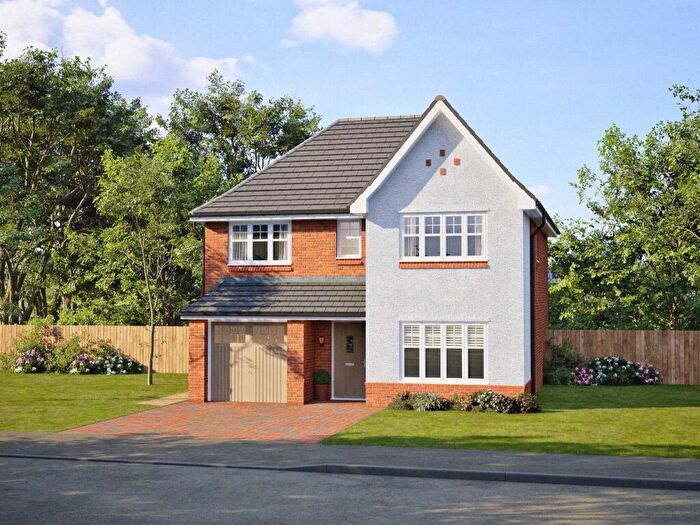
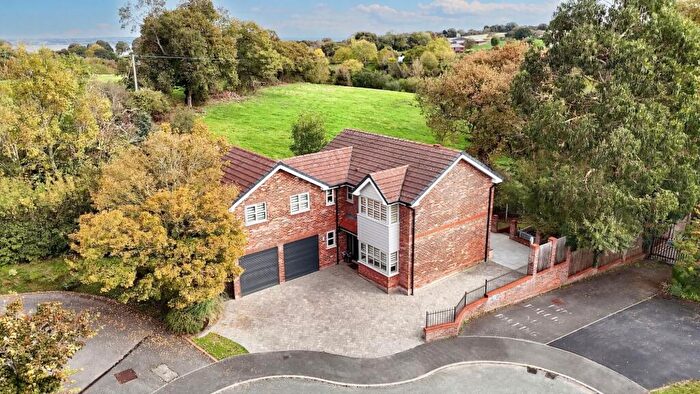
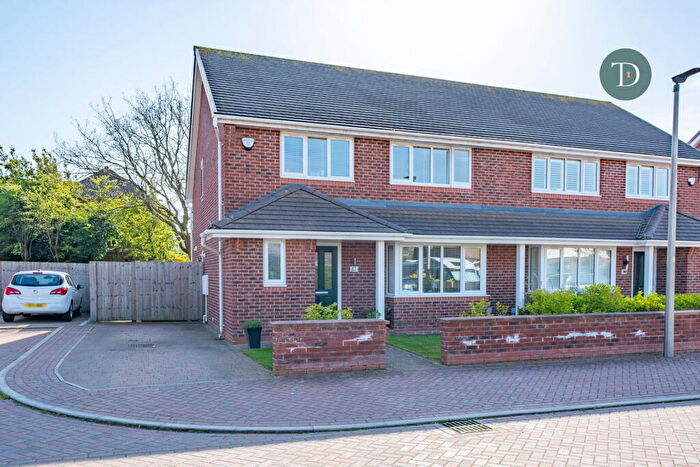
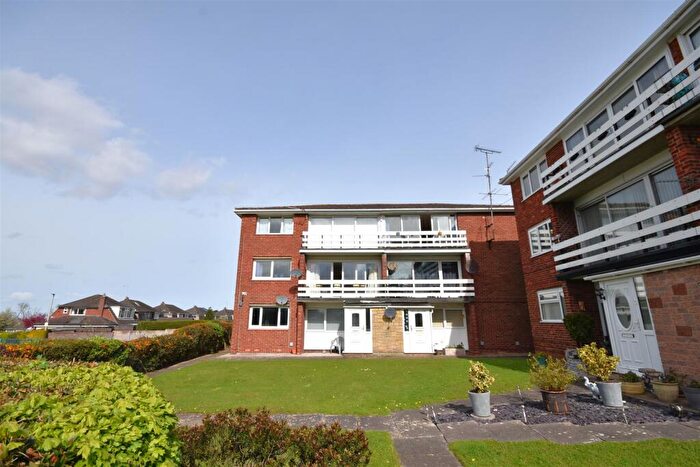
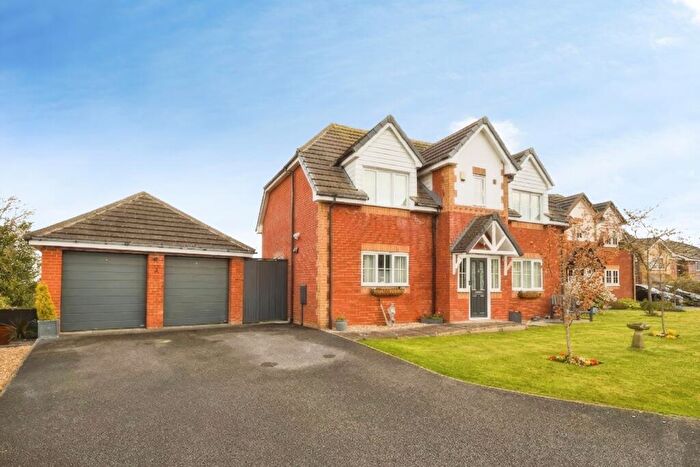
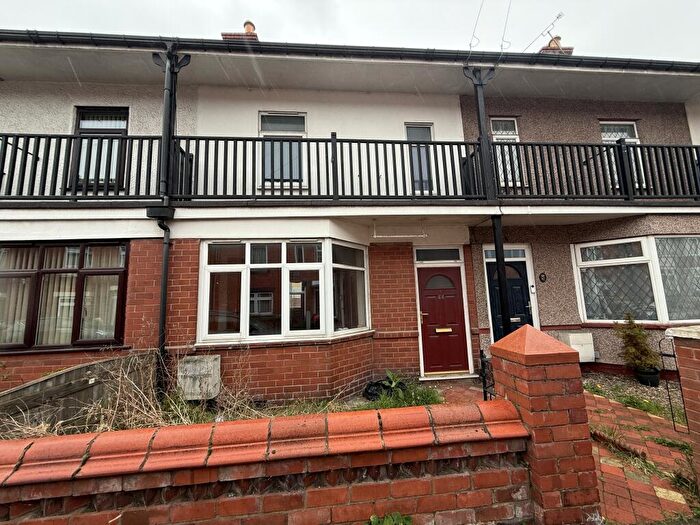
Properties for sale in Sir y Fflint - Flintshire
![]()
If you are looking to sell your house, let it out, or receive a property valuation, an expert can help you.
Click the button below to get started.

Towns in Sir y Fflint - Flintshire
Navigate through our locations to find the location of your next house in Sir y Fflint - Flintshire, Wales for sale or to rent.
Transport in Sir y Fflint - Flintshire
Please see below transportation links in this area:
-
 Shotton Station
 -
Flint Station
-
Hawarden Bridge Station
-
Hawarden Station
-
Buckley Station
-
Penyffordd Station
- FAQ
- Price Paid By Year
- Property Type Price
Frequently asked questions about Sir y Fflint - Flintshire
What is the average price for a property for sale in Sir y Fflint - Flintshire?
The average price for a property for sale in Sir y Fflint - Flintshire is £225,138. This amount is 2% lower than the average price in Wales. There are more than 10,000 property listings for sale in Sir y Fflint - Flintshire.
What locations have the most expensive properties for sale in Sir y Fflint - Flintshire?
The locations with the most expensive properties for sale in Sir y Fflint - Flintshire are Rhyl at an average of £316,848, Wrexham at an average of £258,211 and Chester at an average of £250,076.
What locations have the most affordable properties for sale in Sir y Fflint - Flintshire?
The locations with the most affordable properties for sale in Sir y Fflint - Flintshire are Bagillt at an average of £186,561, Prestatyn at an average of £190,211 and Flint at an average of £193,922.
Which train stations are available in or near Sir y Fflint - Flintshire?
Some of the train stations available in or near Sir y Fflint - Flintshire are Shotton, Flint and Hawarden Bridge.
Property Price Paid in Sir y Fflint - Flintshire by Year
The average sold property price by year was:
| Year | Average Sold Price | Price Change |
Sold Properties
|
|---|---|---|---|
| 2026 | £218,618 | -6% |
38 Properties |
| 2025 | £232,418 | 4% |
1,800 Properties |
| 2024 | £223,889 | 2% |
2,039 Properties |
| 2023 | £219,651 | -1% |
1,879 Properties |
| 2022 | £222,304 | 7% |
2,361 Properties |
| 2021 | £206,064 | 6% |
2,834 Properties |
| 2020 | £194,193 | 5% |
2,045 Properties |
| 2019 | £183,933 | 2% |
2,583 Properties |
| 2018 | £179,499 | 2% |
2,518 Properties |
| 2017 | £175,258 | 2% |
2,483 Properties |
| 2016 | £171,523 | 1% |
2,594 Properties |
| 2015 | £169,696 | 5% |
2,493 Properties |
| 2014 | £160,746 | 4% |
2,322 Properties |
| 2013 | £154,617 | -4% |
1,944 Properties |
| 2012 | £160,629 | 2% |
1,398 Properties |
| 2011 | £156,819 | 2% |
1,369 Properties |
| 2010 | £154,063 | 0,3% |
1,311 Properties |
| 2009 | £153,536 | -4% |
1,105 Properties |
| 2008 | £159,457 | -4% |
1,310 Properties |
| 2007 | £166,227 | 4% |
2,707 Properties |
| 2006 | £159,527 | 8% |
2,627 Properties |
| 2005 | £147,295 | 10% |
2,213 Properties |
| 2004 | £132,110 | 18% |
2,678 Properties |
| 2003 | £108,547 | 19% |
3,017 Properties |
| 2002 | £87,801 | 12% |
3,409 Properties |
| 2001 | £77,144 | 9% |
3,019 Properties |
| 2000 | £70,306 | 5% |
2,920 Properties |
| 1999 | £66,609 | 6% |
1,752 Properties |
| 1998 | £62,909 | 7% |
2,154 Properties |
| 1997 | £58,495 | 4% |
2,718 Properties |
| 1996 | £55,974 | 6% |
2,285 Properties |
| 1995 | £52,644 | - |
1,726 Properties |
Property Price per Property Type in Sir y Fflint - Flintshire
Here you can find historic sold price data in order to help with your property search.
The average Property Paid Price for specific property types in the last three years are:
| Property Type | Average Sold Price | Sold Properties |
|---|---|---|
| Semi Detached House | £187,882.00 | 2,304 Semi Detached Houses |
| Terraced House | £154,989.00 | 1,111 Terraced Houses |
| Detached House | £314,228.00 | 2,112 Detached Houses |
| Flat | £118,641.00 | 229 Flats |