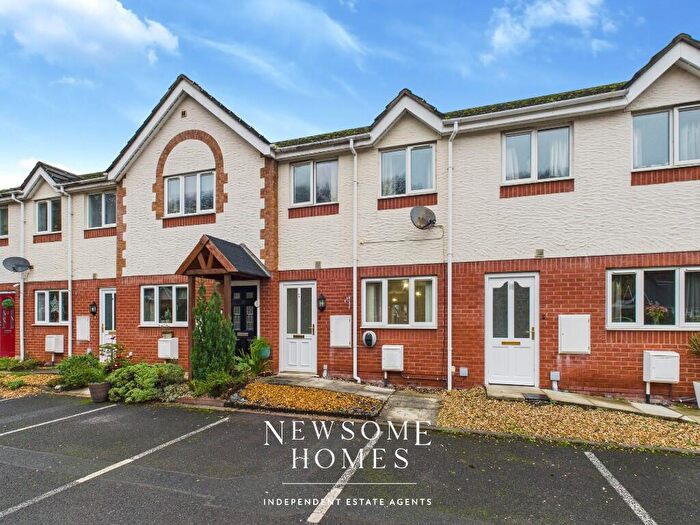
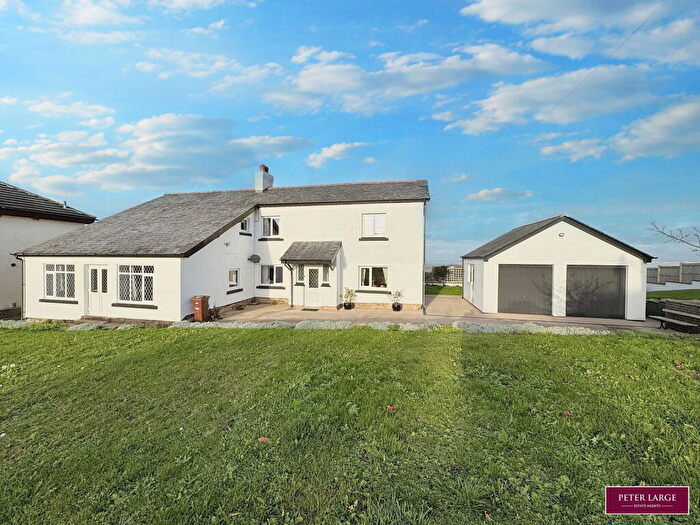
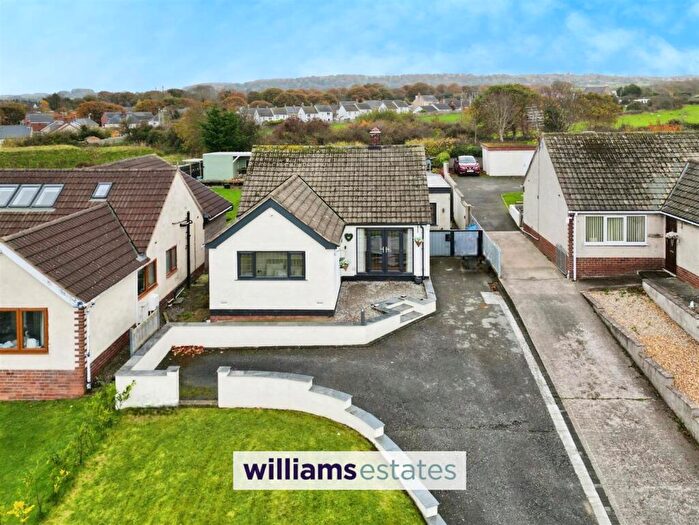
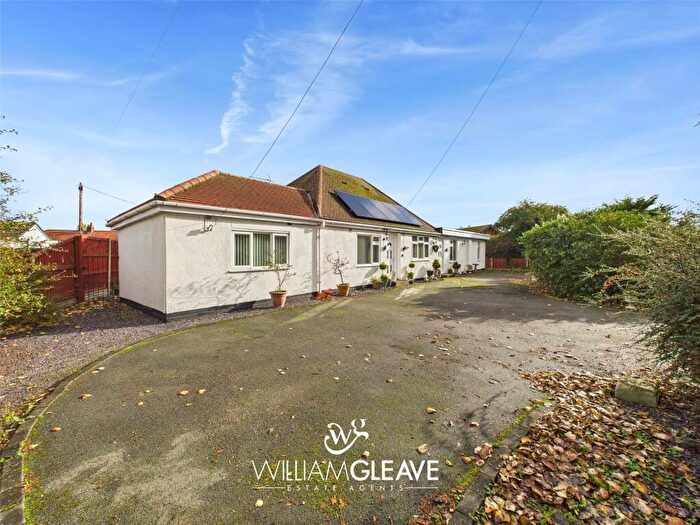
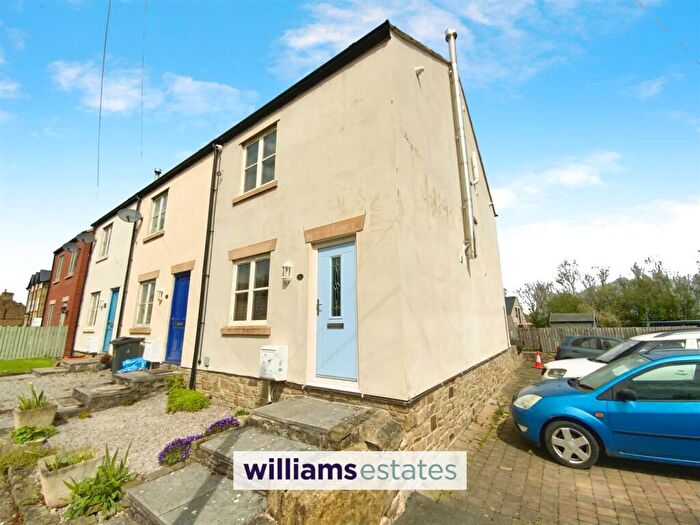
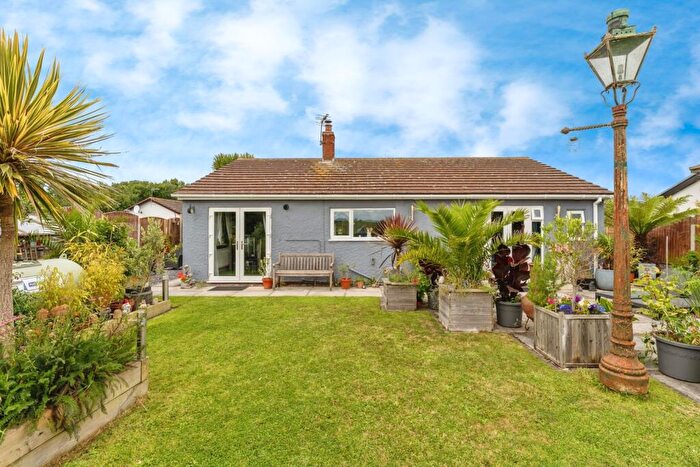
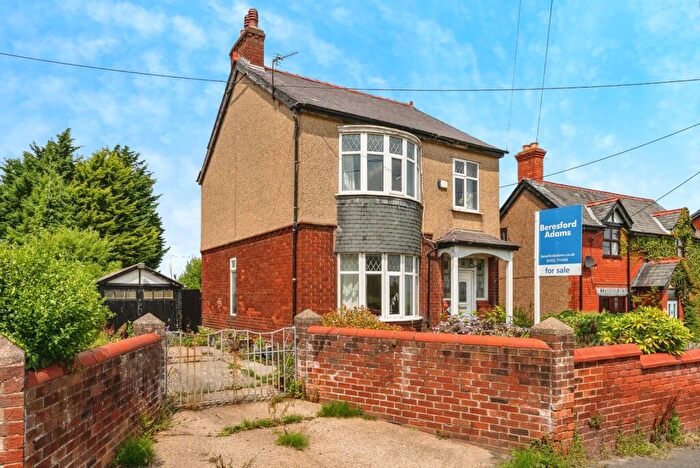
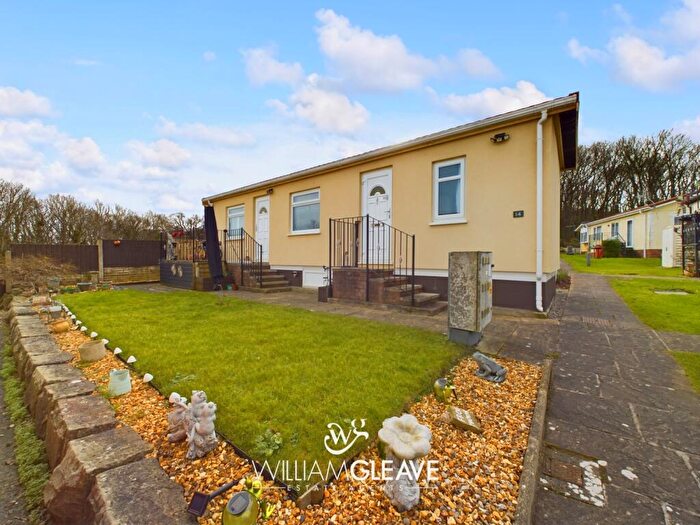
Houses for sale & to rent in Ffynnongroyw, Holywell
House Prices in Ffynnongroyw
Properties in Ffynnongroyw have an average house price of £170,383.00 and had 106 Property Transactions within the last 3 years¹.
Ffynnongroyw is an area in Holywell, Sir y Fflint - Flintshire with 826 households², where the most expensive property was sold for £490,000.00.
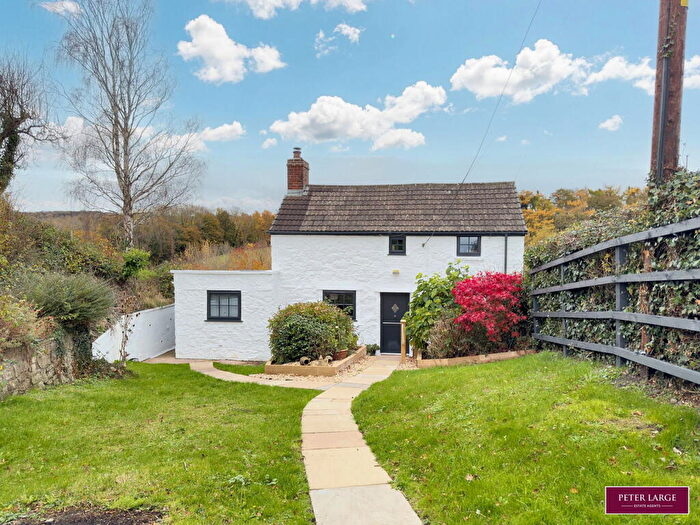
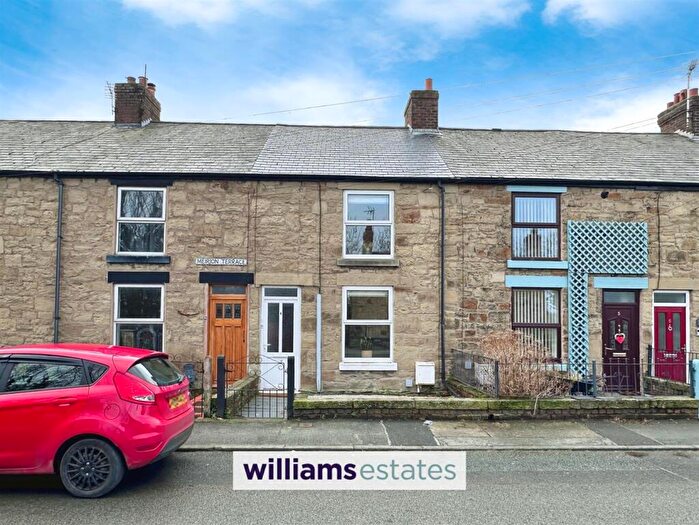
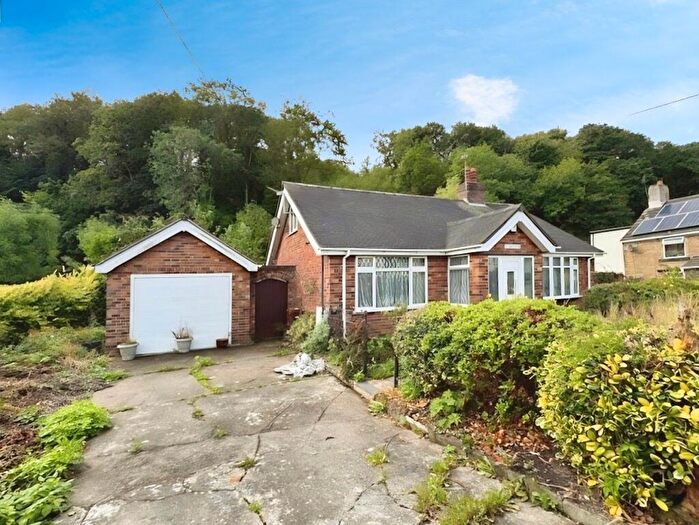
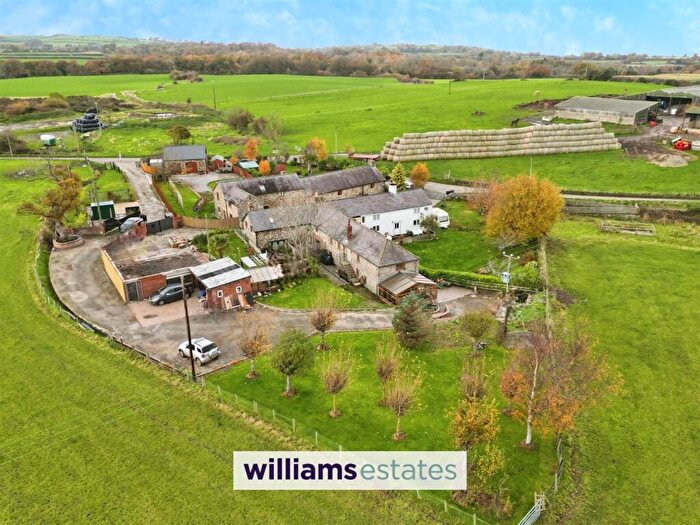
Properties for sale in Ffynnongroyw
Roads and Postcodes in Ffynnongroyw
Navigate through our locations to find the location of your next house in Ffynnongroyw, Holywell for sale or to rent.
| Streets | Postcodes |
|---|---|
| Abergele Terrace | CH8 9SP |
| Alder Court | CH8 9JR |
| Ash Road | CH8 9JL |
| Beach Close | CH8 9RF CH8 9RB |
| Bryn Garth | CH8 9HG CH8 9HQ |
| Bryn Hyfryd | CH8 9TT |
| Bryn Mor | CH8 9HL |
| Bryn Teg | CH8 9HS |
| Coast Road | CH8 9HA |
| Coed Mor | CH8 9HY |
| Corbett Avenue | CH8 9RE |
| Cwrt Y Glowyr | CH8 9JJ |
| Davies Terrace | CH8 9TN |
| Dee Road | CH8 9RS |
| Dee View | CH8 9HT |
| Didsbury Avenue | CH8 9SB |
| Edwards Terrace | CH8 9ST |
| Fairfield Avenue | CH8 9US |
| Fifth Avenue | CH8 9RH |
| Fourth Avenue | CH8 9RQ |
| Gamfa Wen Road | CH8 9RT |
| Garden View | CH8 9TQ |
| Garth Lane | CH8 9HB |
| Glasdir | CH8 9HU |
| Granaries Business Park | CH8 9RL |
| Jones Terrace | CH8 9HZ |
| Lewis Terrace | CH8 9UE |
| Llinegr Hill | CH8 9SY |
| Llys Dewi | CH8 9LA |
| Maelgwyn Terrace | CH8 9TS |
| Maes Emlyn | CH8 9JA |
| Maes Y Glowyr | CH8 9SZ |
| Maes Y Wennol | CH8 9AB |
| Main Road | CH8 9SH CH8 9SL CH8 9SN CH8 9SR CH8 9SU CH8 9SW CH8 9TD CH8 9TE CH8 9TF CH8 9TG CH8 9TW CH8 9UB CH8 9UD CH8 9UF CH8 9UG CH8 9SX CH8 9TR |
| Meirion Terrace | CH8 9SJ |
| Mornant Avenue | CH8 9UJ CH8 9UL CH8 9UP CH8 9UN |
| Old Vicarage Road | CH8 9SD |
| Owens Terrace | CH8 9HP |
| Picton Road | CH8 9HR CH8 9JG CH8 9JQ |
| Rhewl Fawr Road | CH8 9HJ CH8 9JE CH8 9JF |
| Station Road | CH8 9RD |
| Talbot Drive | CH8 9RR |
| Tanlan | CH8 9JH CH8 9UU |
| Tanlan Hill | CH8 9JP |
| Third Avenue | CH8 9RG |
| Tyn Y Morfa | CH8 9NH |
| Tyny Morfa | CH8 9JN CH8 9JW |
| Well Lane | CH8 9UT |
| West Road | CH8 9SA |
| Williams Place | CH8 9UR |
| Willow Grove | CH8 9RP |
| CH8 9HH LL19 9TT |
Transport near Ffynnongroyw
-
Prestatyn Station
-
West Kirby Station
-
Hoylake Station
-
Manor Road Station
-
Rhyl Station
-
Meols Station
-
Flint Station
-
Moreton (Merseyside) Station
-
Heswall Station
-
Upton Station
- FAQ
- Price Paid By Year
- Property Type Price
Frequently asked questions about Ffynnongroyw
What is the average price for a property for sale in Ffynnongroyw?
The average price for a property for sale in Ffynnongroyw is £170,383. This amount is 21% lower than the average price in Holywell. There are 183 property listings for sale in Ffynnongroyw.
What streets have the most expensive properties for sale in Ffynnongroyw?
The streets with the most expensive properties for sale in Ffynnongroyw are Tyny Morfa at an average of £490,000, Corbett Avenue at an average of £315,000 and Third Avenue at an average of £295,000.
What streets have the most affordable properties for sale in Ffynnongroyw?
The streets with the most affordable properties for sale in Ffynnongroyw are Willow Grove at an average of £102,400, Maelgwyn Terrace at an average of £103,500 and Llys Dewi at an average of £104,000.
Which train stations are available in or near Ffynnongroyw?
Some of the train stations available in or near Ffynnongroyw are Prestatyn, West Kirby and Hoylake.
Property Price Paid in Ffynnongroyw by Year
The average sold property price by year was:
| Year | Average Sold Price | Price Change |
Sold Properties
|
|---|---|---|---|
| 2025 | £182,933 | 5% |
15 Properties |
| 2024 | £174,472 | 18% |
27 Properties |
| 2023 | £142,816 | -26% |
25 Properties |
| 2022 | £180,396 | 6% |
39 Properties |
| 2021 | £169,750 | 20% |
32 Properties |
| 2020 | £135,372 | 7% |
18 Properties |
| 2019 | £126,236 | 1% |
19 Properties |
| 2018 | £125,304 | 3% |
31 Properties |
| 2017 | £121,935 | -6% |
32 Properties |
| 2016 | £129,589 | 2% |
28 Properties |
| 2015 | £127,552 | 1% |
18 Properties |
| 2014 | £125,924 | -2% |
33 Properties |
| 2013 | £128,168 | 25% |
24 Properties |
| 2012 | £96,166 | -15% |
9 Properties |
| 2011 | £110,599 | -8% |
23 Properties |
| 2010 | £119,563 | 8% |
11 Properties |
| 2009 | £109,545 | 6% |
11 Properties |
| 2008 | £103,023 | -26% |
17 Properties |
| 2007 | £130,161 | 4% |
41 Properties |
| 2006 | £124,929 | 16% |
37 Properties |
| 2005 | £104,748 | 14% |
26 Properties |
| 2004 | £90,463 | 15% |
37 Properties |
| 2003 | £76,631 | 34% |
63 Properties |
| 2002 | £50,576 | -1% |
46 Properties |
| 2001 | £51,020 | 5% |
35 Properties |
| 2000 | £48,597 | -14% |
35 Properties |
| 1999 | £55,629 | 20% |
16 Properties |
| 1998 | £44,698 | 22% |
15 Properties |
| 1997 | £34,911 | -0,3% |
26 Properties |
| 1996 | £35,020 | 28% |
15 Properties |
| 1995 | £25,068 | - |
11 Properties |
Property Price per Property Type in Ffynnongroyw
Here you can find historic sold price data in order to help with your property search.
The average Property Paid Price for specific property types in the last three years are:
| Property Type | Average Sold Price | Sold Properties |
|---|---|---|
| Semi Detached House | £159,888.00 | 25 Semi Detached Houses |
| Detached House | £241,093.00 | 32 Detached Houses |
| Terraced House | £129,559.00 | 49 Terraced Houses |

