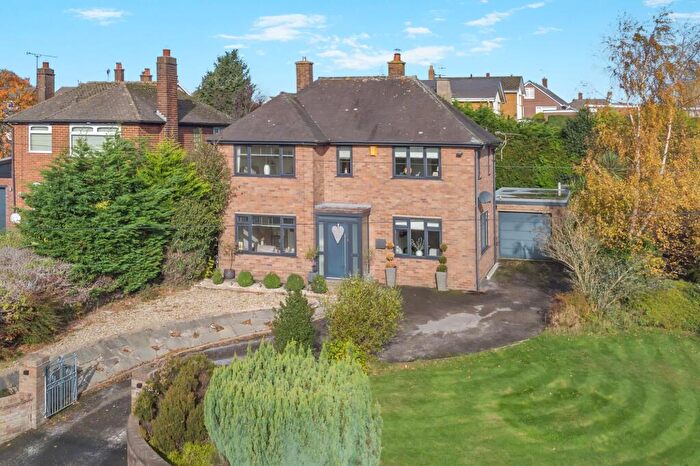
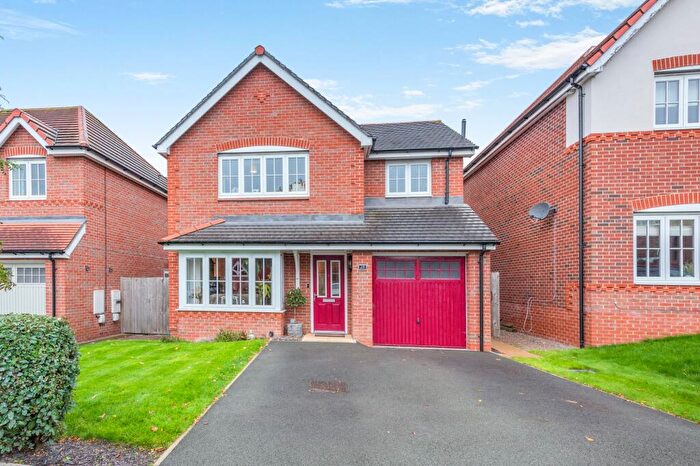
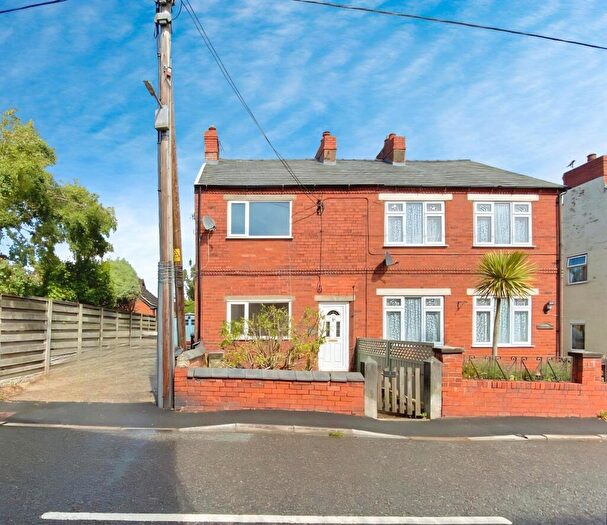
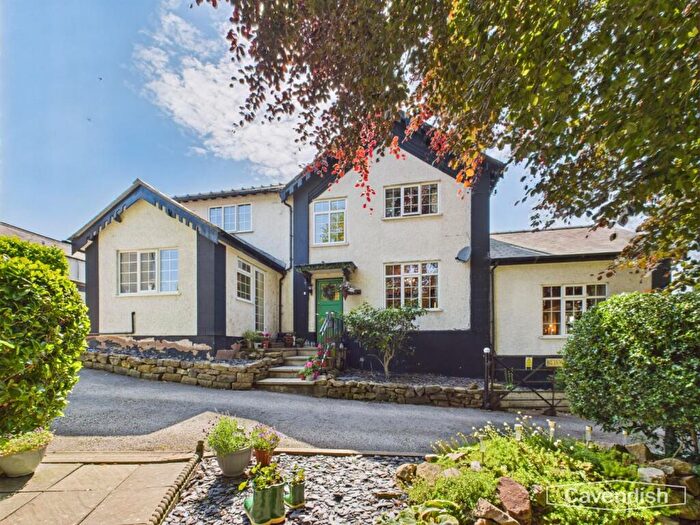
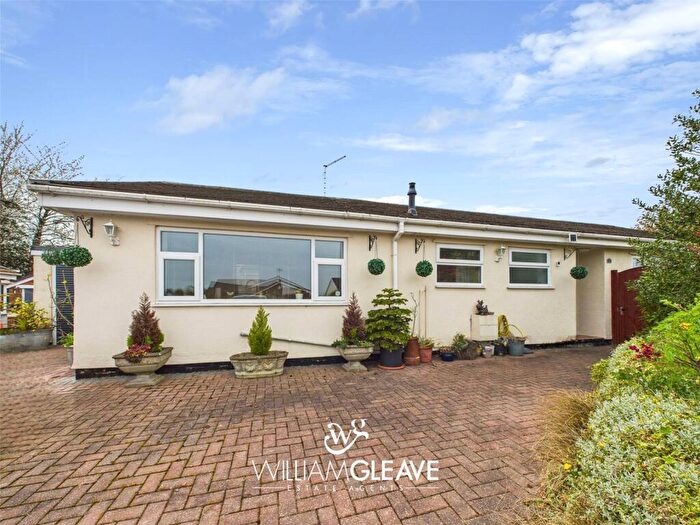
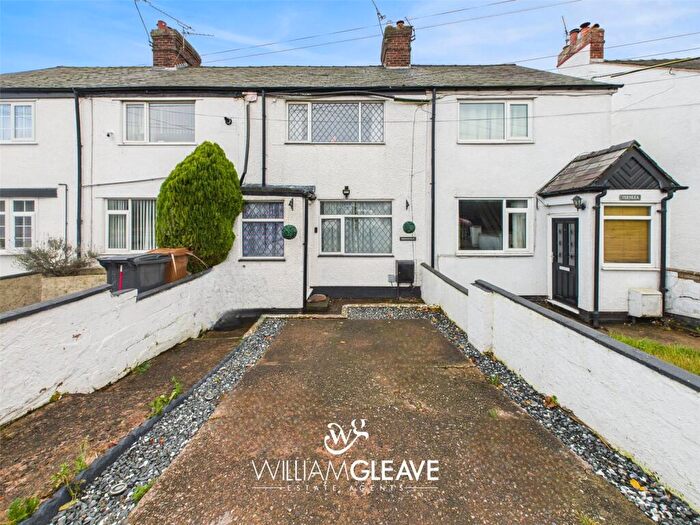
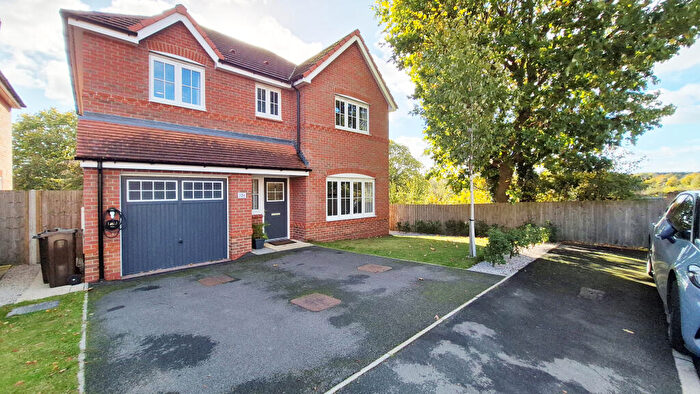
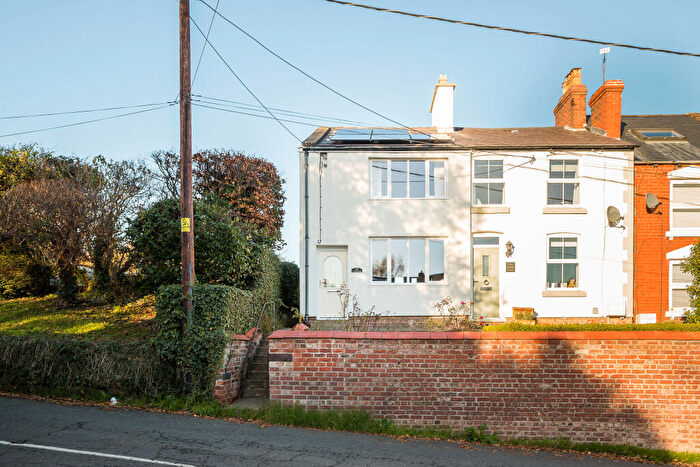
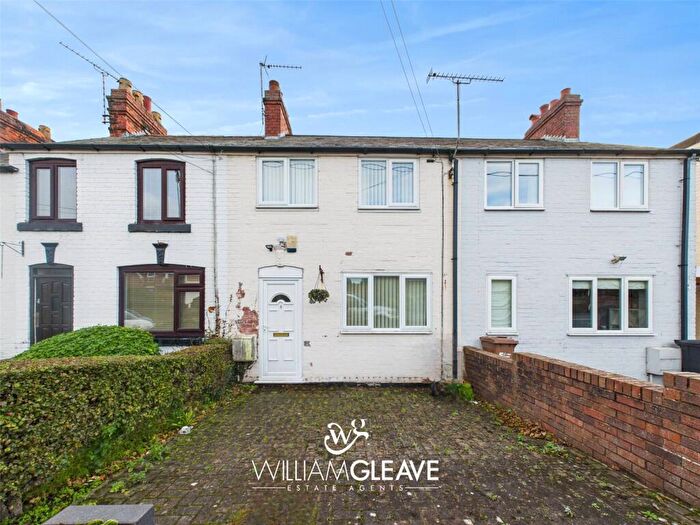
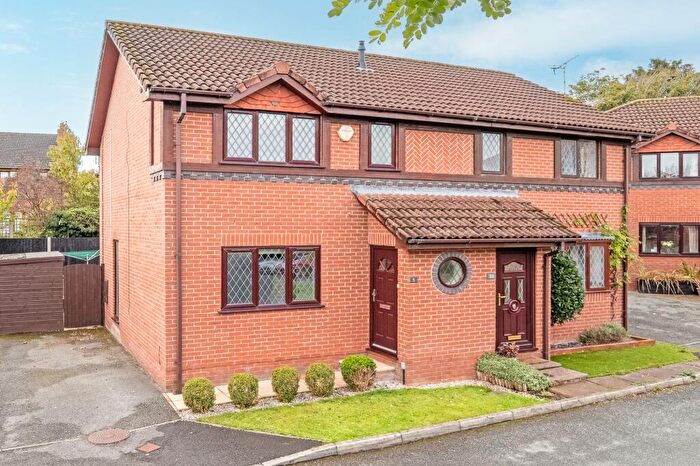
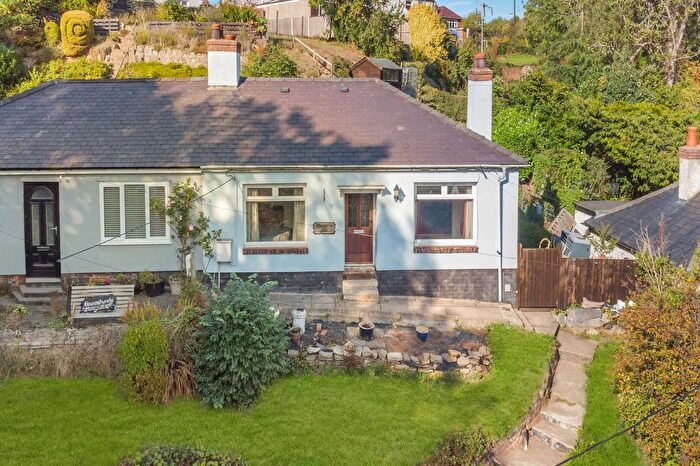
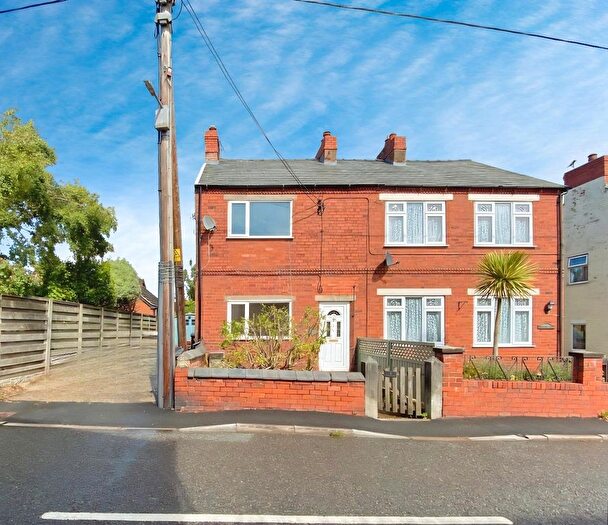
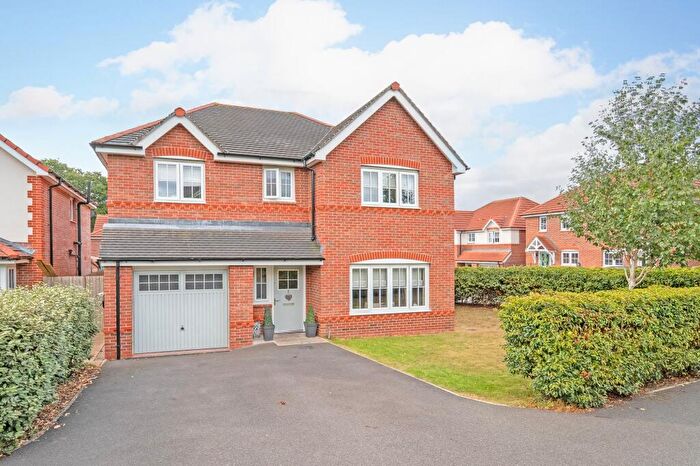
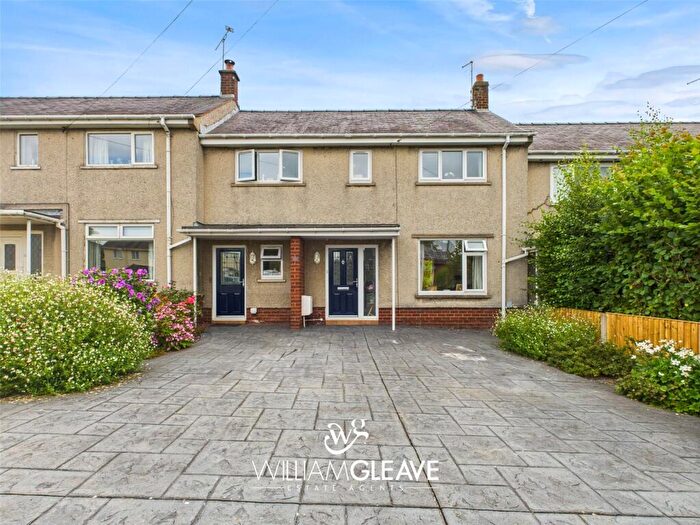
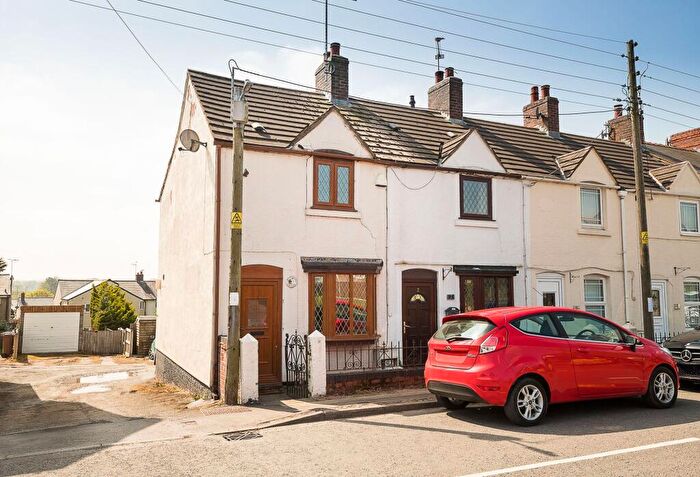
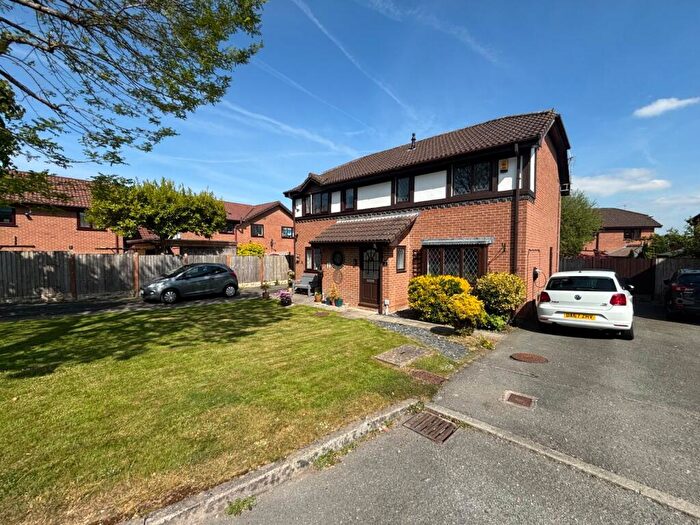
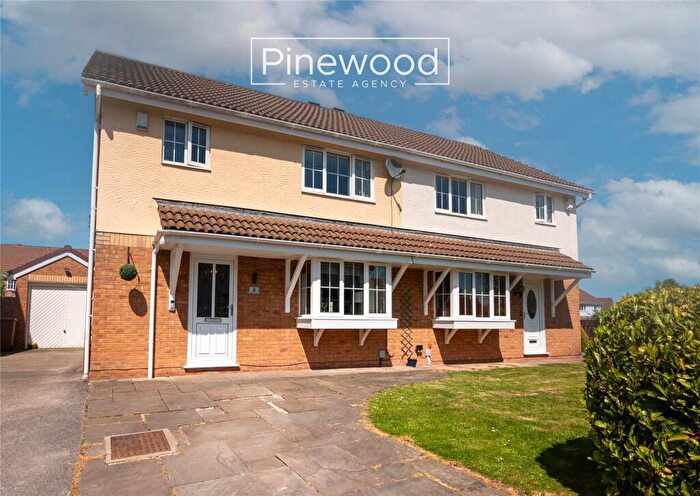
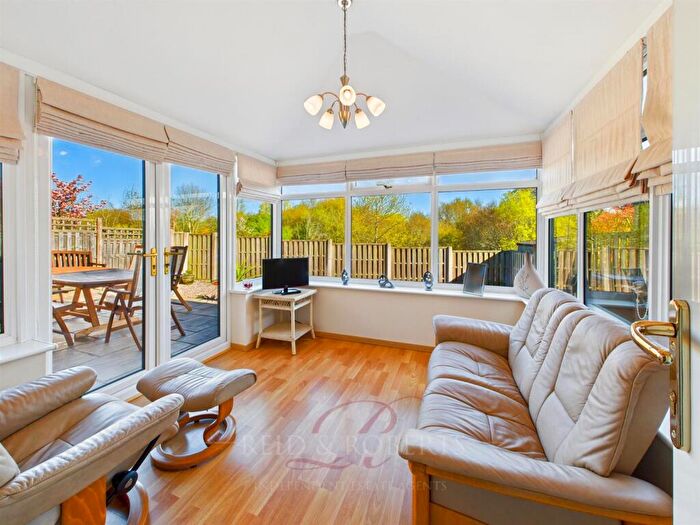
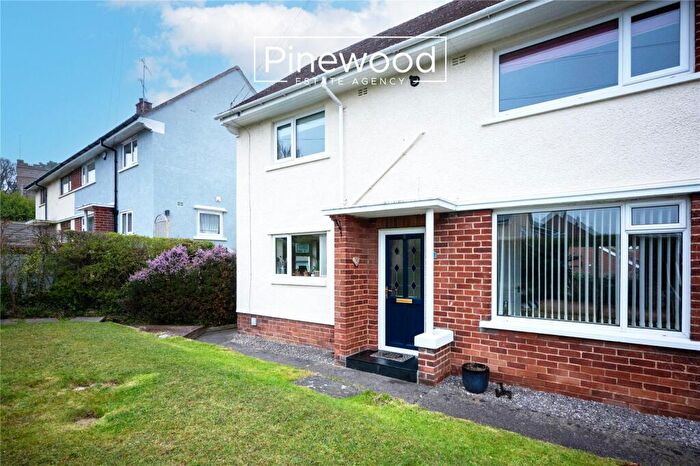
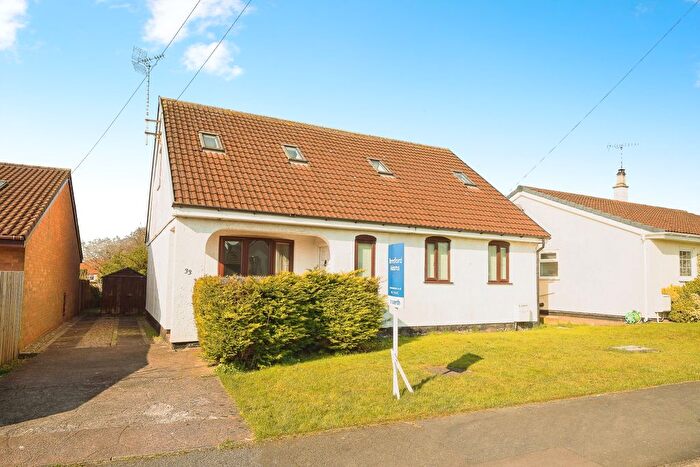
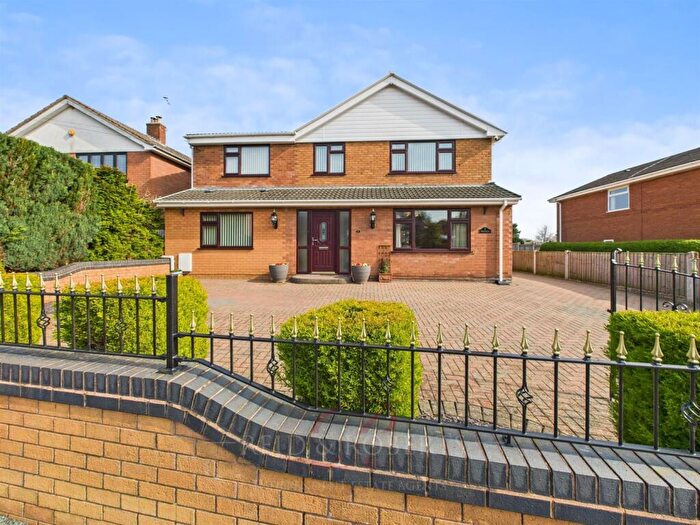
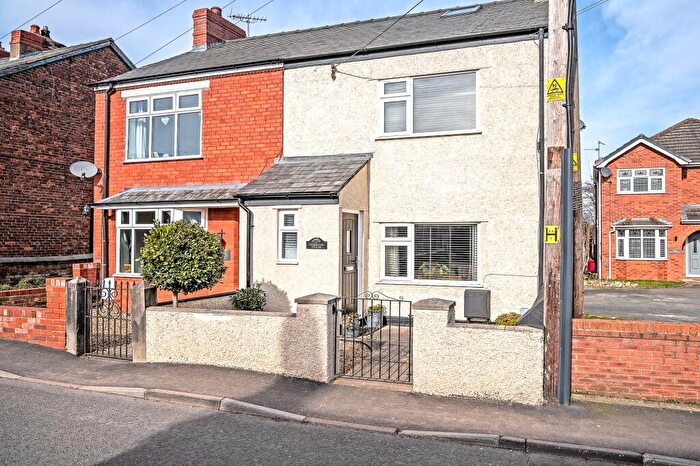
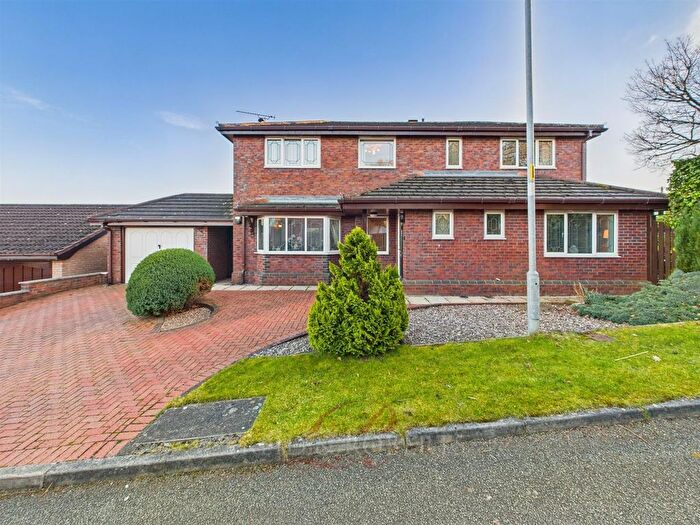
Houses for sale & to rent in Northop Hall, Mold
House Prices in Northop Hall
Properties in Northop Hall have an average house price of £280,252.00 and had 95 Property Transactions within the last 3 years¹.
Northop Hall is an area in Mold, Sir y Fflint - Flintshire with 647 households², where the most expensive property was sold for £595,000.00.
Properties for sale in Northop Hall
Previously listed properties in Northop Hall
Roads and Postcodes in Northop Hall
Navigate through our locations to find the location of your next house in Northop Hall, Mold for sale or to rent.
| Streets | Postcodes |
|---|---|
| Alun Close | CH7 6HX |
| Brookside | CH7 6HL |
| Brookside Crescent | CH7 6HW |
| Brookside Terrace | CH7 6HN |
| Bryn Gwyn Lane | CH7 6JT |
| Cae Haf | CH7 6GB |
| Centenary Close | CH7 6NU |
| Chester Road | CH7 6HH CH7 6HJ |
| Church Close | CH7 6HY |
| Daytona Drive | CH7 6LP |
| Eastbound A55 Expressway | CH7 6HF |
| Elm Cottages | CH7 6JU |
| Elm Drive | CH7 6JJ |
| Fern Bank | CH7 6LB |
| Gardd Eithin | CH7 6GJ |
| Gardd Yr Gwanwyn | CH7 6GA |
| Goodwood Grove | CH7 6LN |
| Hero's Place | CH7 6NQ |
| Institute Lane | CH7 6LA |
| Leasowe Terrace | CH7 6JN |
| Llys Ben | CH7 6GF |
| Llys Eithin | CH7 6GL |
| Llys Y Wennol | CH7 6GE |
| Memorial Close | CH7 6NX |
| Moel View Drive | CH7 6JY |
| Monza Close | CH7 6LW |
| Newton Close | CH7 6YX |
| Pinfold Lane | CH7 6HE |
| Poppy Field Road | CH7 6NS |
| Primrose Close | CH7 6JS |
| Quarry Close | CH7 6YJ |
| Sebring Avenue | CH7 6NP |
| Smithy Lane | CH7 6DE |
| St Marys Close | CH7 6GN |
| St Marys Drive | CH7 6JF |
| The Grove | CH7 6JX |
| The Ridgeway | CH7 6JR |
| Trum Yr Hydref | CH7 6GD |
| Tudor Close | CH7 6HZ |
| Village Road | CH7 6HS CH7 6HT CH7 6HU CH7 6JA CH7 6JB CH7 6JD CH7 6JG CH7 6JH CH7 6JP CH7 6JQ CH7 6JW CH7 6LF CH7 6LJ CH7 6HR CH7 6JE CH7 6JL CH7 6LE |
| Wared Drive | CH7 6JZ |
| Wellfield View | CH7 6HP |
| Wepre Lane | CH7 6LD |
| White Oaks Drive | CH7 6LL |
Transport near Northop Hall
- FAQ
- Price Paid By Year
- Property Type Price
Frequently asked questions about Northop Hall
What is the average price for a property for sale in Northop Hall?
The average price for a property for sale in Northop Hall is £280,252. This amount is 12% higher than the average price in Mold. There are 101 property listings for sale in Northop Hall.
What streets have the most expensive properties for sale in Northop Hall?
The streets with the most expensive properties for sale in Northop Hall are Llys Y Wennol at an average of £470,250, Bryn Gwyn Lane at an average of £411,875 and Cae Haf at an average of £389,500.
What streets have the most affordable properties for sale in Northop Hall?
The streets with the most affordable properties for sale in Northop Hall are Elm Cottages at an average of £180,000, St Marys Drive at an average of £192,987 and Brookside Crescent at an average of £194,750.
Which train stations are available in or near Northop Hall?
Some of the train stations available in or near Northop Hall are Shotton, Hawarden Bridge and Hawarden.
Property Price Paid in Northop Hall by Year
The average sold property price by year was:
| Year | Average Sold Price | Price Change |
Sold Properties
|
|---|---|---|---|
| 2025 | £292,656 | 5% |
16 Properties |
| 2024 | £277,111 | 6% |
27 Properties |
| 2023 | £260,092 | -12% |
21 Properties |
| 2022 | £290,241 | 23% |
31 Properties |
| 2021 | £222,074 | 5% |
27 Properties |
| 2020 | £211,520 | -4% |
24 Properties |
| 2019 | £219,020 | 3% |
45 Properties |
| 2018 | £213,384 | 14% |
51 Properties |
| 2017 | £183,206 | -31% |
65 Properties |
| 2016 | £240,890 | 12% |
40 Properties |
| 2015 | £211,752 | 25% |
36 Properties |
| 2014 | £158,955 | 9% |
18 Properties |
| 2013 | £145,215 | -14% |
17 Properties |
| 2012 | £165,000 | -23% |
15 Properties |
| 2011 | £202,438 | 0,1% |
18 Properties |
| 2010 | £202,144 | -4% |
17 Properties |
| 2009 | £210,428 | 8% |
14 Properties |
| 2008 | £193,944 | -9% |
9 Properties |
| 2007 | £211,627 | 9% |
27 Properties |
| 2006 | £192,789 | 12% |
19 Properties |
| 2005 | £169,388 | 13% |
18 Properties |
| 2004 | £147,076 | 0,1% |
26 Properties |
| 2003 | £146,921 | 15% |
36 Properties |
| 2002 | £124,689 | 23% |
33 Properties |
| 2001 | £95,822 | 12% |
32 Properties |
| 2000 | £84,353 | 5% |
30 Properties |
| 1999 | £79,793 | -1% |
21 Properties |
| 1998 | £80,653 | 9% |
25 Properties |
| 1997 | £73,090 | 9% |
35 Properties |
| 1996 | £66,666 | 0,1% |
28 Properties |
| 1995 | £66,612 | - |
45 Properties |
Property Price per Property Type in Northop Hall
Here you can find historic sold price data in order to help with your property search.
The average Property Paid Price for specific property types in the last three years are:
| Property Type | Average Sold Price | Sold Properties |
|---|---|---|
| Semi Detached House | £202,379.00 | 17 Semi Detached Houses |
| Detached House | £337,686.00 | 59 Detached Houses |
| Terraced House | £171,578.00 | 19 Terraced Houses |

