
Houses for sale & to rent in LL58 8LB, Ffordd Eglwys, Seiriol, Beaumaris
House Prices in LL58 8LB, Ffordd Eglwys, Seiriol
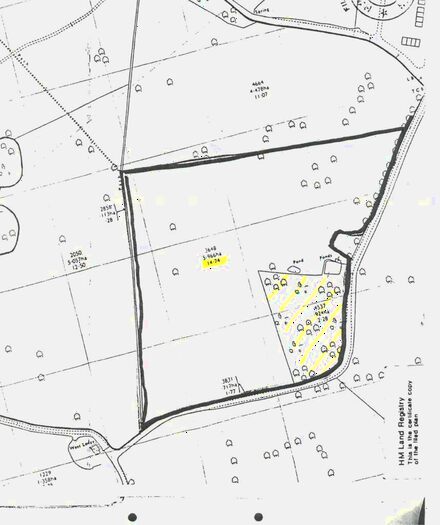
Properties in LL58 8LB have no sales history available within the last 3 years. LL58 8LB is a postcode in Ffordd Eglwys located in Seiriol, an area in Beaumaris, Sir Ynys Mon - Isle of Anglesey, with 7 households².
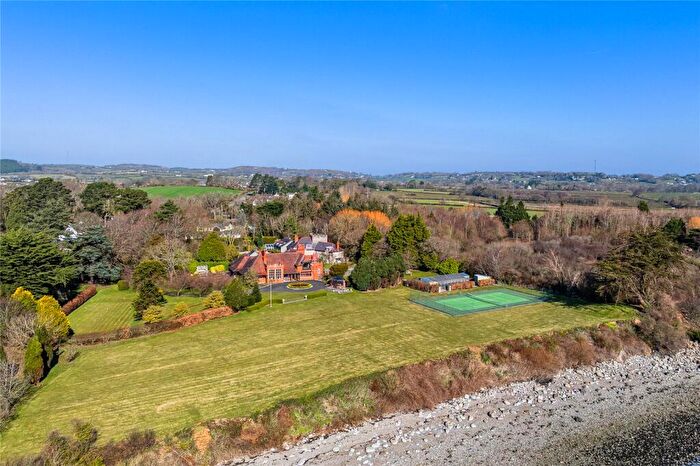
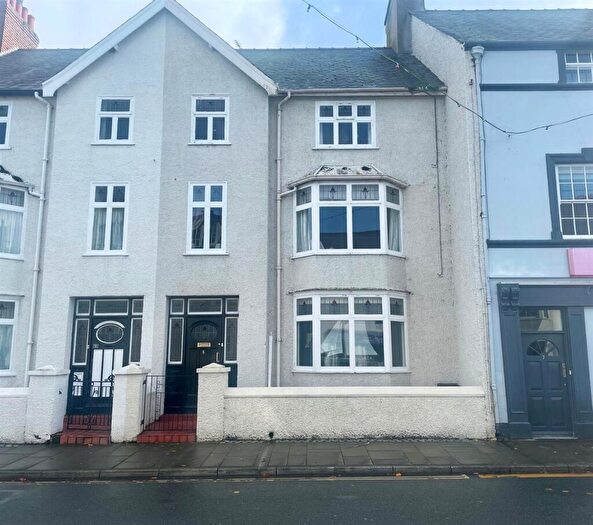
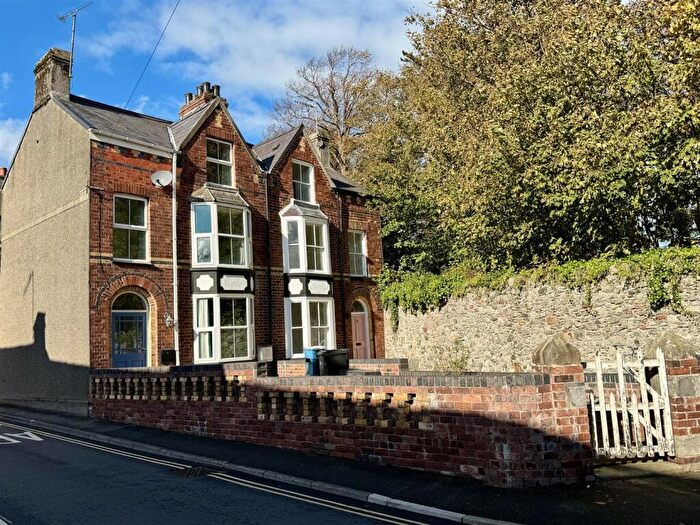
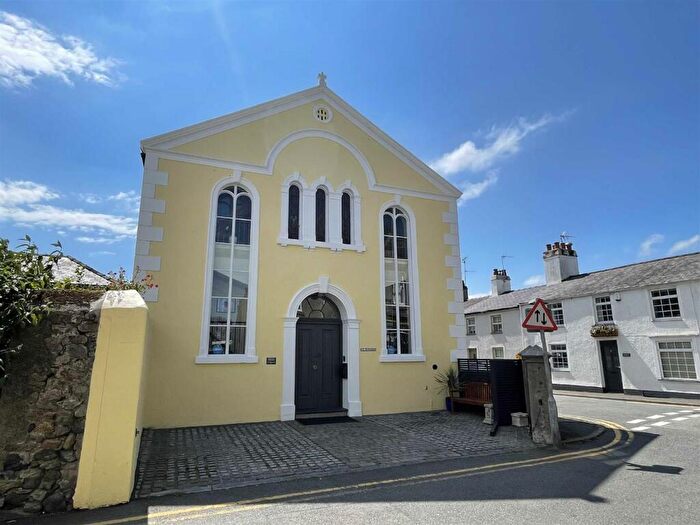
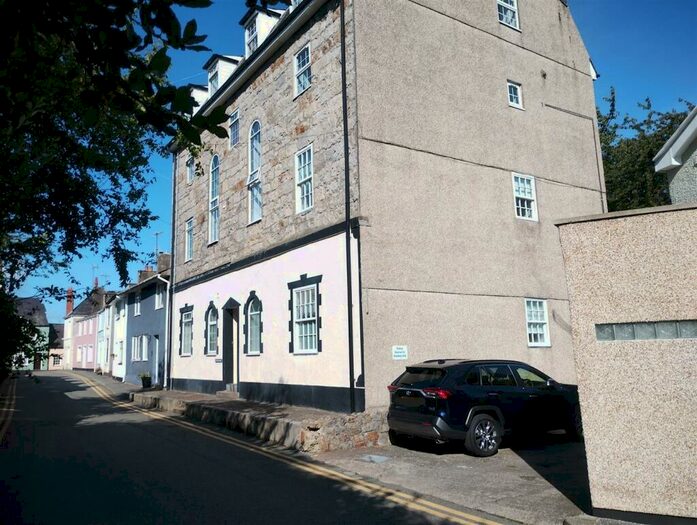
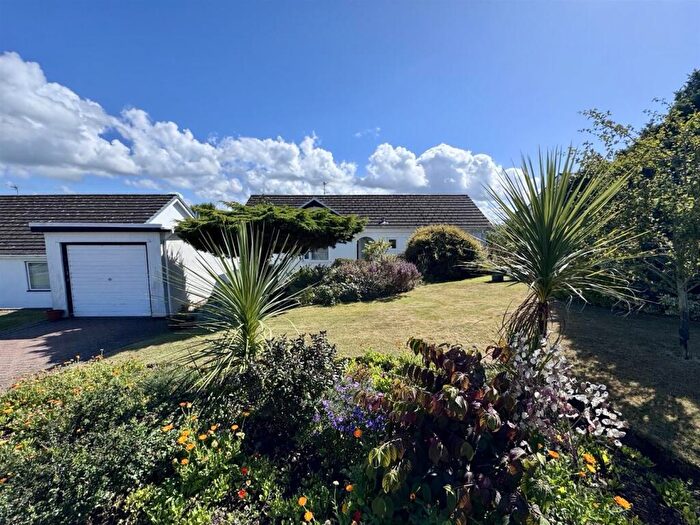
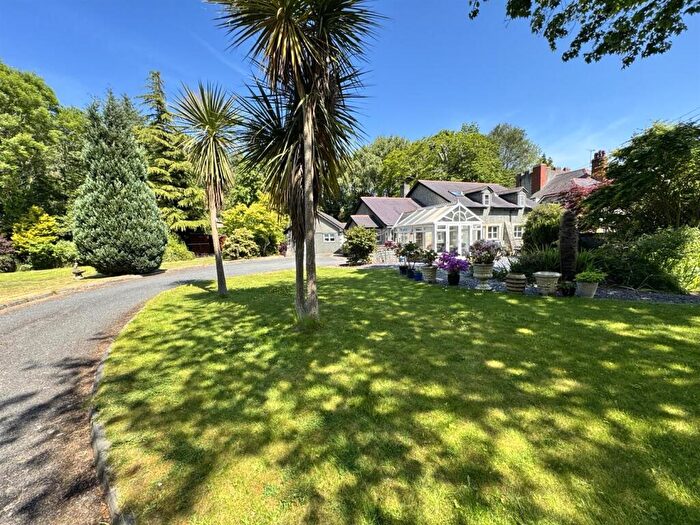
Properties for sale near LL58 8LB, Ffordd Eglwys

![]()
If you are looking to sell your house, let it out, or receive a property valuation, an expert can help you.
Click the button below to get started.
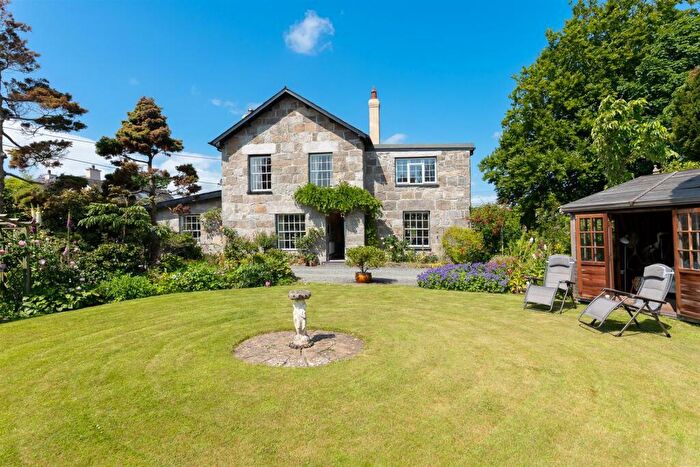
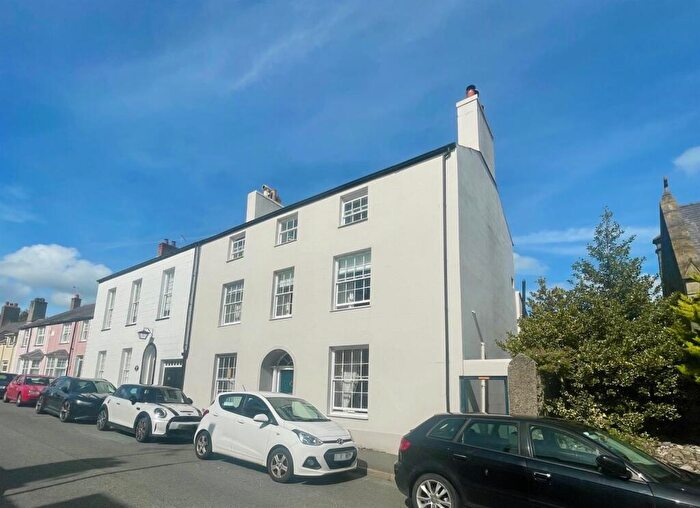
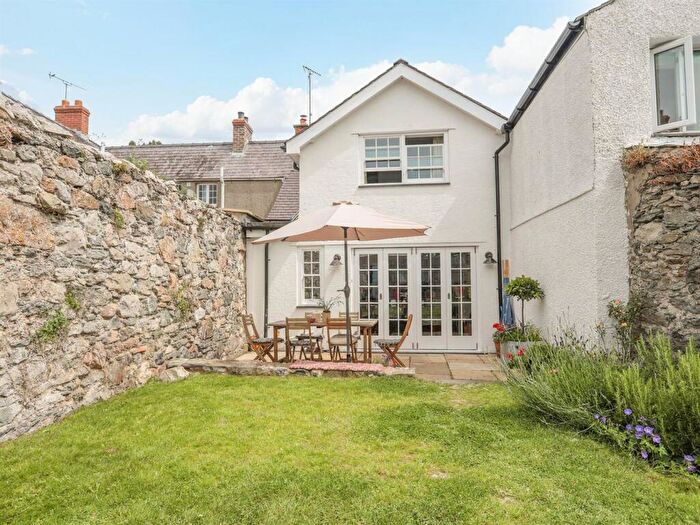
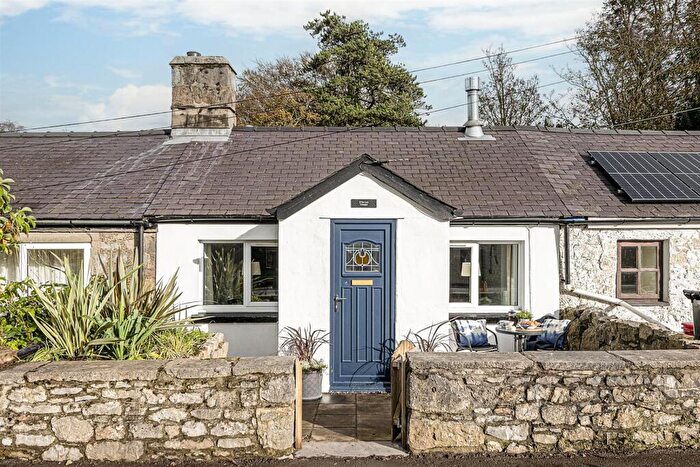
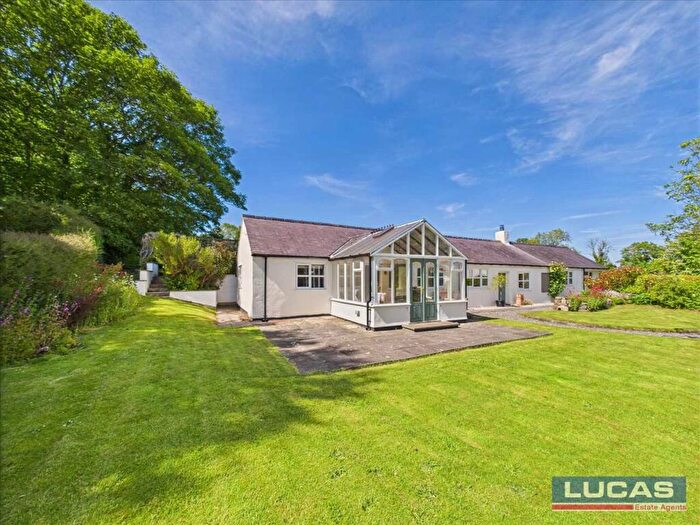
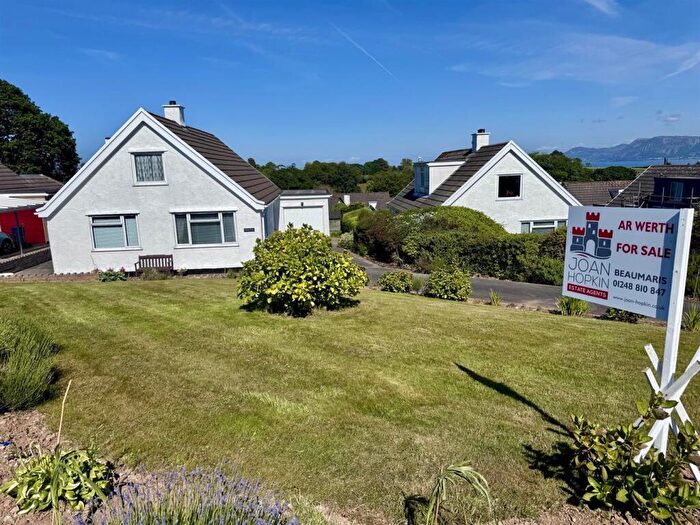
Previously listed properties near LL58 8LB, Ffordd Eglwys
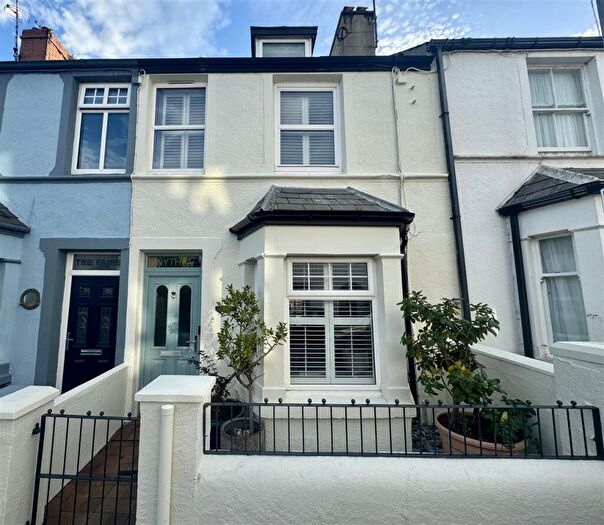
![]()
If you are looking to sell your house, let it out, or receive a property valuation, an expert can help you.
Click the button below to get started.
Price Paid in Ffordd Eglwys, LL58 8LB, Seiriol
10 Ffordd Eglwys, LL58 8LB, Seiriol Beaumaris
Property 10 has been sold 1 time. The last time it was sold was in 11/06/2021 and the sold price was £125,000.00.
This terraced house, sold as a freehold on 11/06/2021, is a 79 sqm mid-terrace house with an EPC rating of C.
| Date | Price | Property Type | Tenure | Classification |
|---|---|---|---|---|
| 11/06/2021 | £125,000.00 | Terraced House | freehold | Established Building |
6 Ffordd Eglwys, LL58 8LB, Seiriol Beaumaris
Property 6 has been sold 1 time. The last time it was sold was in 18/10/2016 and the sold price was £80,000.00.
This terraced house, sold as a freehold on 18/10/2016, is a 69 sqm end-terrace house with an EPC rating of D.
| Date | Price | Property Type | Tenure | Classification |
|---|---|---|---|---|
| 18/10/2016 | £80,000.00 | Terraced House | freehold | Established Building |
14 Ffordd Eglwys, LL58 8LB, Seiriol Beaumaris
Property 14 has been sold 1 time. The last time it was sold was in 25/06/1999 and the sold price was £45,000.00.
This detached house, sold as a freehold on 25/06/1999, is a 90 sqm top-floor flat with an EPC rating of D.
| Date | Price | Property Type | Tenure | Classification |
|---|---|---|---|---|
| 25/06/1999 | £45,000.00 | Detached House | freehold | Established Building |
Transport near LL58 8LB, Ffordd Eglwys

House price paid reports for LL58 8LB, Ffordd Eglwys
Click on the buttons below to see price paid reports by year or property price:
- Price Paid By Year
Property Price Paid in LL58 8LB, Ffordd Eglwys by Year
The average sold property price by year was:
| Year | Average Sold Price | Price Change |
Sold Properties
|
|---|---|---|---|
| 2021 | £125,000 | 36% |
1 Property |
| 2016 | £80,000 | 44% |
1 Property |
| 1999 | £45,000 | - |
1 Property |