
Houses for sale & to rent in Sir Ynys Mon - Isle of Anglesey, Wales
House Prices in Sir Ynys Mon - Isle of Anglesey
Properties in Sir Ynys Mon - Isle of Anglesey have
an average house price of
£261k
and had 2,396 Property Transactions
within the last 3 years.¹
Sir Ynys Mon - Isle of Anglesey is a location in
Wales with
30,593 households², where the most expensive property was sold for £2.85M.
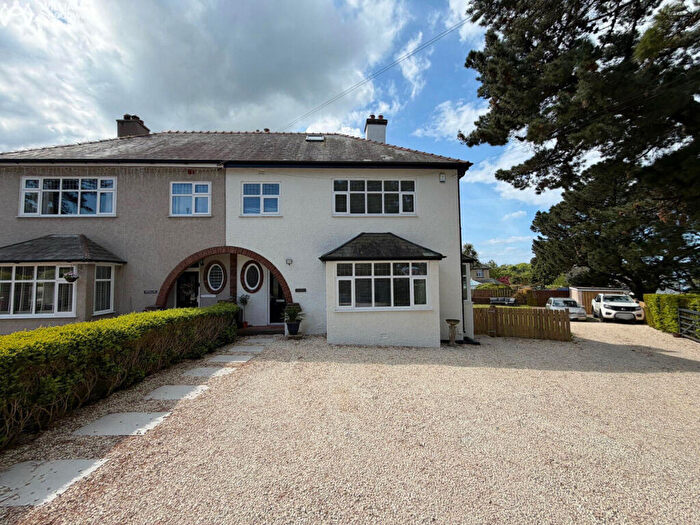
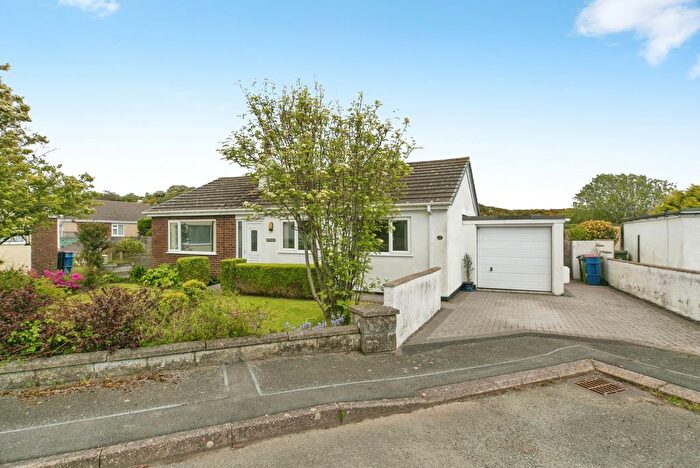
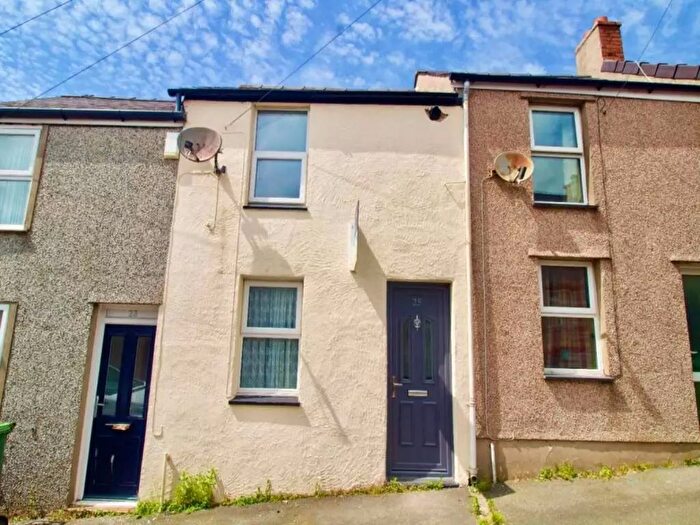
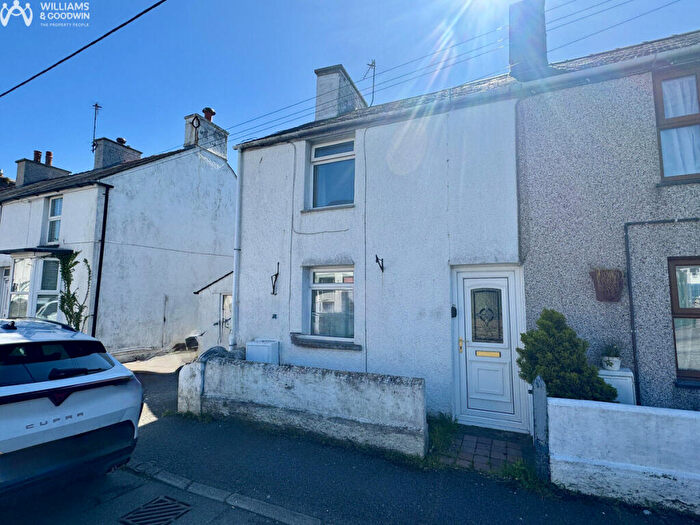
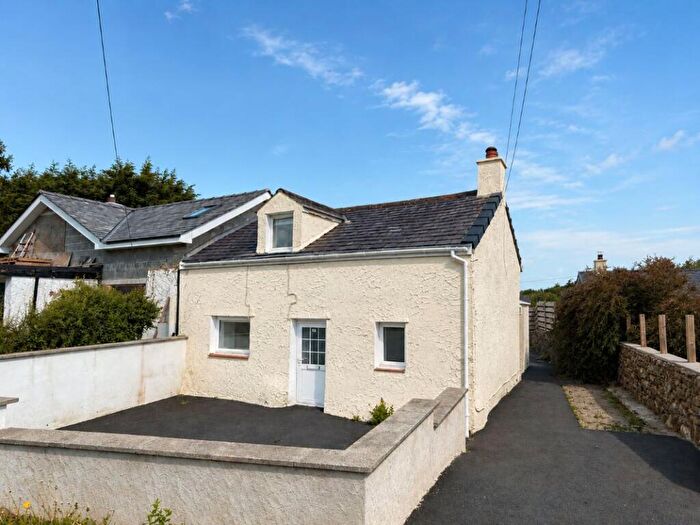
Properties for sale in Sir Ynys Mon - Isle of Anglesey
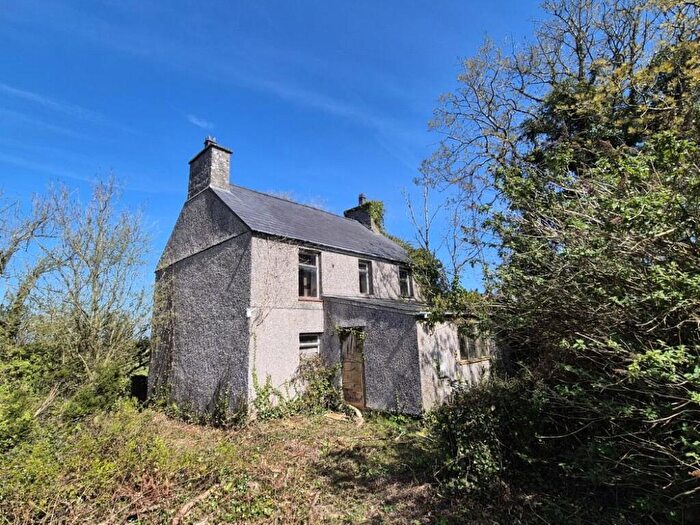
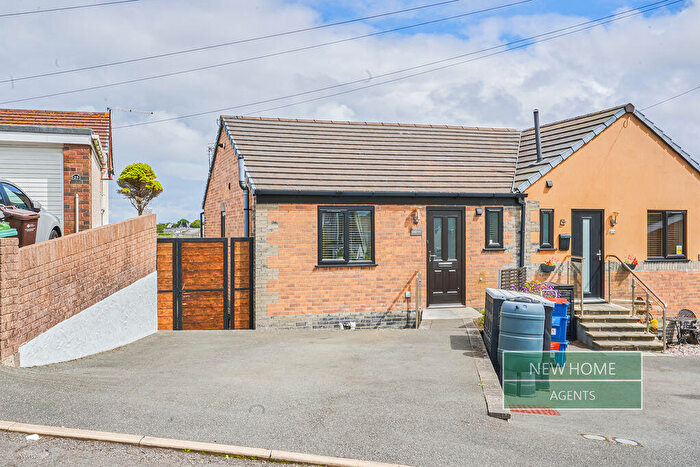
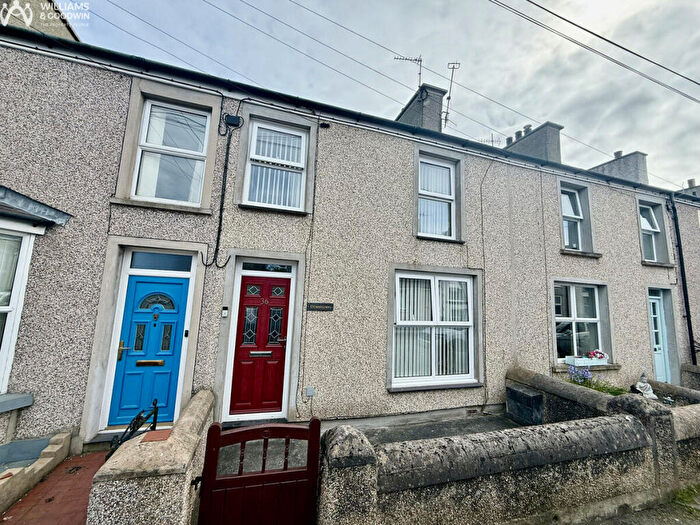
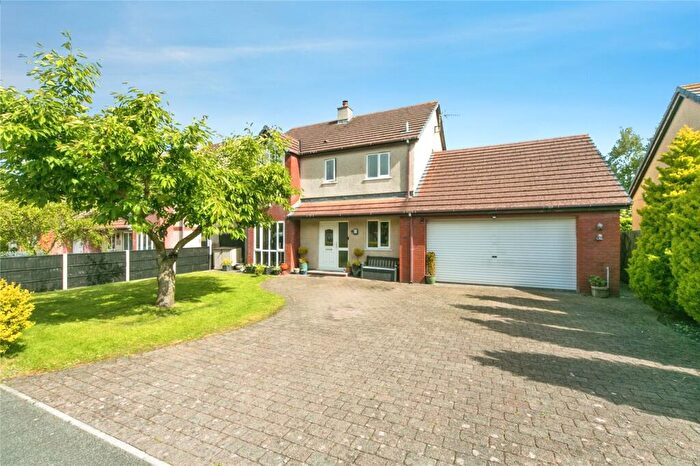
![]()
If you are looking to sell your house, let it out, or receive a property valuation, an expert can help you.
Click the button below to get started.


Towns in Sir Ynys Mon - Isle of Anglesey
Navigate through our locations to find the location of your next house in Sir Ynys Mon - Isle of Anglesey, Wales for sale or to rent.
Transport in Sir Ynys Mon - Isle of Anglesey
Please see below transportation links in this area:

- FAQ
- Price Paid By Year
- Property Type Price
Frequently asked questions about Sir Ynys Mon - Isle of Anglesey
What is the average price for a property for sale in Sir Ynys Mon - Isle of Anglesey?
The average price for a property for sale in Sir Ynys Mon - Isle of Anglesey is £260,780. This amount is 13% higher than the average price in Wales. There are 8,189 property listings for sale in Sir Ynys Mon - Isle of Anglesey.
What locations have the most expensive properties for sale in Sir Ynys Mon - Isle of Anglesey?
The locations with the most expensive properties for sale in Sir Ynys Mon - Isle of Anglesey are Rhosneigr at an average of £657,291, Dulas at an average of £421,666 and Marianglas at an average of £376,000.
What locations have the most affordable properties for sale in Sir Ynys Mon - Isle of Anglesey?
The locations with the most affordable properties for sale in Sir Ynys Mon - Isle of Anglesey are Llannerch-y-medd at an average of £192,184, Llanerchymedd at an average of £212,695 and Holyhead at an average of £217,322.
Which train stations are available in or near Sir Ynys Mon - Isle of Anglesey?
Some of the train stations available in or near Sir Ynys Mon - Isle of Anglesey are Bodorgan, Ty Croes and Rhosneigr.
Property Price Paid in Sir Ynys Mon - Isle of Anglesey by Year
The average sold property price by year was:
| Year | Average Sold Price | Price Change |
Sold Properties
|
|---|---|---|---|
| 2026 | £241,824 | -4% |
54 Properties |
| 2025 | £252,119 | -4% |
762 Properties |
| 2024 | £262,227 | -3% |
812 Properties |
| 2023 | £269,177 | -1% |
768 Properties |
| 2022 | £271,046 | 8% |
1,111 Properties |
| 2021 | £248,101 | 10% |
1,364 Properties |
| 2020 | £224,187 | 12% |
972 Properties |
| 2019 | £196,203 | 0,4% |
1,163 Properties |
| 2018 | £195,471 | 3% |
1,192 Properties |
| 2017 | £189,484 | 4% |
1,103 Properties |
| 2016 | £182,172 | 2% |
1,082 Properties |
| 2015 | £178,451 | 6% |
1,016 Properties |
| 2014 | £167,544 | 5% |
1,054 Properties |
| 2013 | £159,727 | -1% |
892 Properties |
| 2012 | £161,588 | 0,3% |
728 Properties |
| 2011 | £161,050 | -6% |
732 Properties |
| 2010 | £170,139 | 1% |
688 Properties |
| 2009 | £169,063 | -6% |
688 Properties |
| 2008 | £178,865 | 3% |
694 Properties |
| 2007 | £174,261 | 6% |
1,214 Properties |
| 2006 | £163,245 | 5% |
1,265 Properties |
| 2005 | £154,681 | 11% |
1,015 Properties |
| 2004 | £137,026 | 26% |
1,188 Properties |
| 2003 | £101,225 | 21% |
1,370 Properties |
| 2002 | £80,463 | 15% |
1,518 Properties |
| 2001 | £68,594 | 10% |
1,278 Properties |
| 2000 | £61,799 | 5% |
1,196 Properties |
| 1999 | £58,643 | 6% |
1,197 Properties |
| 1998 | £55,384 | 2% |
969 Properties |
| 1997 | £54,129 | 6% |
1,117 Properties |
| 1996 | £50,676 | 5% |
939 Properties |
| 1995 | £47,933 | - |
764 Properties |
Property Price per Property Type in Sir Ynys Mon - Isle of Anglesey
Here you can find historic sold price data in order to help with your property search.
The average Property Paid Price for specific property types in the last three years are:
| Property Type | Average Sold Price | Sold Properties |
|---|---|---|
| Semi Detached House | £217,149.00 | 477 Semi Detached Houses |
| Terraced House | £156,156.00 | 719 Terraced Houses |
| Detached House | £352,842.00 | 1,089 Detached Houses |
| Flat | £222,777.00 | 111 Flats |