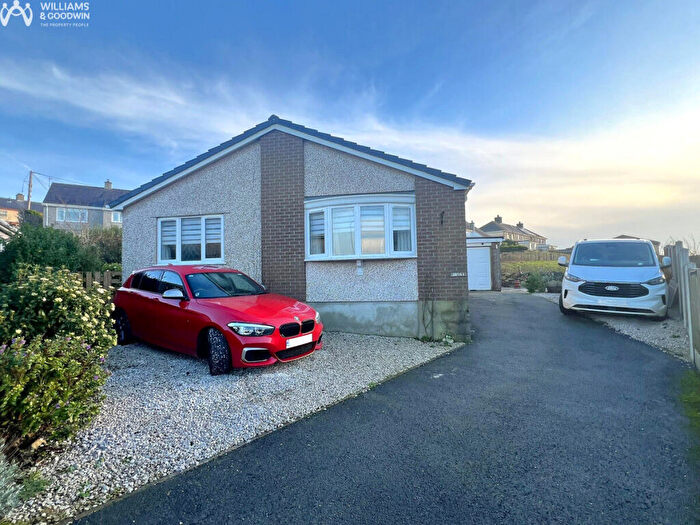
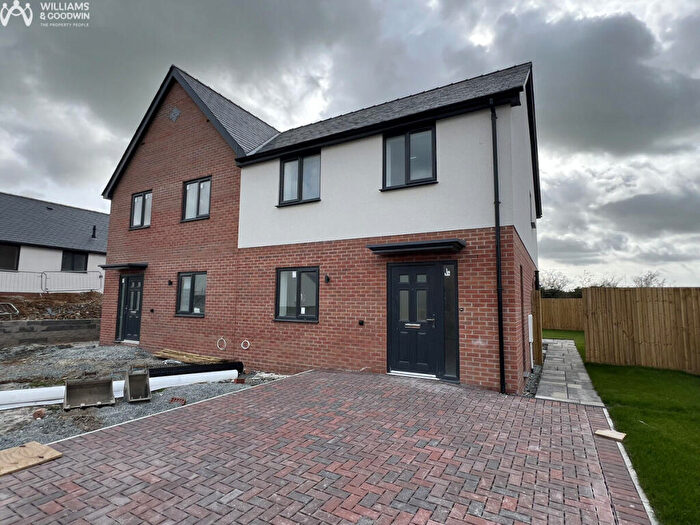
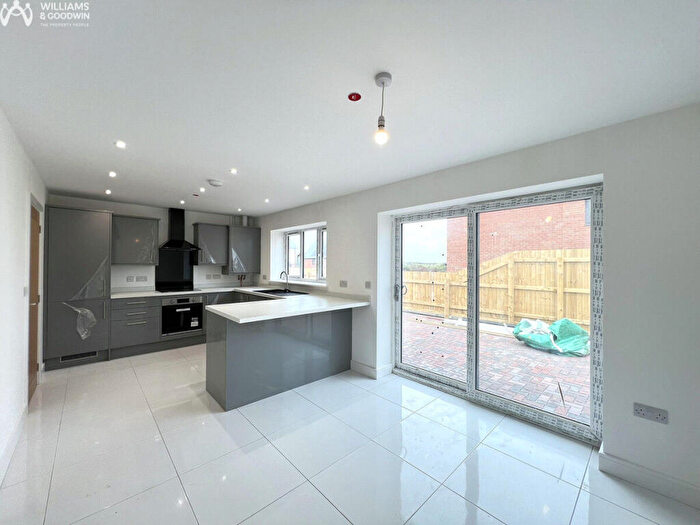
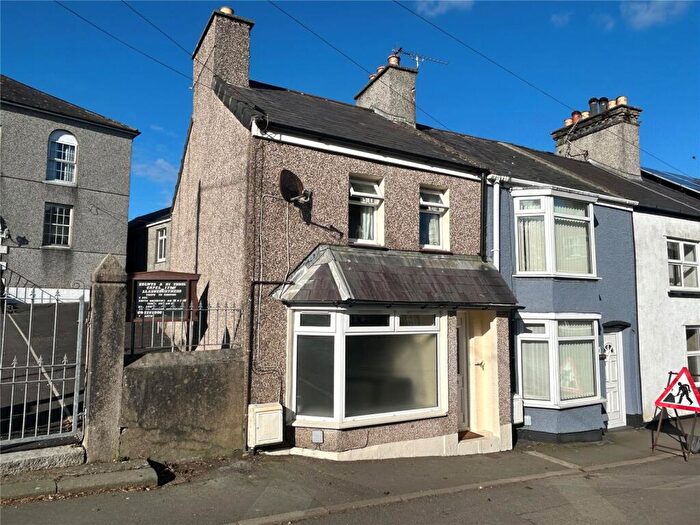
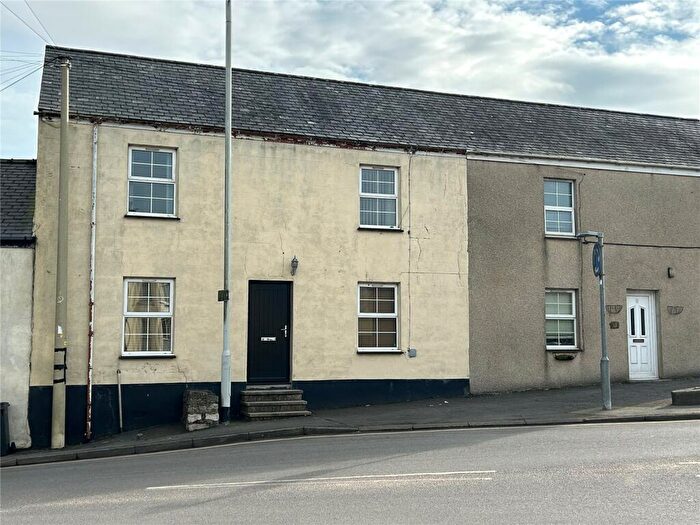
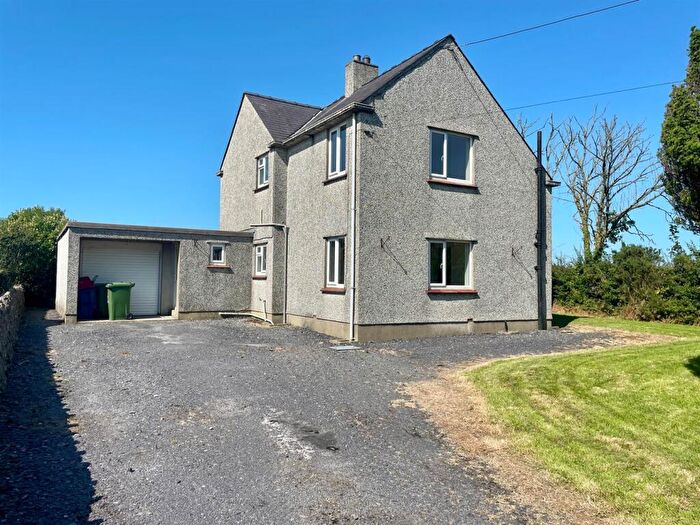
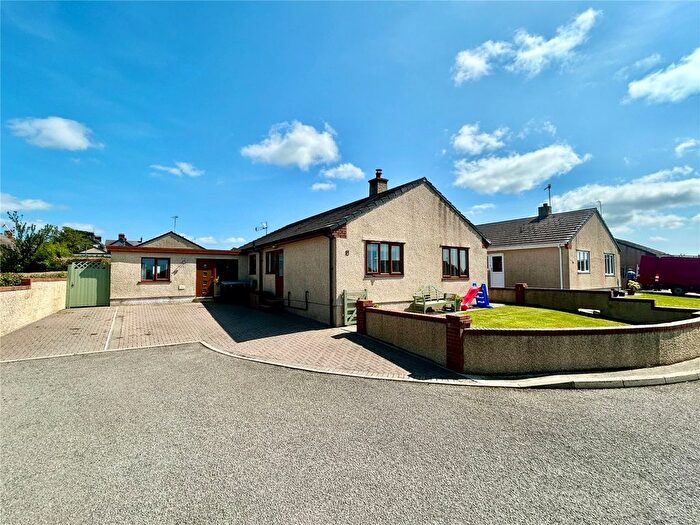
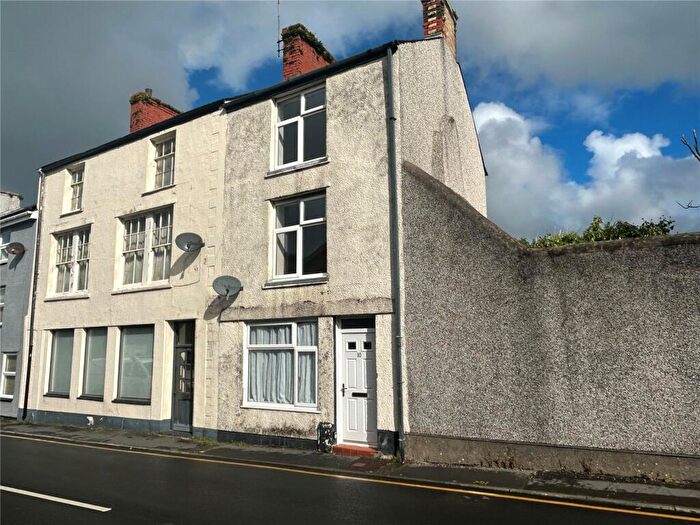
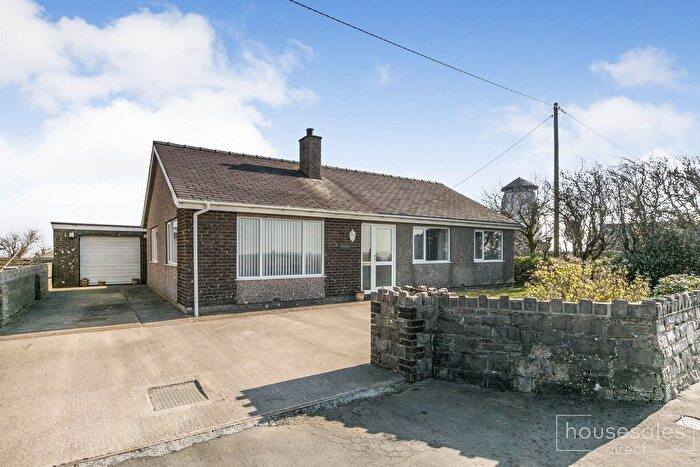
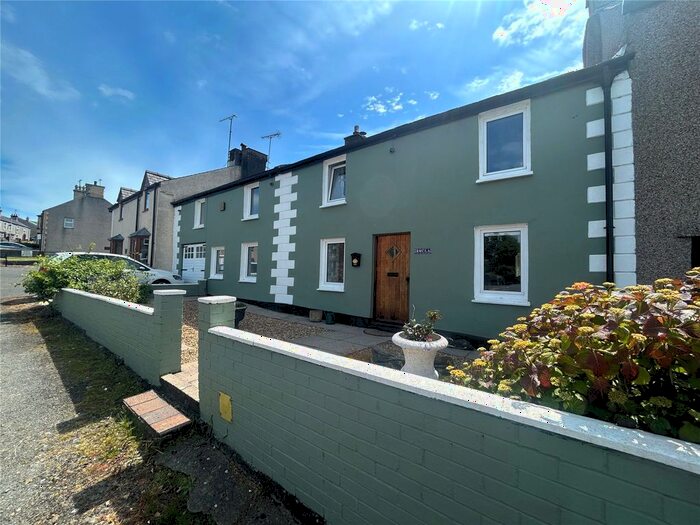
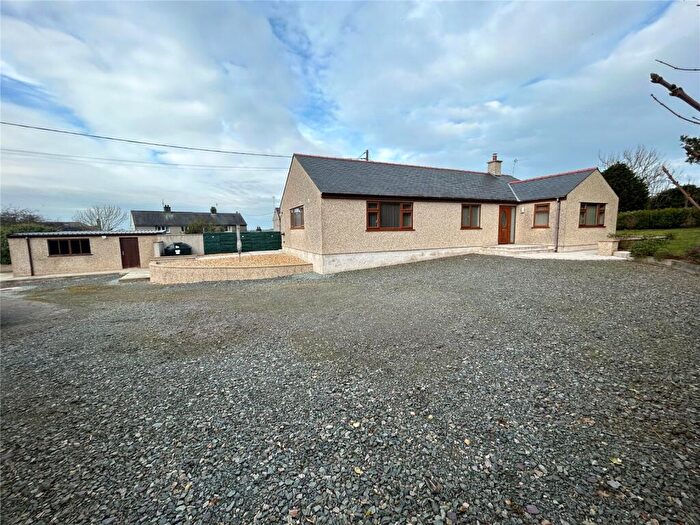
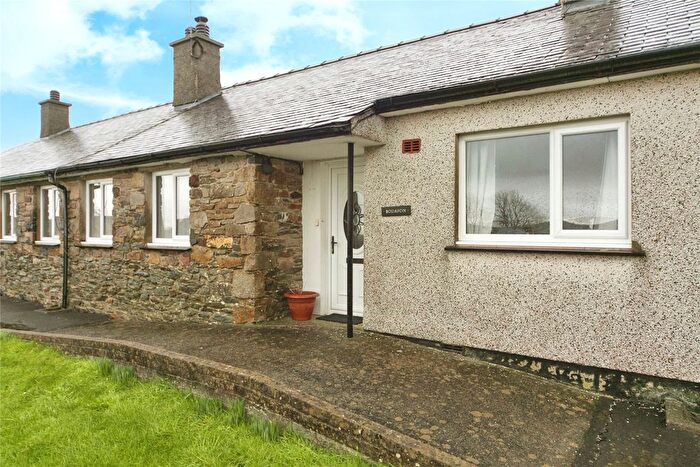
Houses for sale & to rent in Talybolion, Llanerchymedd
House Prices in Talybolion
Properties in Talybolion have an average house price of £199,085.00 and had 51 Property Transactions within the last 3 years¹.
Talybolion is an area in Llanerchymedd, Sir Ynys Mon - Isle of Anglesey with 510 households², where the most expensive property was sold for £630,000.00.
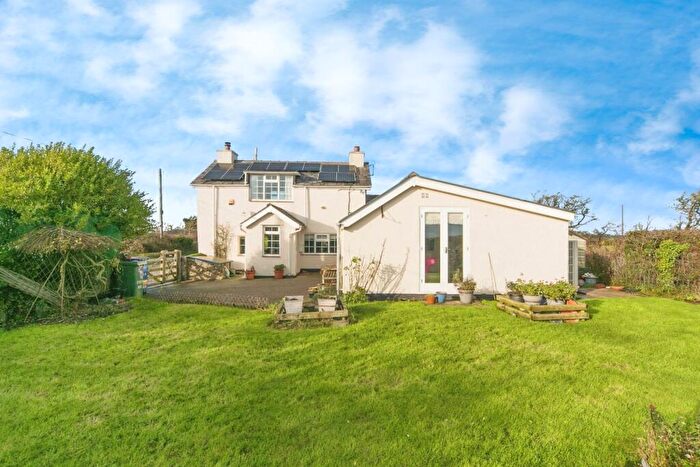
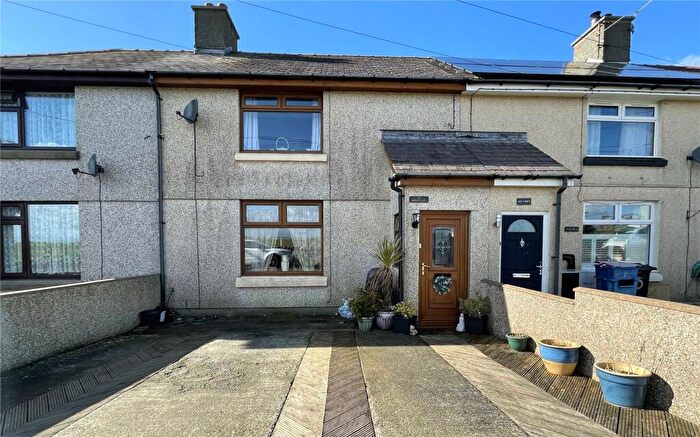
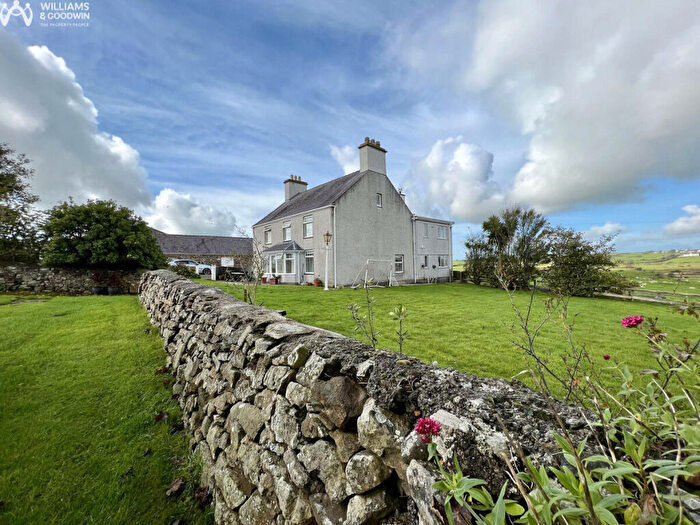
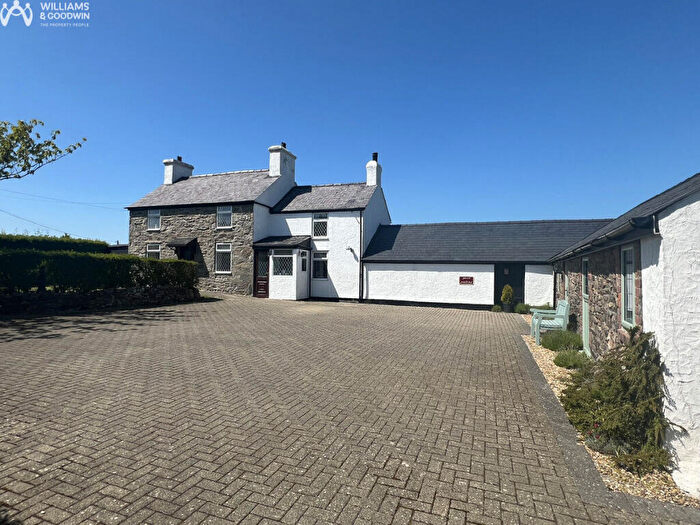
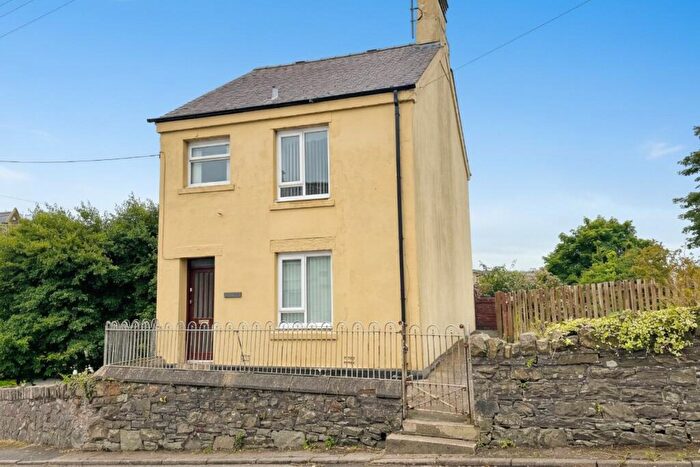
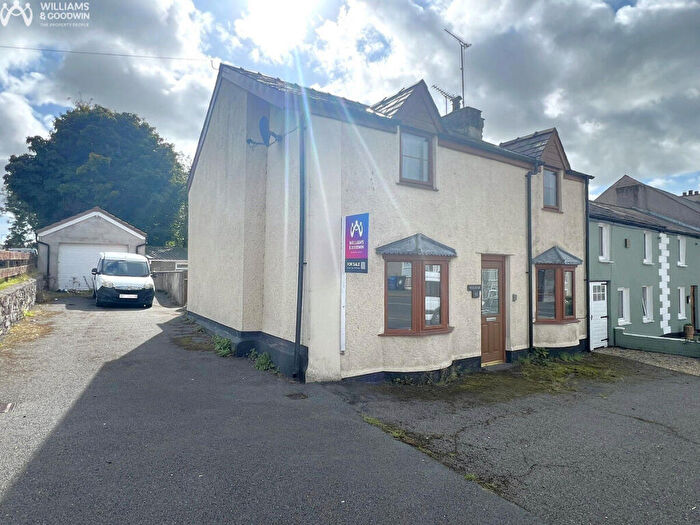
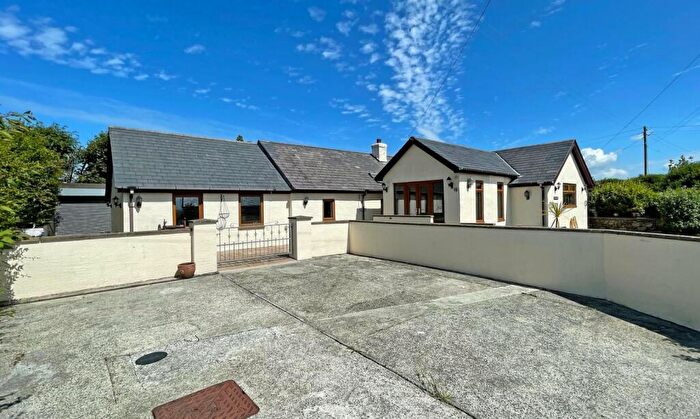
Properties for sale in Talybolion
Previously listed properties in Talybolion
Roads and Postcodes in Talybolion
Navigate through our locations to find the location of your next house in Talybolion, Llanerchymedd for sale or to rent.
| Streets | Postcodes |
|---|---|
| Bridge Street | LL71 8BU LL71 8EU |
| Bryncir Estate | LL71 8EQ |
| California Terrace | LL71 8DD |
| Chwaen Terrace | LL71 7AD |
| Coedwig Street | LL71 7BB |
| Einion Lane | LL71 8EF |
| Farmer Street | LL71 8DT |
| Gladstone Terrace | LL71 7AA |
| High Street | LL71 8EA LL71 8EB |
| Holyhead Road | LL71 7AB |
| Lon Cilgwyn | LL71 8ED |
| Lon Coedana | LL71 8AA |
| Maes Athen | LL71 8DL |
| Maes Ceidio | LL71 7AE |
| Market Square | LL71 8BY |
| Tan Y Foel | LL71 8ES |
| The Square | LL71 8DA |
| Twrcuhelyn Street | LL71 8DB LL71 8DU |
| Water Street | LL71 8DR |
| Wellington Street | LL71 8DP |
| Y Garth | LL71 7BD |
| LL71 7AF LL71 7AG LL71 7BE LL71 7BH LL71 7BN LL71 7BP LL71 7BT LL71 7BU LL71 7DB LL71 7DG LL71 7DH LL71 7DL LL71 8AB LL71 8DF LL71 8EG LL71 8EH LL71 8EP LL71 8ER LL71 8EW LL71 7AR LL71 7BG LL71 7BL LL71 7BS LL71 7BY LL71 7DA LL71 7DD LL71 7DE LL71 7DF |
Transport near Talybolion
- FAQ
- Price Paid By Year
- Property Type Price
Frequently asked questions about Talybolion
What is the average price for a property for sale in Talybolion?
The average price for a property for sale in Talybolion is £199,085. This amount is 12% lower than the average price in Llanerchymedd. There are 43 property listings for sale in Talybolion.
What streets have the most expensive properties for sale in Talybolion?
The streets with the most expensive properties for sale in Talybolion are Bryncir Estate at an average of £279,000, Lon Coedana at an average of £278,750 and Coedwig Street at an average of £180,000.
What streets have the most affordable properties for sale in Talybolion?
The streets with the most affordable properties for sale in Talybolion are Twrcuhelyn Street at an average of £75,000, Holyhead Road at an average of £87,500 and Bridge Street at an average of £91,725.
Which train stations are available in or near Talybolion?
Some of the train stations available in or near Talybolion are Valley, Rhosneigr and Ty Croes.
Property Price Paid in Talybolion by Year
The average sold property price by year was:
| Year | Average Sold Price | Price Change |
Sold Properties
|
|---|---|---|---|
| 2025 | £150,161 | -22% |
9 Properties |
| 2024 | £183,547 | -13% |
20 Properties |
| 2023 | £207,500 | -17% |
6 Properties |
| 2022 | £242,871 | 15% |
16 Properties |
| 2021 | £206,447 | 6% |
20 Properties |
| 2020 | £194,230 | 30% |
13 Properties |
| 2019 | £136,703 | -26% |
16 Properties |
| 2018 | £172,235 | 6% |
21 Properties |
| 2017 | £162,687 | -1% |
16 Properties |
| 2016 | £163,609 | 10% |
22 Properties |
| 2015 | £147,583 | -13% |
12 Properties |
| 2014 | £167,025 | 42% |
8 Properties |
| 2013 | £97,600 | 12% |
10 Properties |
| 2012 | £86,285 | -60% |
7 Properties |
| 2011 | £138,250 | 12% |
10 Properties |
| 2010 | £121,750 | -26% |
6 Properties |
| 2009 | £153,777 | 25% |
9 Properties |
| 2008 | £116,062 | -30% |
8 Properties |
| 2007 | £150,469 | -2% |
18 Properties |
| 2006 | £153,555 | 17% |
9 Properties |
| 2005 | £126,952 | 17% |
25 Properties |
| 2004 | £105,788 | 20% |
29 Properties |
| 2003 | £84,631 | 36% |
34 Properties |
| 2002 | £54,496 | 8% |
27 Properties |
| 2001 | £50,246 | 24% |
16 Properties |
| 2000 | £38,100 | -6% |
5 Properties |
| 1999 | £40,415 | 20% |
16 Properties |
| 1998 | £32,499 | 3% |
11 Properties |
| 1997 | £31,583 | -8% |
9 Properties |
| 1996 | £34,125 | -25% |
10 Properties |
| 1995 | £42,642 | - |
7 Properties |
Property Price per Property Type in Talybolion
Here you can find historic sold price data in order to help with your property search.
The average Property Paid Price for specific property types in the last three years are:
| Property Type | Average Sold Price | Sold Properties |
|---|---|---|
| Detached House | £306,997.00 | 19 Detached Houses |
| Terraced House | £126,710.00 | 28 Terraced Houses |
| Semi Detached House | £193,125.00 | 4 Semi Detached Houses |

