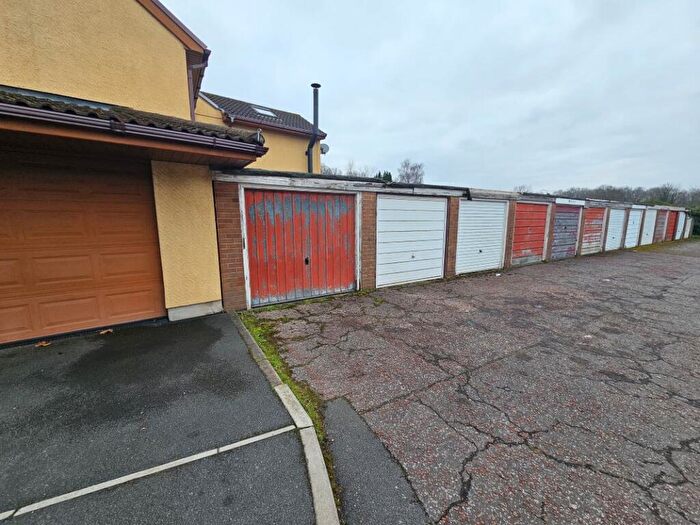
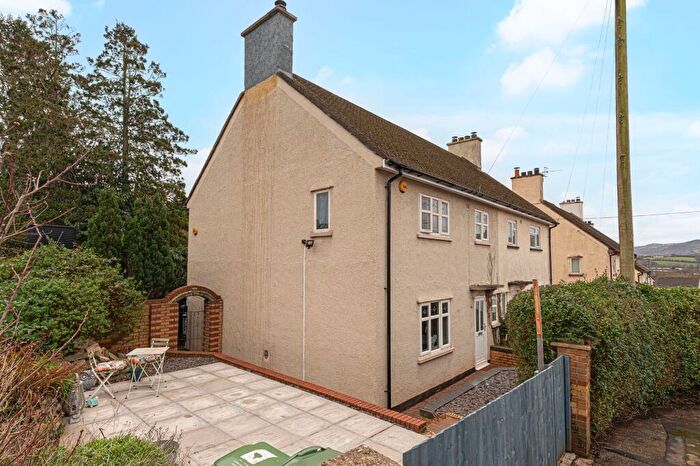
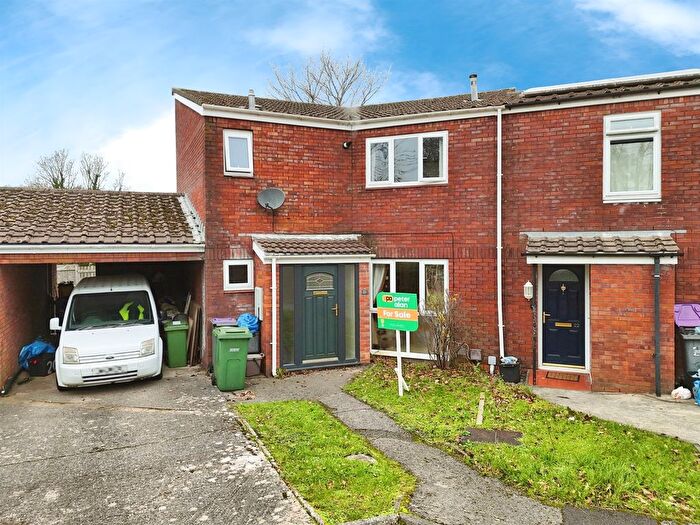
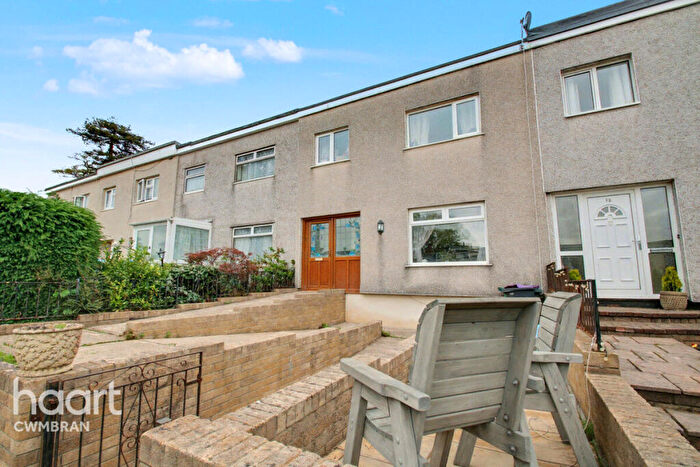
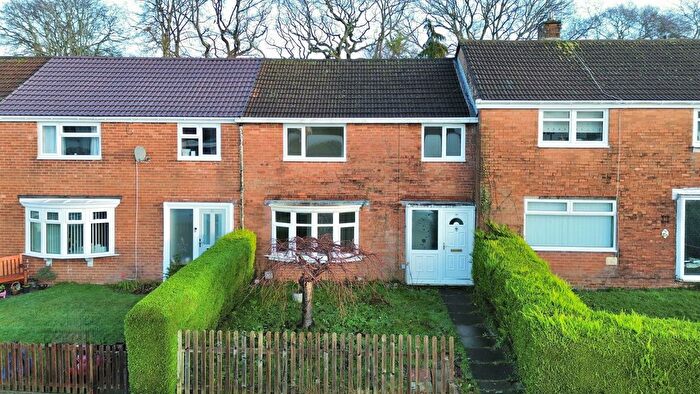
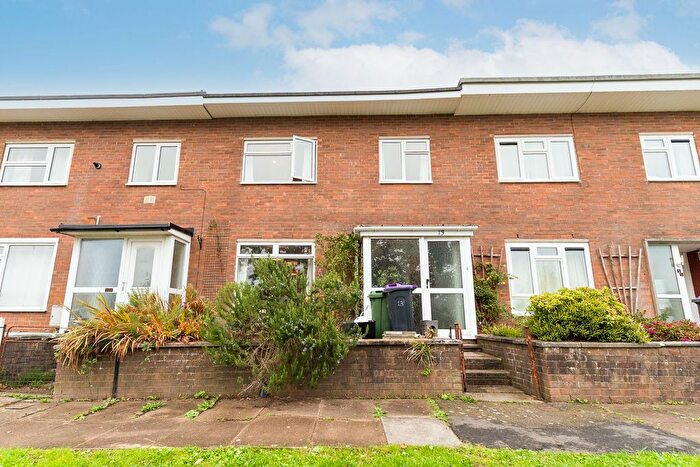
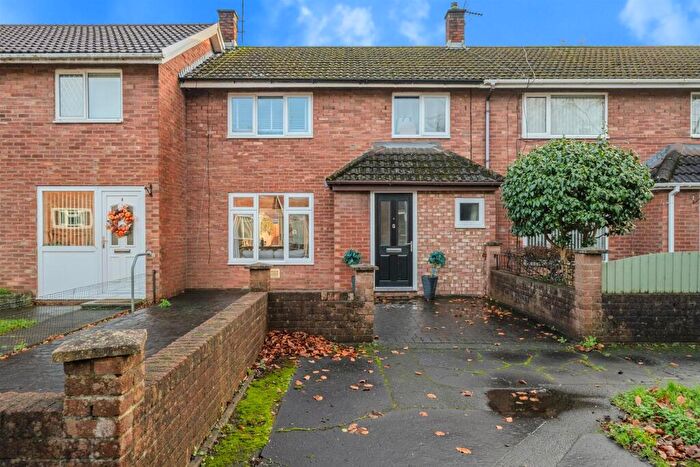
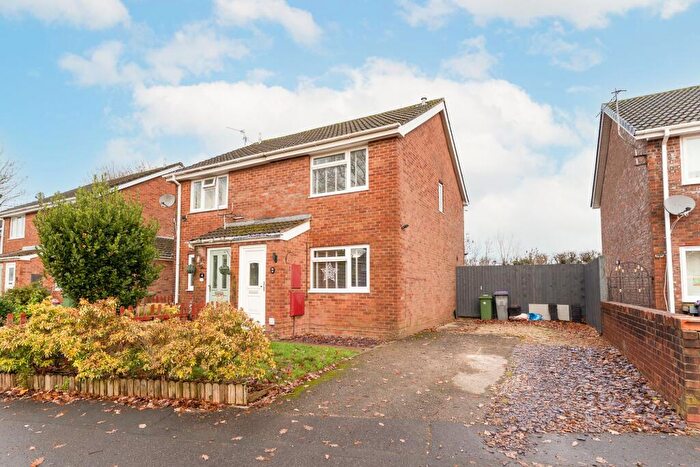
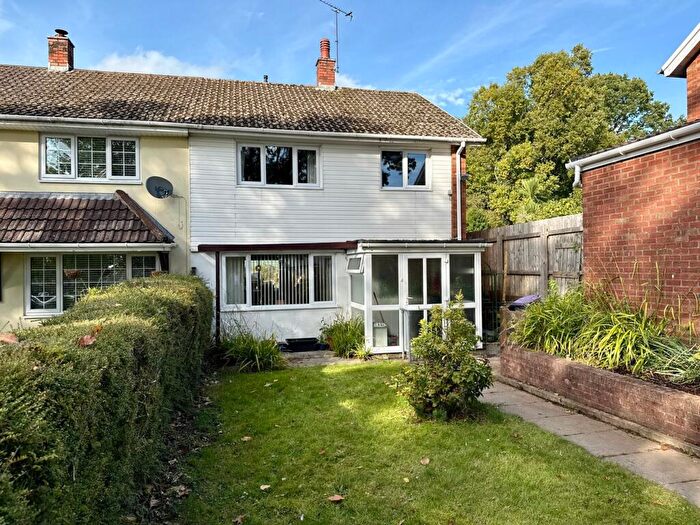
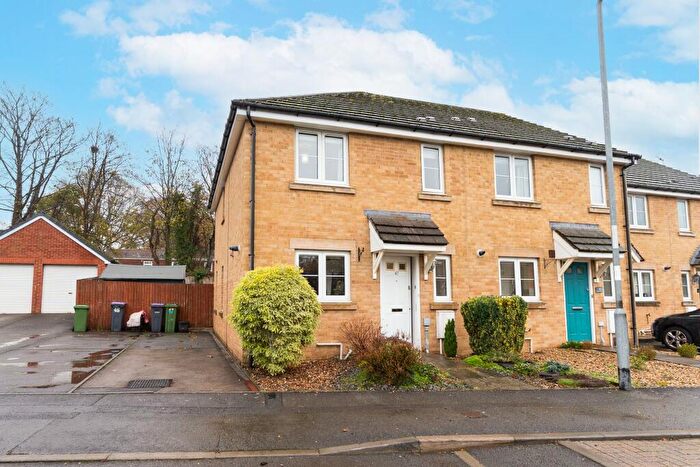
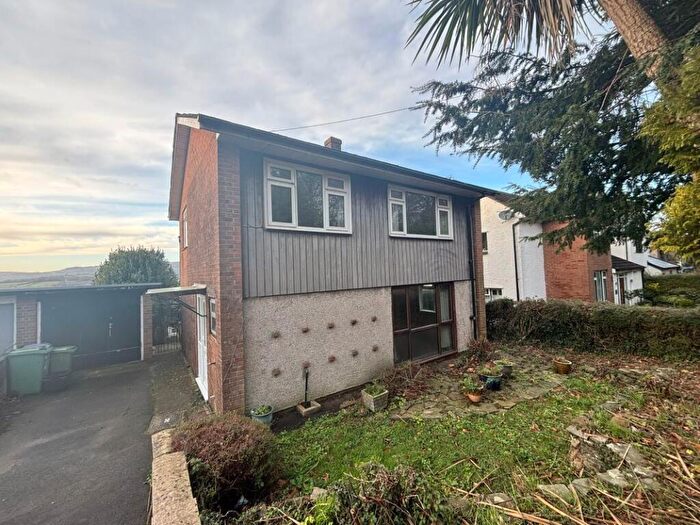
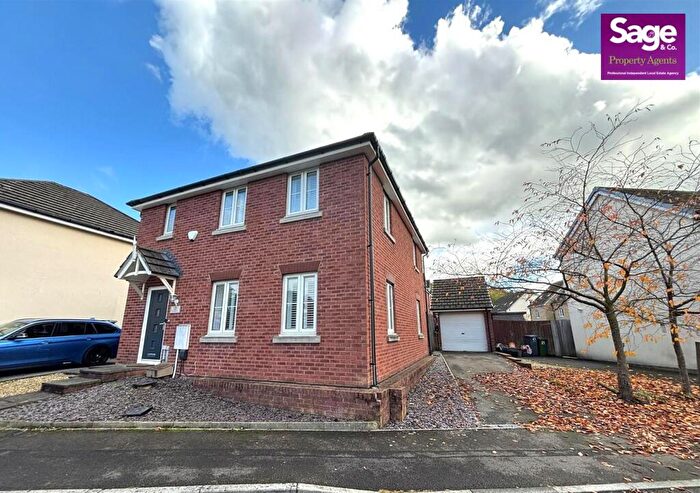
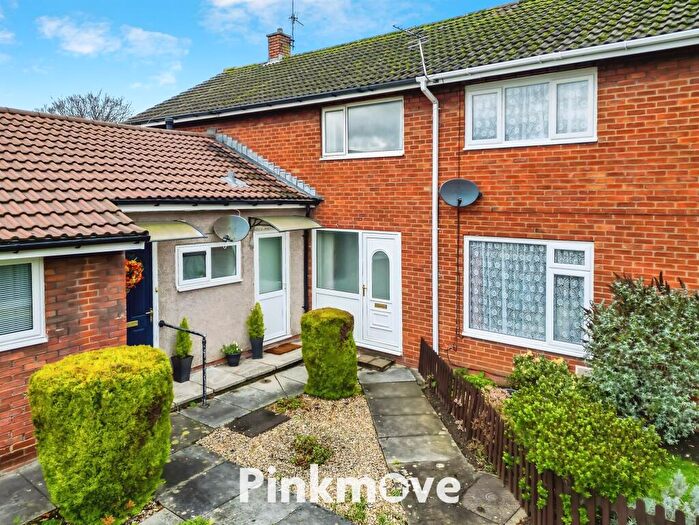
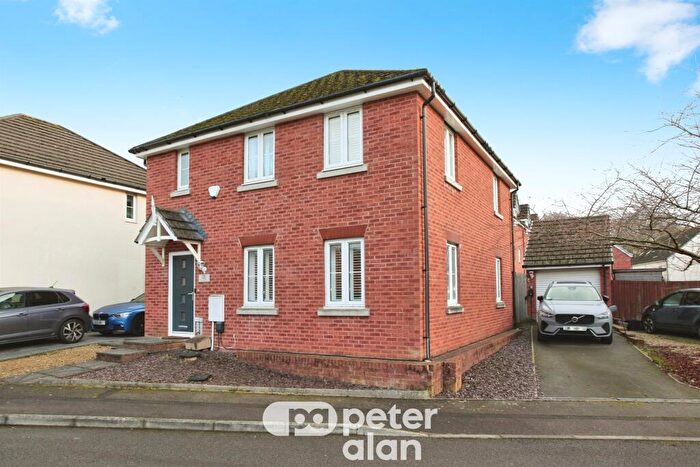
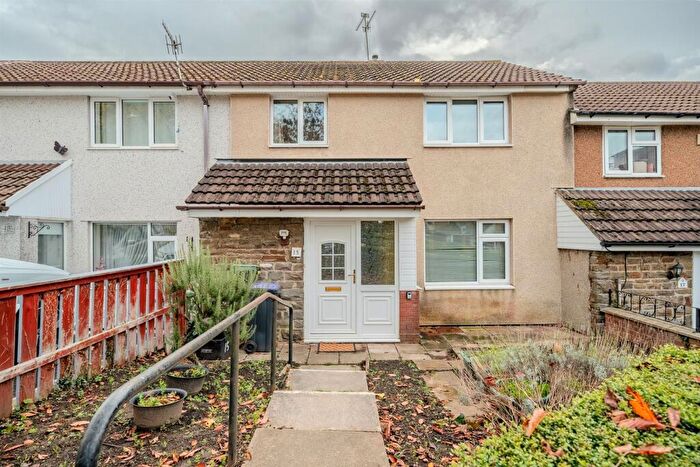
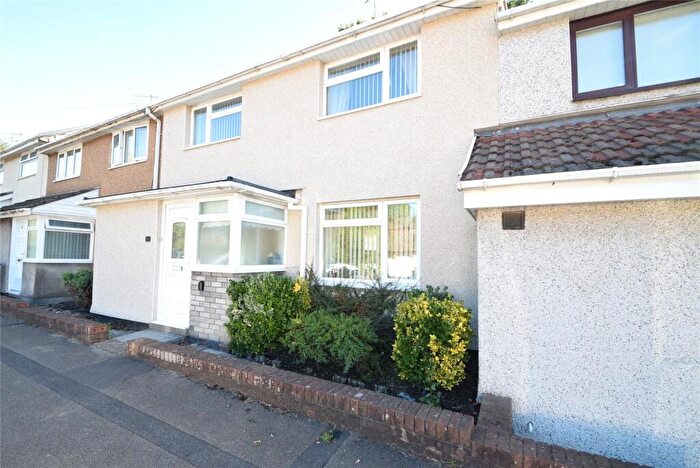
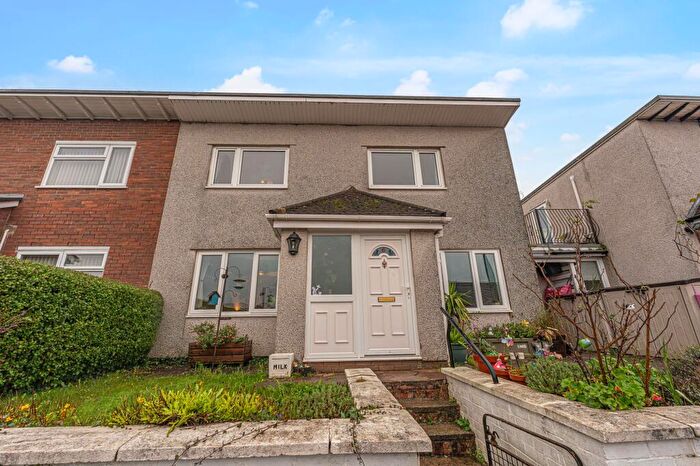
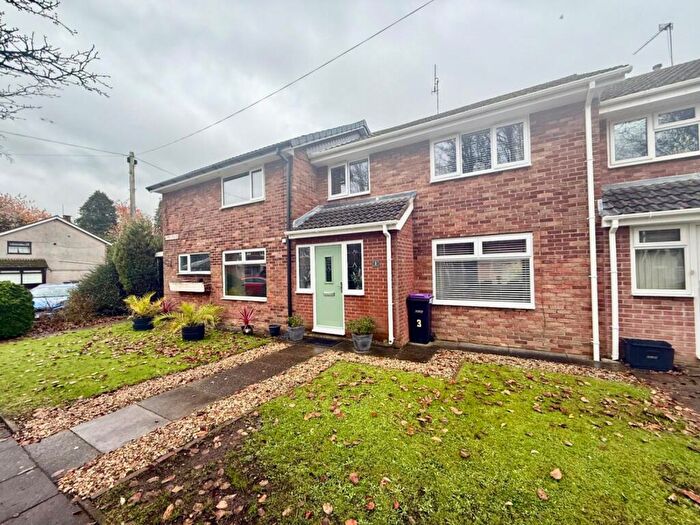
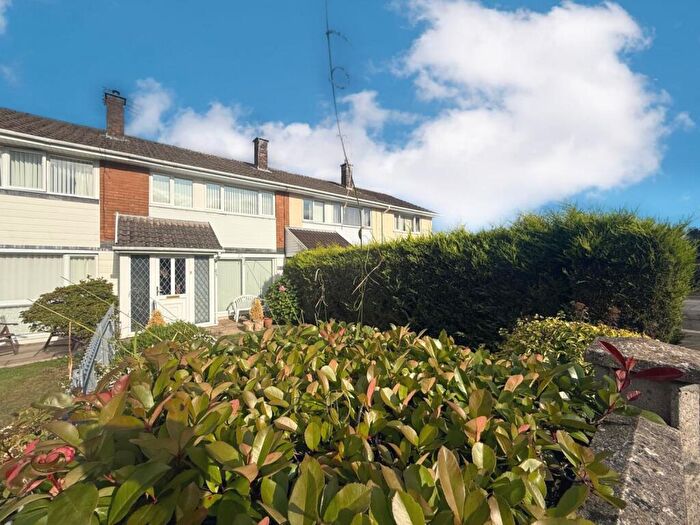
Houses for sale & to rent in Croesyceiliog South, Cwmbran
House Prices in Croesyceiliog South
Properties in Croesyceiliog South have an average house price of £228,856.00 and had 73 Property Transactions within the last 3 years¹.
Croesyceiliog South is an area in Cwmbran, Tor-faen - Torfaen with 863 households², where the most expensive property was sold for £476,000.00.
Properties for sale in Croesyceiliog South
Roads and Postcodes in Croesyceiliog South
Navigate through our locations to find the location of your next house in Croesyceiliog South, Cwmbran for sale or to rent.
| Streets | Postcodes |
|---|---|
| Ashford Close | NP44 2AY NP44 2AZ |
| Ashford Close North | NP44 2BL |
| Ashford Close South | NP44 2BE NP44 2BH |
| Bamber Houses | NP44 2AR |
| Bron Y Garth | NP44 2EP |
| Bryn Eglwys | NP44 2LE NP44 2LF |
| Bryn Garw | NP44 2EH |
| Brynhyfryd | NP44 2ET NP44 2EU |
| Cae Rhedyn | NP44 2BB |
| Cherry Tree Close | NP44 2ES |
| Church Close | NP44 2EJ |
| Cwrt Glas | NP44 2EE NP44 2EF |
| Denton Houses | NP44 2AX |
| Ebury Houses | NP44 2AU |
| Fairoak Lane | NP44 2EB |
| Foley Houses | NP44 2AT |
| Garw Row | NP44 2HB |
| Hanfield Park | NP44 2DT |
| Jim Crow Square | NP44 2HH |
| Llwyn Onn | NP44 2AL |
| Lon Helyg | NP44 2BD |
| Meadow Lane | NP44 2EY |
| North Road | NP44 2EN NP44 2EW |
| Pen Bedw | NP44 2AS |
| Pettingale Road | NP44 2PG |
| Plantation Drive | NP44 2AN NP44 2AW |
| Plas Derwen | NP44 2EA |
| Poplar Road | NP44 2EG NP44 2EQ |
| Rose Gardens | NP44 2HN |
| Royal Oak Green | NP44 2ER |
| Spring Lane | NP44 2ED |
| St Marys Road | NP44 2EL |
| Tewdric Court | NP44 2HP |
| The Highway | NP44 2BG NP44 2BQ NP44 2HD NP44 2HF |
| The Oaks | NP44 2EX |
| Turnpike Road | NP44 2AH NP44 2BJ NP44 2YB |
| Weldon Close | NP44 2PB |
| Whitehouse Road | NP44 2EZ |
| Woodland Court | NP44 2HG |
| Woodland Road | NP44 2DU NP44 2DX NP44 2DZ NP44 2YA |
| Woodland View | NP44 2DA |
| NP44 2AP NP44 2BA |
Transport near Croesyceiliog South
- FAQ
- Price Paid By Year
- Property Type Price
Frequently asked questions about Croesyceiliog South
What is the average price for a property for sale in Croesyceiliog South?
The average price for a property for sale in Croesyceiliog South is £228,856. This amount is 6% higher than the average price in Cwmbran. There are 476 property listings for sale in Croesyceiliog South.
What streets have the most expensive properties for sale in Croesyceiliog South?
The streets with the most expensive properties for sale in Croesyceiliog South are Ashford Close at an average of £390,000, Plantation Drive at an average of £337,033 and Ashford Close South at an average of £335,000.
What streets have the most affordable properties for sale in Croesyceiliog South?
The streets with the most affordable properties for sale in Croesyceiliog South are Rose Gardens at an average of £161,333, North Road at an average of £168,116 and Poplar Road at an average of £185,625.
Which train stations are available in or near Croesyceiliog South?
Some of the train stations available in or near Croesyceiliog South are Cwmbran, Pontypool and New Inn and Newport (Gwent).
Property Price Paid in Croesyceiliog South by Year
The average sold property price by year was:
| Year | Average Sold Price | Price Change |
Sold Properties
|
|---|---|---|---|
| 2025 | £224,300 | -8% |
10 Properties |
| 2024 | £241,869 | 2% |
21 Properties |
| 2023 | £237,657 | 11% |
19 Properties |
| 2022 | £211,685 | -19% |
23 Properties |
| 2021 | £252,756 | 14% |
29 Properties |
| 2020 | £217,617 | 14% |
22 Properties |
| 2019 | £187,069 | -2% |
28 Properties |
| 2018 | £190,581 | -0,3% |
29 Properties |
| 2017 | £191,233 | 8% |
18 Properties |
| 2016 | £176,010 | -1% |
28 Properties |
| 2015 | £177,233 | 17% |
25 Properties |
| 2014 | £147,409 | -2% |
22 Properties |
| 2013 | £150,368 | -5% |
19 Properties |
| 2012 | £157,845 | 0,2% |
21 Properties |
| 2011 | £157,456 | 13% |
20 Properties |
| 2010 | £136,275 | 3% |
18 Properties |
| 2009 | £132,033 | -12% |
25 Properties |
| 2008 | £147,250 | -16% |
18 Properties |
| 2007 | £170,883 | 5% |
27 Properties |
| 2006 | £162,448 | 18% |
23 Properties |
| 2005 | £133,339 | 2% |
19 Properties |
| 2004 | £130,853 | 8% |
15 Properties |
| 2003 | £119,994 | 16% |
25 Properties |
| 2002 | £101,124 | 31% |
39 Properties |
| 2001 | £70,256 | 12% |
30 Properties |
| 2000 | £61,626 | -7% |
28 Properties |
| 1999 | £65,962 | 14% |
29 Properties |
| 1998 | £56,747 | -15% |
22 Properties |
| 1997 | £65,434 | 20% |
13 Properties |
| 1996 | £52,496 | 12% |
26 Properties |
| 1995 | £46,400 | - |
15 Properties |
Property Price per Property Type in Croesyceiliog South
Here you can find historic sold price data in order to help with your property search.
The average Property Paid Price for specific property types in the last three years are:
| Property Type | Average Sold Price | Sold Properties |
|---|---|---|
| Semi Detached House | £237,541.00 | 12 Semi Detached Houses |
| Detached House | £331,822.00 | 18 Detached Houses |
| Terraced House | £196,620.00 | 35 Terraced Houses |
| Flat | £125,190.00 | 8 Flats |

