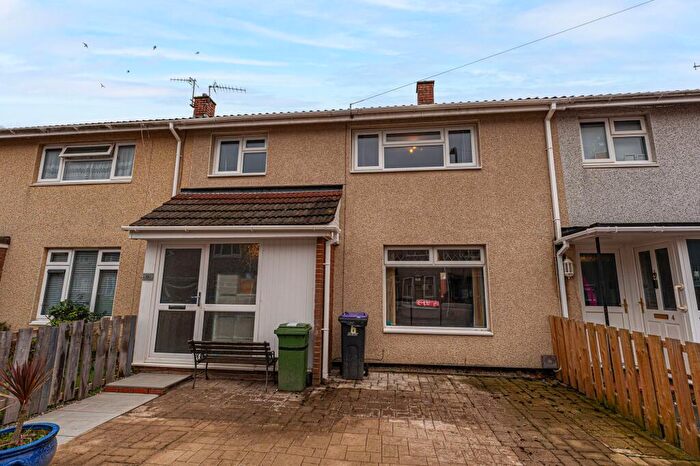
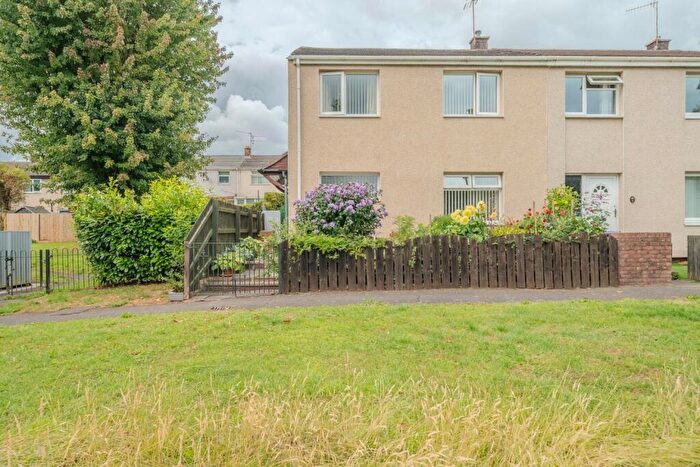
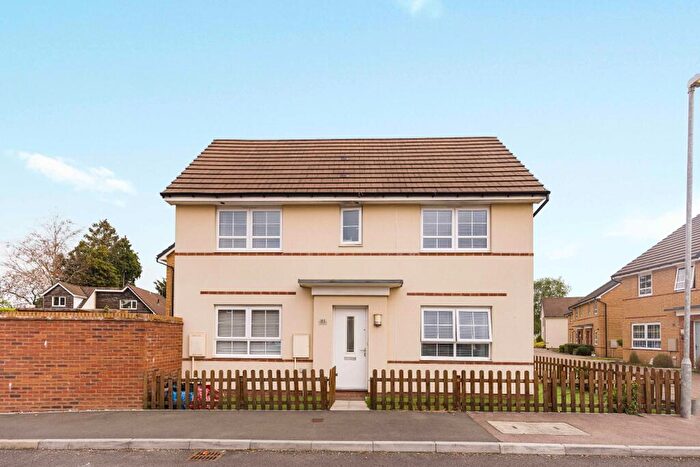
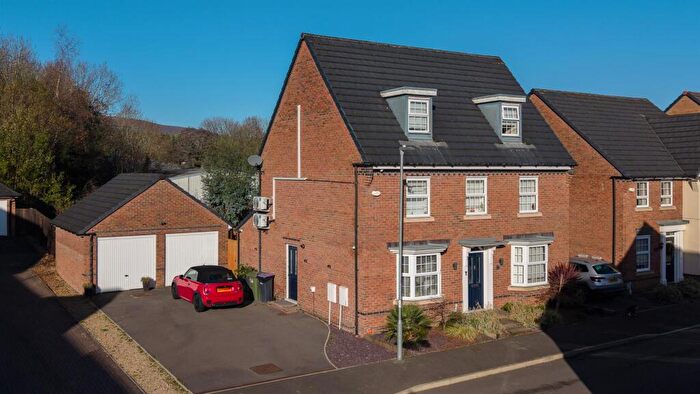
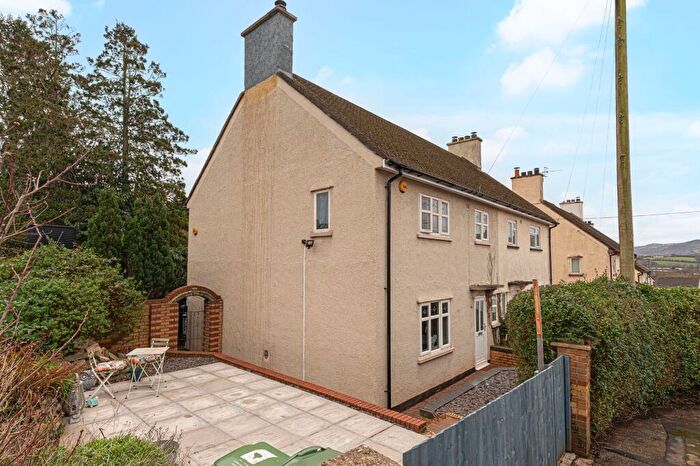
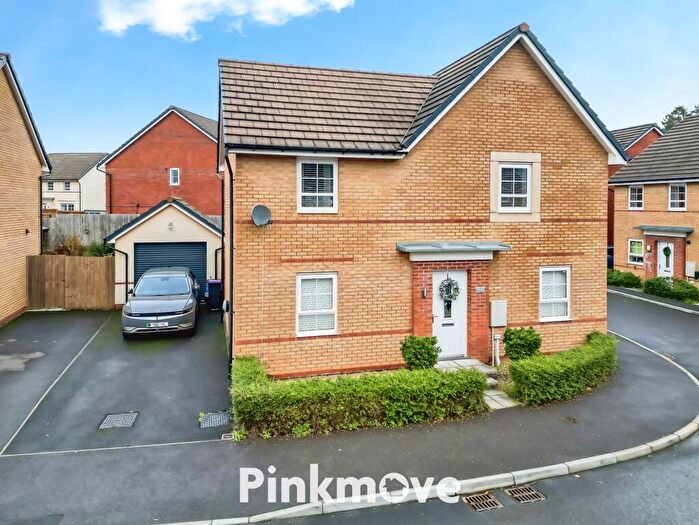
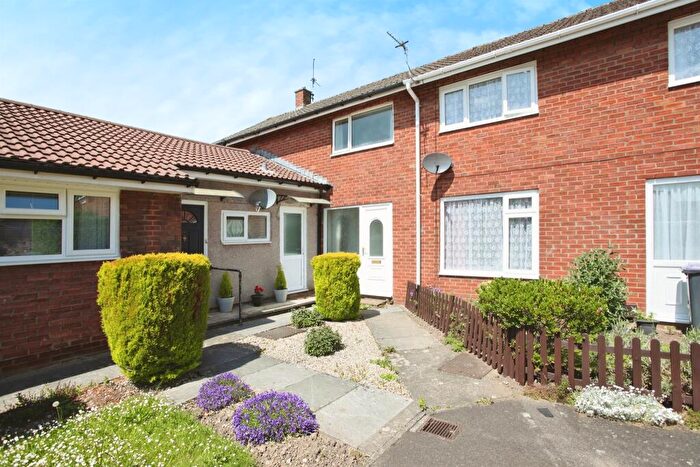
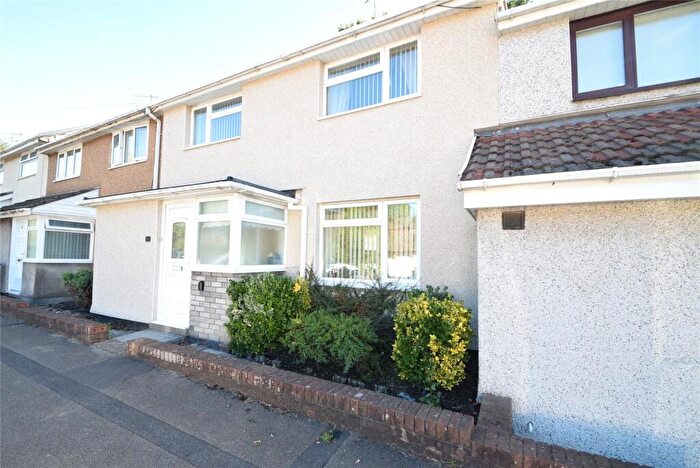
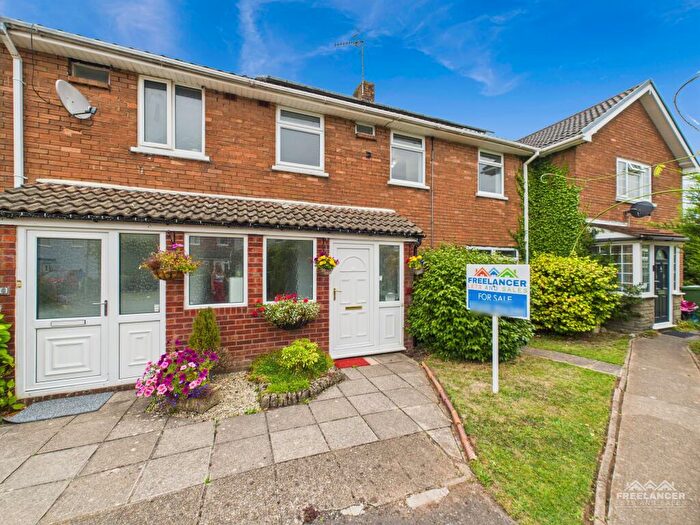
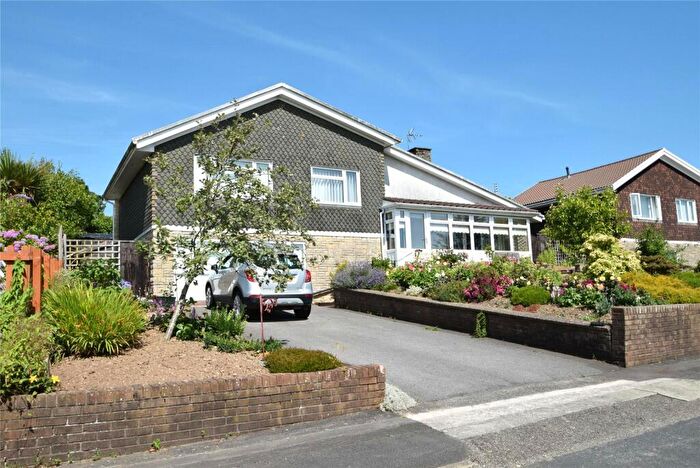
Houses for sale & to rent in Llanyrafon West, Cwmbran
House Prices in Llanyrafon West
Properties in Llanyrafon West have an average house price of £211,570.00 and had 102 Property Transactions within the last 3 years¹.
Llanyrafon West is an area in Cwmbran, Tor-faen - Torfaen with 1,139 households², where the most expensive property was sold for £440,000.00.
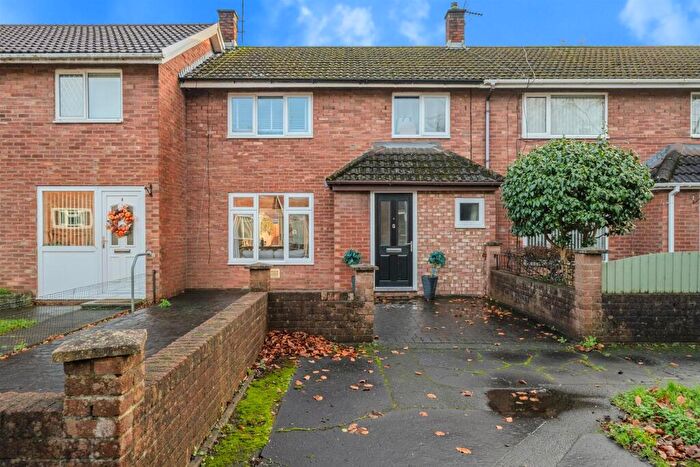
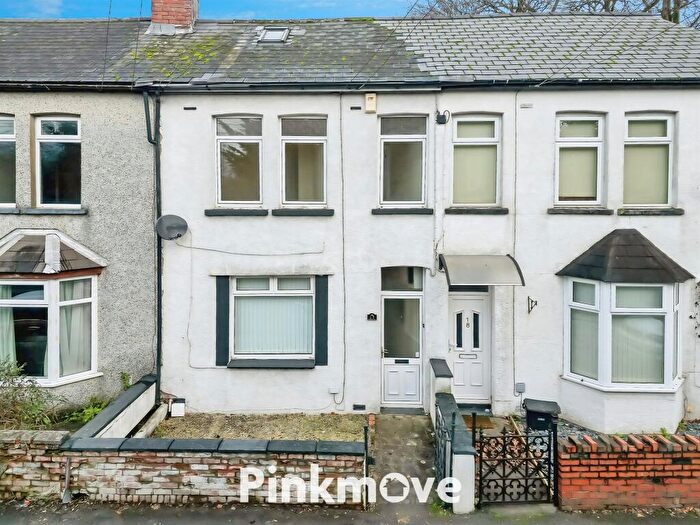
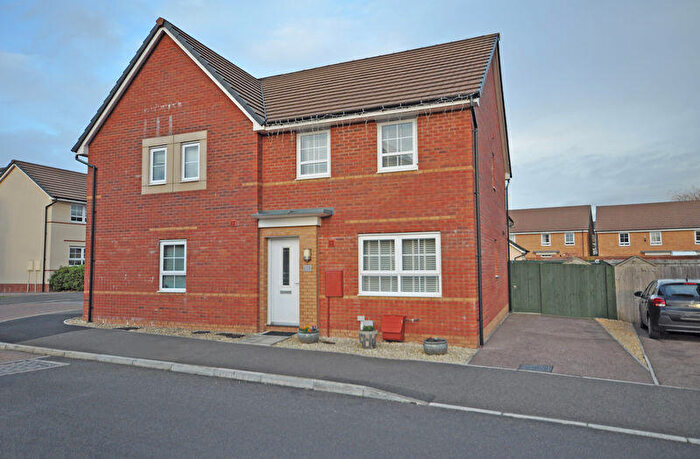
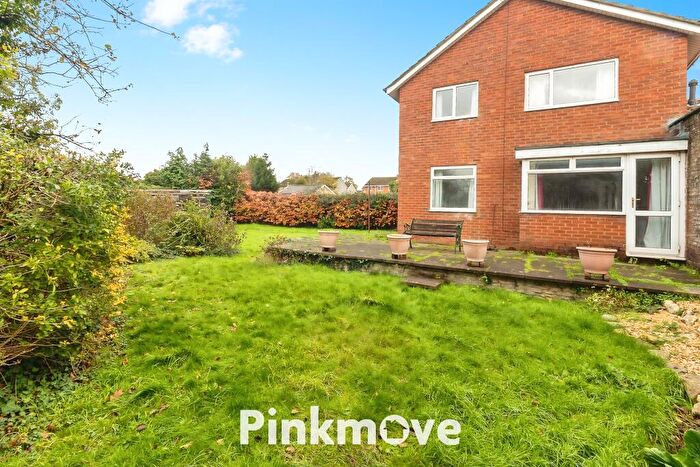
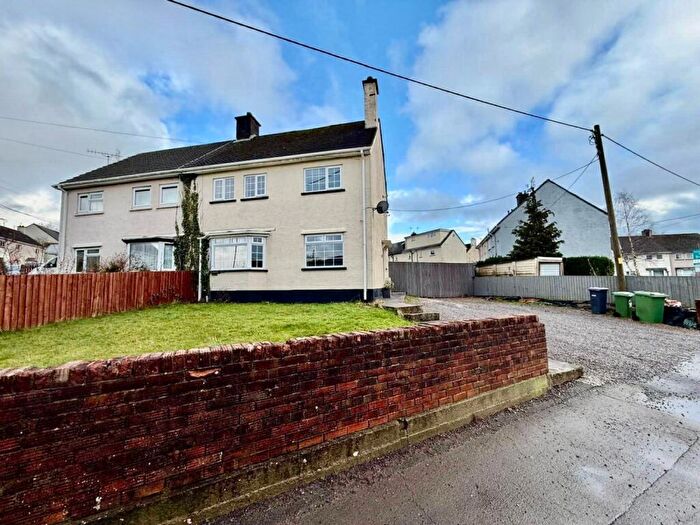
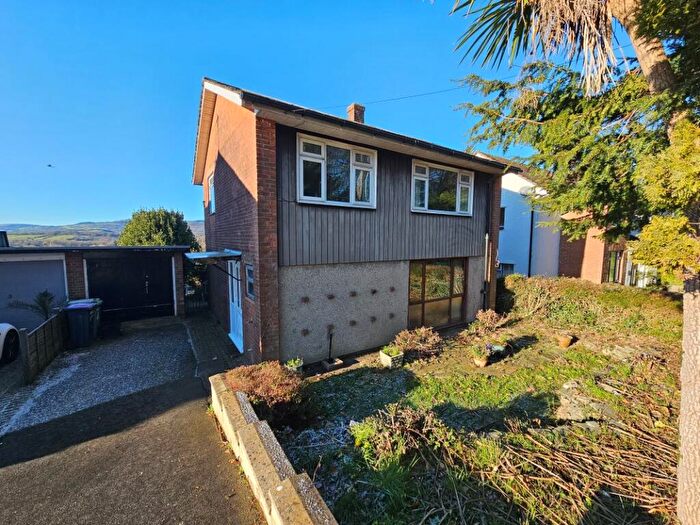
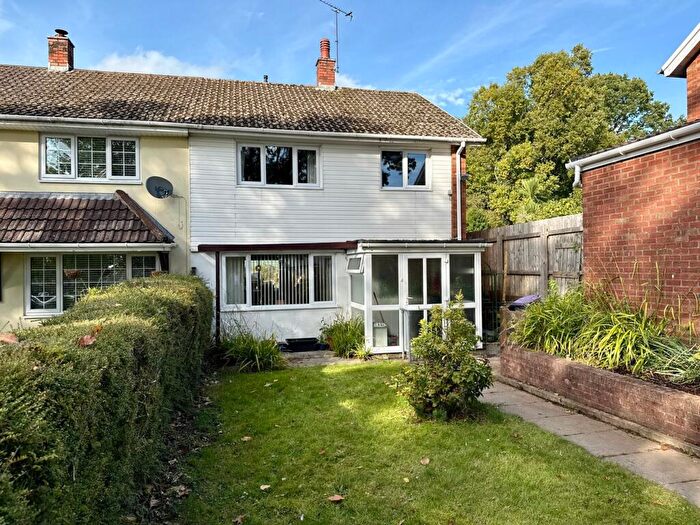
Properties for sale in Llanyrafon West
Previously listed properties in Llanyrafon West
Roads and Postcodes in Llanyrafon West
Navigate through our locations to find the location of your next house in Llanyrafon West, Cwmbran for sale or to rent.
| Streets | Postcodes |
|---|---|
| Avon Place | NP44 8SZ |
| Beaumaris Drive | NP44 8HY NP44 8HZ NP44 8JA NP44 8SJ |
| Beaumaris Houses | NP44 8HX |
| Caernarvon Crescent | NP44 8SS NP44 8ST NP44 8SU NP44 8SX |
| Ceredig Court | NP44 8SA |
| Cilgerran Court | NP44 8RL |
| Commodore Lane | NP44 8JN |
| Dorstone Walk | NP44 8TD |
| Dunraven Road | NP44 8RW |
| Dynevor Close | NP44 8RG |
| Friars Garden | NP44 8JF |
| Gloucester Close | NP44 8RB |
| Goodrich Court | NP44 8RY |
| Hawarden Green | NP44 8RU |
| Hensol Close | NP44 8SY |
| Kenfig Place | NP44 8TH |
| Kidwelly Close | NP44 8RS |
| Kidwelly Road | NP44 8RP NP44 8RR |
| Land Adjoining | NP44 2AG |
| Liswerry Close | NP44 8RZ |
| Liswerry Drive | NP44 8RD NP44 8RE NP44 8RF NP44 8RH |
| Llanfrechfa Way | NP44 8HT |
| Llangorse Path | NP44 8JL |
| Llangorse Road | NP44 8HU |
| Llanyravon Square | NP44 8HR NP44 8HS |
| Llanyravon Way | NP44 8HN NP44 8HP NP44 8HW NP44 8RA |
| Llyswen Walk | NP44 8JH |
| Ludlow Close | NP44 8JQ |
| Manorbier Drive | NP44 8TG NP44 8TQ |
| Mill Lane | NP44 8SH |
| Millers Ride | NP44 8TL |
| Miskin Green | NP44 8TF |
| Miskin Houses | NP44 8TP |
| Narberth Crescent | NP44 8RJ |
| Nevern Walk | NP44 8RX |
| Ogmore Place | NP44 8SD |
| Olway Close | NP44 8JJ |
| Paddock Rise | NP44 8JB |
| Pembroke Place | NP44 8RQ |
| Penarth Court | NP44 8JG |
| Penrice Green | NP44 8SG |
| Rhodri Place | NP44 8SF |
| Riversmead | NP44 8TN |
| Roath Court | NP44 8TJ |
| Rumney Walk | NP44 8RN |
| St Brides Close | NP44 8SL |
| St Donats Close | NP44 8SB |
| Stow Path | NP44 8SE |
| Tenby Close | NP44 8TA |
| The Alders | NP44 8JE |
| The Paddocks | NP44 8JD |
| The Pastures | NP44 8SR |
| Tretower Court | NP44 8RT |
| Tudor Woods | NP44 8SN |
| Turnpike Road | NP44 2AQ |
| Worcester Close | NP44 8TE |
| Worcester Path | NP44 8TB |
| NP44 2XJ NP44 2ZA NP44 9SA |
Transport near Llanyrafon West
-
Cwmbran Station
-
Pontypool and New Inn Station
-
Newport (Gwent) Station
-
Rogerstone Station
-
Risca and Pontymister Station
-
Pye Corner Station
- FAQ
- Price Paid By Year
- Property Type Price
Frequently asked questions about Llanyrafon West
What is the average price for a property for sale in Llanyrafon West?
The average price for a property for sale in Llanyrafon West is £211,570. This amount is 3% lower than the average price in Cwmbran. There are 581 property listings for sale in Llanyrafon West.
What streets have the most expensive properties for sale in Llanyrafon West?
The streets with the most expensive properties for sale in Llanyrafon West are The Alders at an average of £415,000, The Paddocks at an average of £358,333 and Gloucester Close at an average of £331,000.
What streets have the most affordable properties for sale in Llanyrafon West?
The streets with the most affordable properties for sale in Llanyrafon West are Liswerry Close at an average of £112,500, Rumney Walk at an average of £135,000 and Paddock Rise at an average of £148,550.
Which train stations are available in or near Llanyrafon West?
Some of the train stations available in or near Llanyrafon West are Cwmbran, Pontypool and New Inn and Newport (Gwent).
Property Price Paid in Llanyrafon West by Year
The average sold property price by year was:
| Year | Average Sold Price | Price Change |
Sold Properties
|
|---|---|---|---|
| 2025 | £227,604 | 1% |
21 Properties |
| 2024 | £224,836 | 14% |
37 Properties |
| 2023 | £192,761 | -15% |
44 Properties |
| 2022 | £221,060 | 10% |
40 Properties |
| 2021 | £198,960 | 15% |
61 Properties |
| 2020 | £169,990 | -5% |
33 Properties |
| 2019 | £178,035 | 13% |
36 Properties |
| 2018 | £154,557 | -14% |
57 Properties |
| 2017 | £175,795 | 11% |
54 Properties |
| 2016 | £157,291 | 14% |
52 Properties |
| 2015 | £134,648 | 1% |
33 Properties |
| 2014 | £133,710 | 5% |
34 Properties |
| 2013 | £127,517 | -7% |
26 Properties |
| 2012 | £135,870 | 9% |
22 Properties |
| 2011 | £123,717 | -26% |
32 Properties |
| 2010 | £155,406 | 22% |
23 Properties |
| 2009 | £120,484 | -24% |
31 Properties |
| 2008 | £149,623 | 5% |
23 Properties |
| 2007 | £141,563 | 13% |
33 Properties |
| 2006 | £123,253 | -2% |
54 Properties |
| 2005 | £126,325 | 5% |
33 Properties |
| 2004 | £120,459 | 15% |
21 Properties |
| 2003 | £102,778 | 21% |
35 Properties |
| 2002 | £80,734 | 27% |
42 Properties |
| 2001 | £58,871 | -14% |
34 Properties |
| 2000 | £67,268 | 3% |
42 Properties |
| 1999 | £65,434 | 11% |
38 Properties |
| 1998 | £58,045 | 5% |
43 Properties |
| 1997 | £55,094 | 15% |
21 Properties |
| 1996 | £46,872 | -9% |
31 Properties |
| 1995 | £50,970 | - |
22 Properties |
Property Price per Property Type in Llanyrafon West
Here you can find historic sold price data in order to help with your property search.
The average Property Paid Price for specific property types in the last three years are:
| Property Type | Average Sold Price | Sold Properties |
|---|---|---|
| Semi Detached House | £238,345.00 | 23 Semi Detached Houses |
| Detached House | £353,681.00 | 11 Detached Houses |
| Terraced House | £193,503.00 | 54 Terraced Houses |
| Flat | £125,607.00 | 14 Flats |

