
Houses for sale & to rent in Llantarnam, Cwmbran
House Prices in Llantarnam
Properties in Llantarnam have an average house price of £255k and had 248 Property Transactions within the last 3 years¹.
Llantarnam is an area in Cwmbran, Tor-faen - Torfaen with 2,341 households², where the most expensive property was sold for £855k.
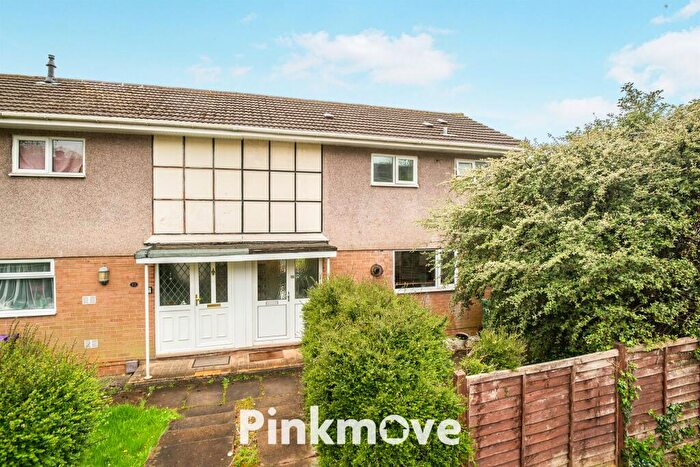
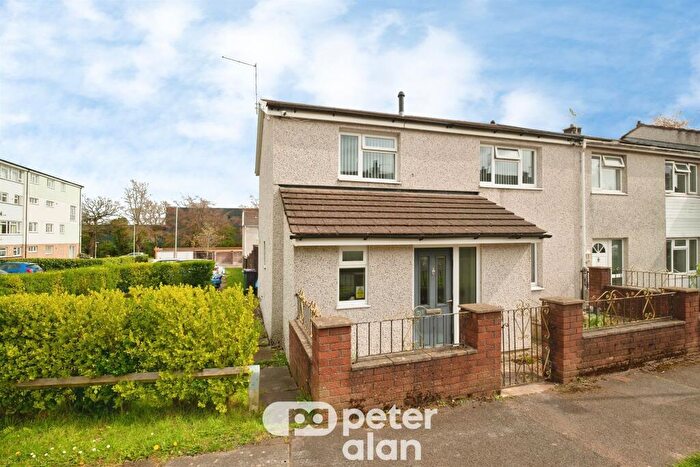
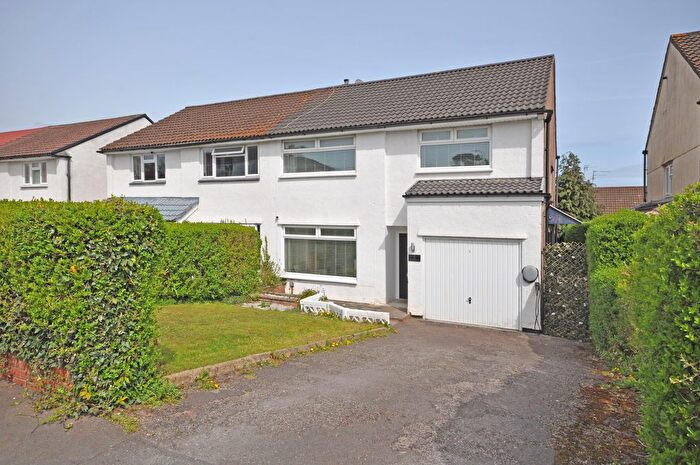
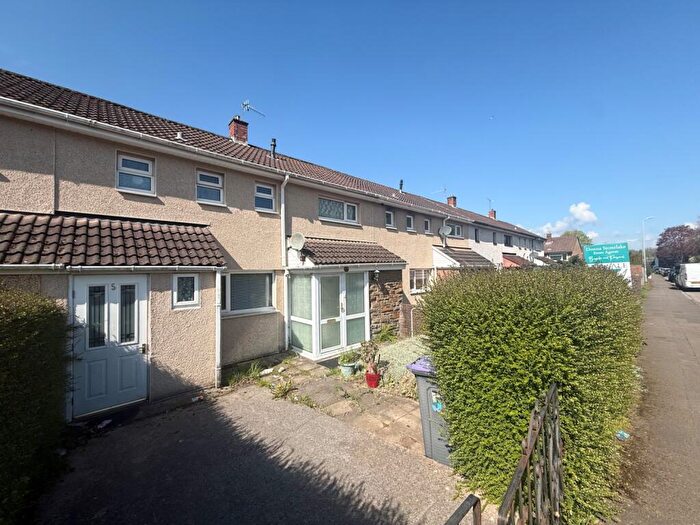
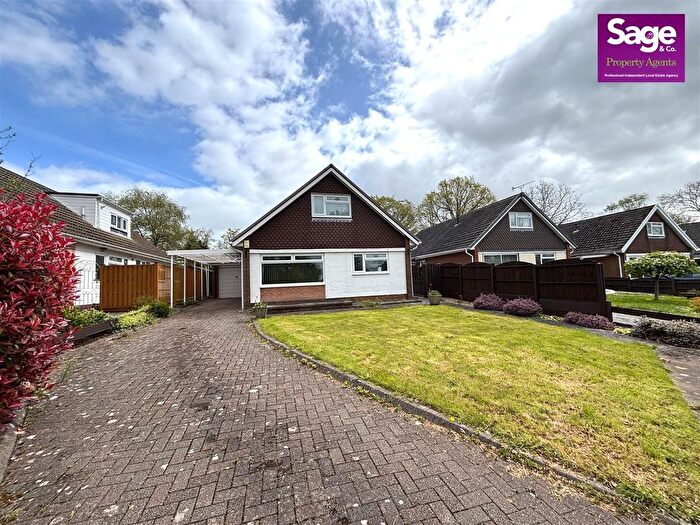
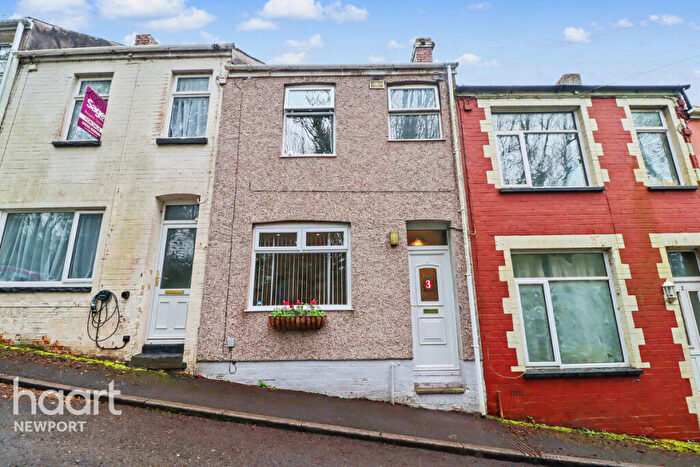
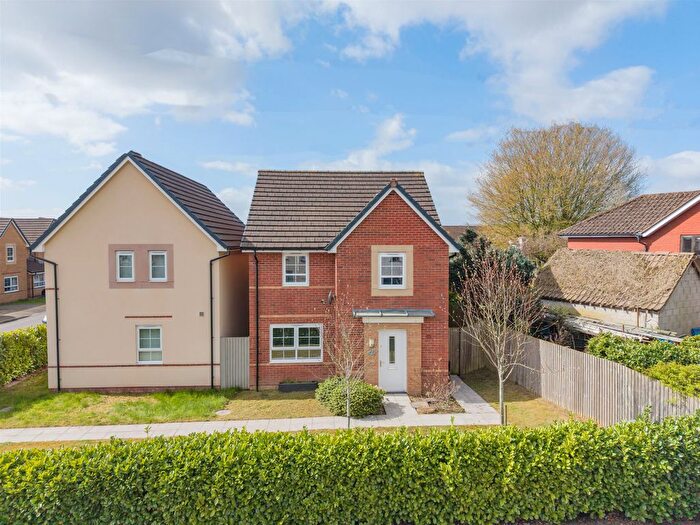
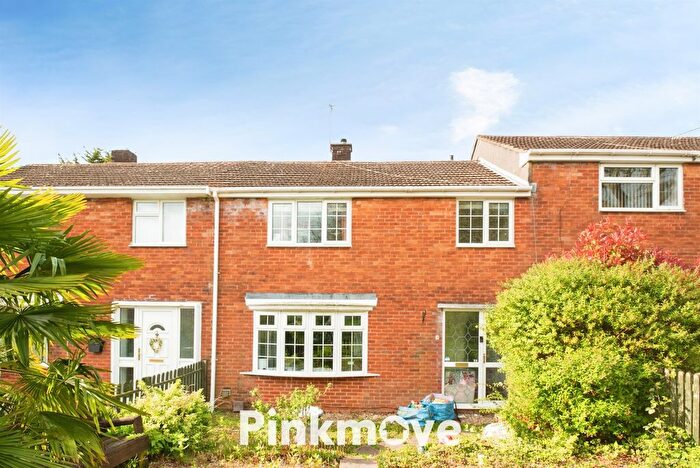
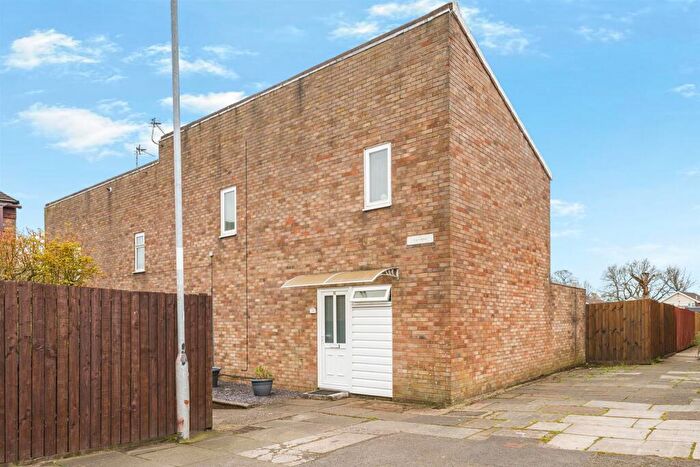
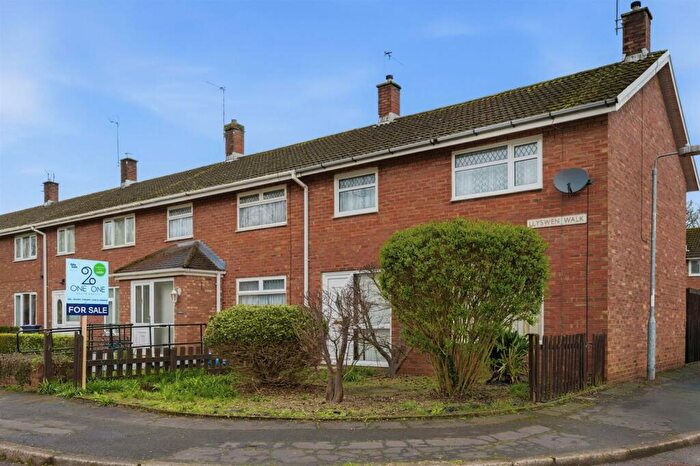
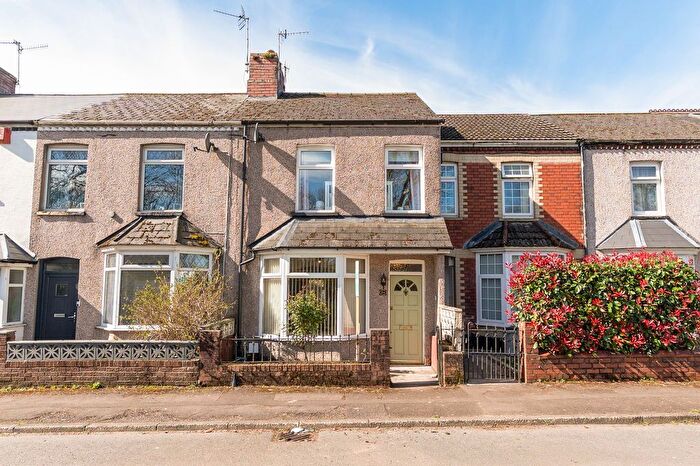
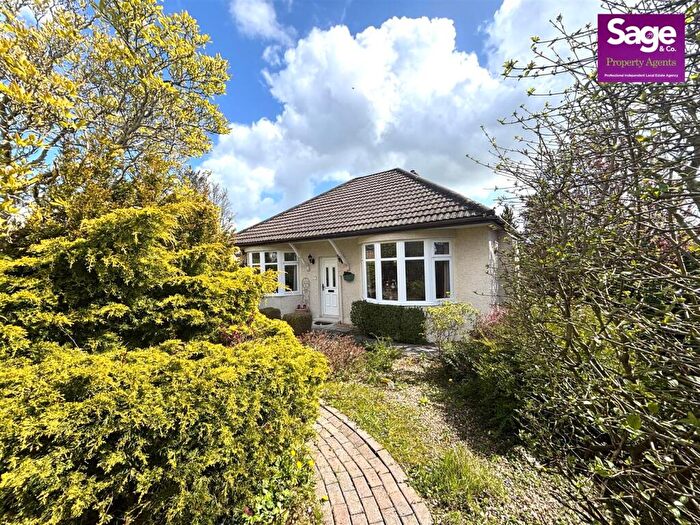
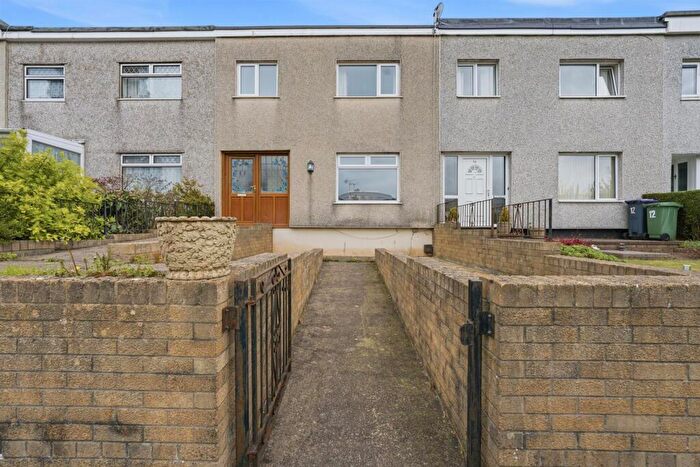
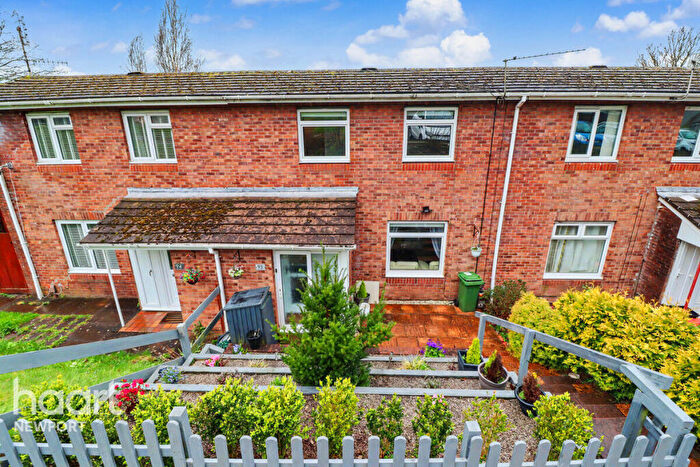
Properties for sale in Llantarnam
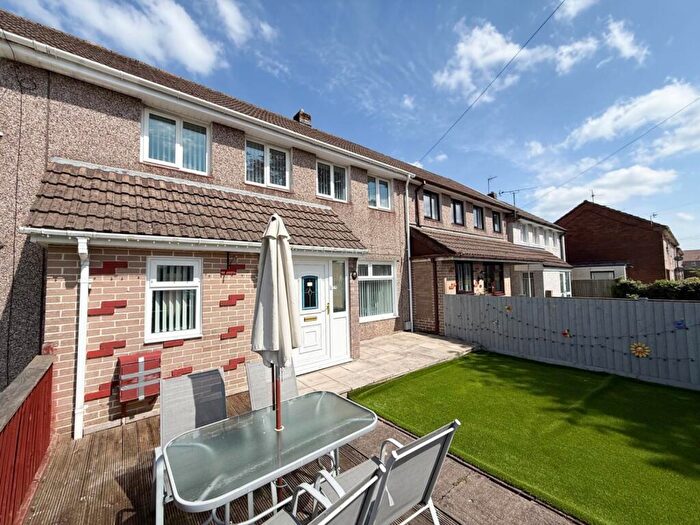
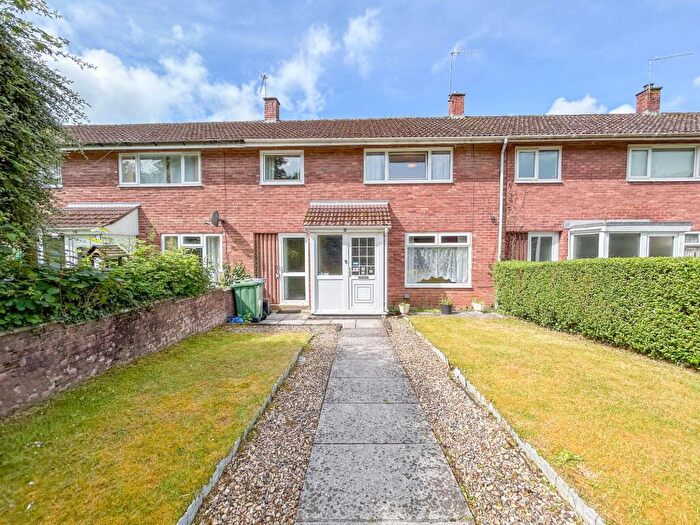
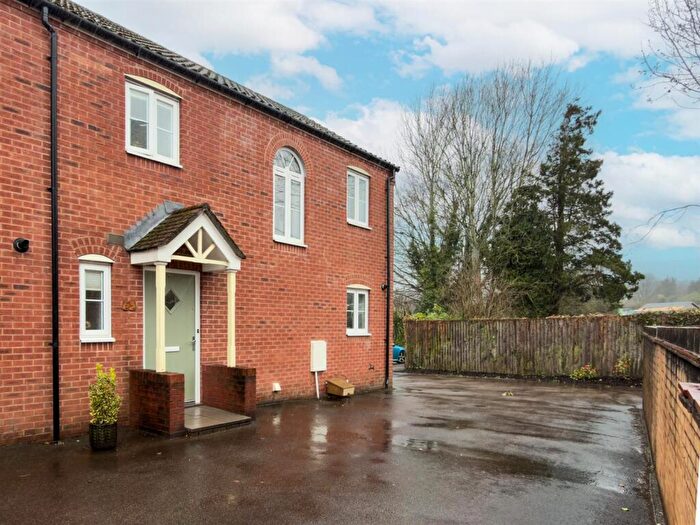
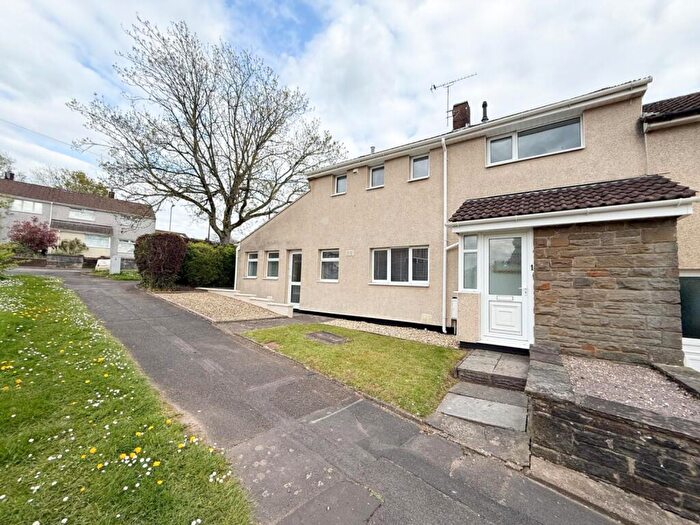
![]()
If you are looking to sell your house, let it out, or receive a property valuation, an expert can help you.
Click the button below to get started.


Roads and Postcodes in Llantarnam
Navigate through our locations to find the location of your next house in Llantarnam, Cwmbran for sale or to rent.
Transport near Llantarnam
-
 Cwmbran Station
 -
Newport (Gwent) Station
-
Pontypool and New Inn Station
-
Rogerstone Station
-
Risca and Pontymister Station
-
Pye Corner Station
-
Crosskeys Station
- FAQ
- Price Paid By Year
- Property Type Price
Frequently asked questions about Llantarnam
What is the average price for a property for sale in Llantarnam?
The average price for a property for sale in Llantarnam is £255,192. This amount is 17% higher than the average price in Cwmbran. There are 2,113 property listings for sale in Llantarnam.
What streets have the most expensive properties for sale in Llantarnam?
The streets with the most expensive properties for sale in Llantarnam are Llantarnam Industrial Park at an average of £698,880, The Manor at an average of £560,000 and Pentre Lane at an average of £548,000.
What streets have the most affordable properties for sale in Llantarnam?
The streets with the most affordable properties for sale in Llantarnam are The Tower at an average of £62,475, Trelech Close at an average of £105,000 and Brangwyn Avenue at an average of £120,000.
Which train stations are available in or near Llantarnam?
Some of the train stations available in or near Llantarnam are Cwmbran, Newport (Gwent) and Pontypool and New Inn.
Property Price Paid in Llantarnam by Year
The average sold property price by year was:
| Year | Average Sold Price | Price Change |
Sold Properties
|
|---|---|---|---|
| 2025 | £244,781 | -7% |
76 Properties |
| 2024 | £263,090 | 3% |
92 Properties |
| 2023 | £256,000 | 1% |
80 Properties |
| 2022 | £252,782 | 2% |
102 Properties |
| 2021 | £248,555 | 12% |
127 Properties |
| 2020 | £218,610 | -9% |
107 Properties |
| 2019 | £239,275 | 9% |
187 Properties |
| 2018 | £218,684 | 14% |
203 Properties |
| 2017 | £188,684 | 12% |
121 Properties |
| 2016 | £165,867 | -16% |
92 Properties |
| 2015 | £192,982 | 21% |
115 Properties |
| 2014 | £152,796 | 1% |
110 Properties |
| 2013 | £151,832 | -13% |
76 Properties |
| 2012 | £171,470 | - |
55 Properties |
| 2011 | £171,511 | 1% |
59 Properties |
| 2010 | £170,445 | -4% |
101 Properties |
| 2009 | £177,962 | 3% |
73 Properties |
| 2008 | £172,669 | -4% |
55 Properties |
| 2007 | £180,146 | 17% |
102 Properties |
| 2006 | £149,985 | -5% |
85 Properties |
| 2005 | £157,240 | -22% |
71 Properties |
| 2004 | £192,162 | 13% |
95 Properties |
| 2003 | £166,495 | 47% |
140 Properties |
| 2002 | £87,832 | 18% |
114 Properties |
| 2001 | £71,695 | -16% |
58 Properties |
| 2000 | £83,213 | 22% |
78 Properties |
| 1999 | £64,857 | -9% |
71 Properties |
| 1998 | £70,854 | -1% |
81 Properties |
| 1997 | £71,825 | 22% |
91 Properties |
| 1996 | £56,089 | 14% |
54 Properties |
| 1995 | £48,187 | - |
29 Properties |
Property Price per Property Type in Llantarnam
Here you can find historic sold price data in order to help with your property search.
The average Property Paid Price for specific property types in the last three years are:
| Property Type | Average Sold Price | Sold Properties |
|---|---|---|
| Flat | £100,663.00 | 15 Flats |
| Semi Detached House | £244,860.00 | 64 Semi Detached Houses |
| Detached House | £388,426.00 | 76 Detached Houses |
| Terraced House | £178,348.00 | 93 Terraced Houses |