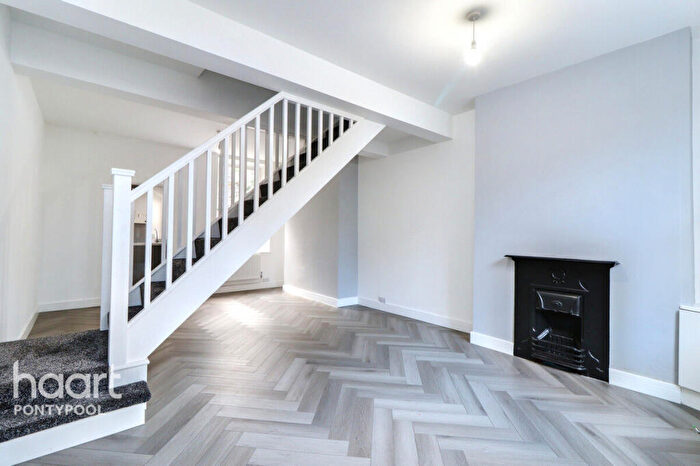
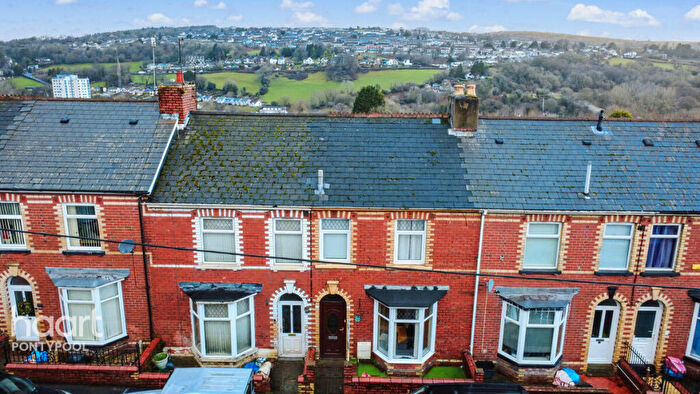
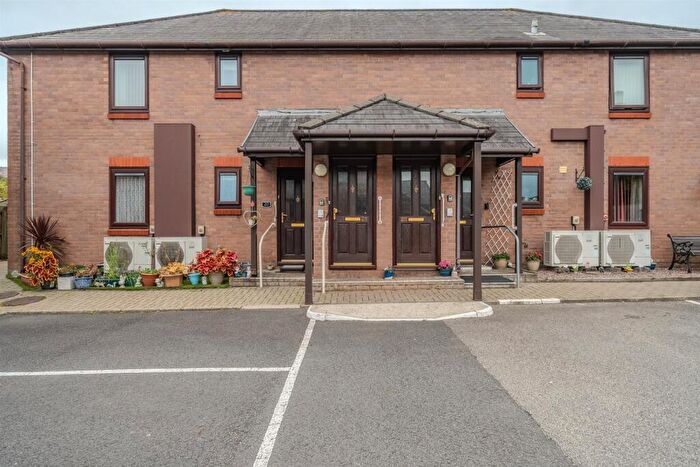
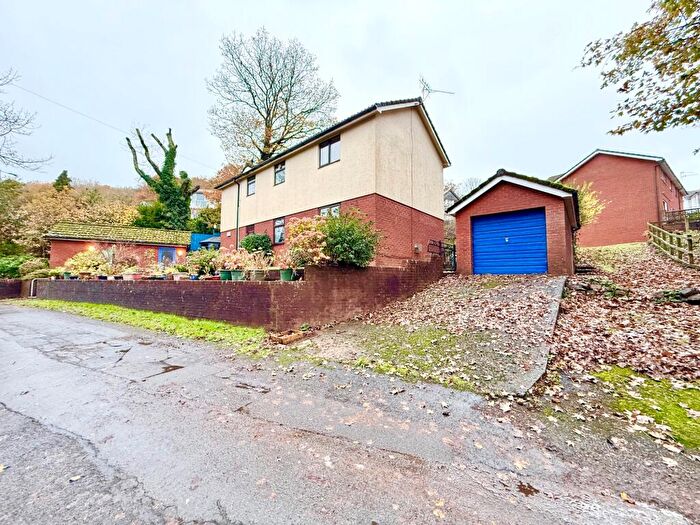
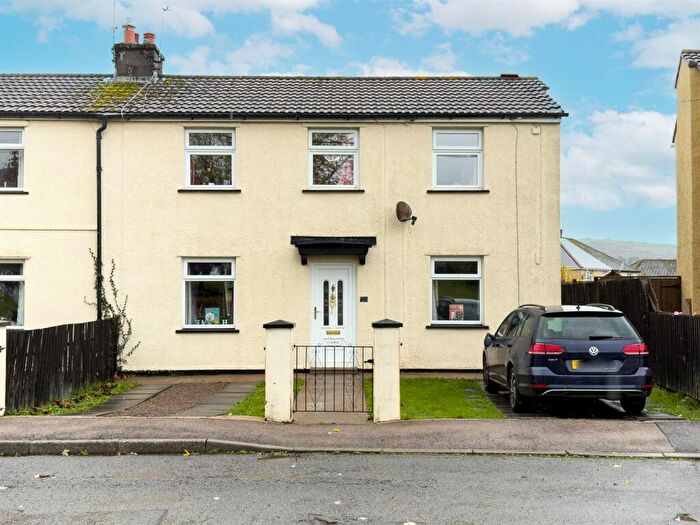
Houses for sale & to rent in Pontypool, Pontypool
House Prices in Pontypool
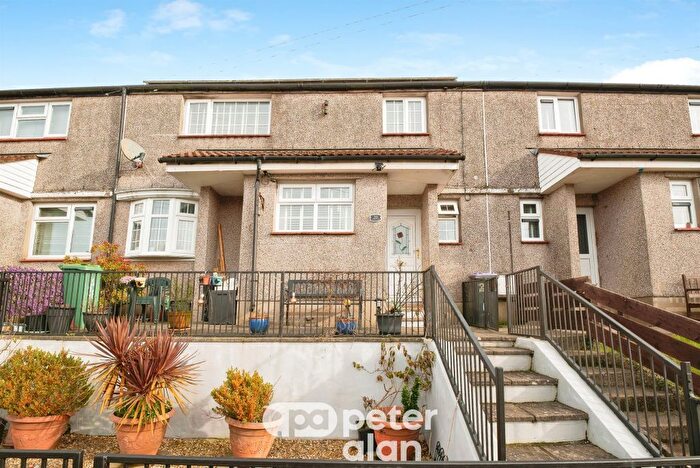
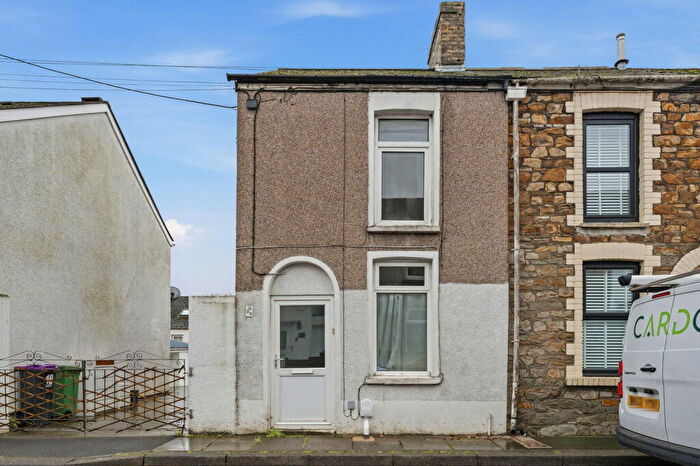
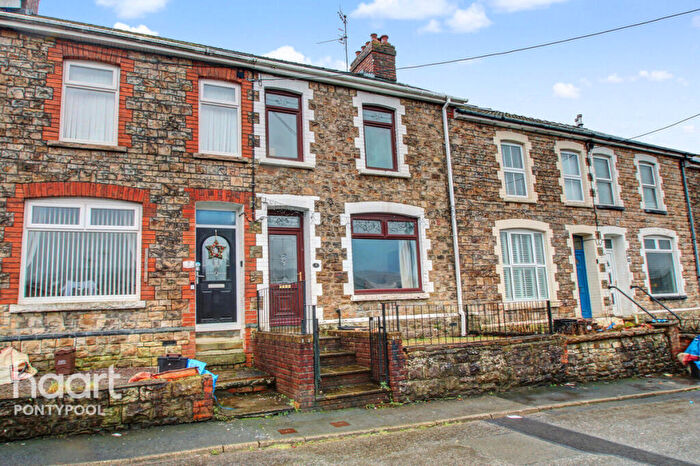
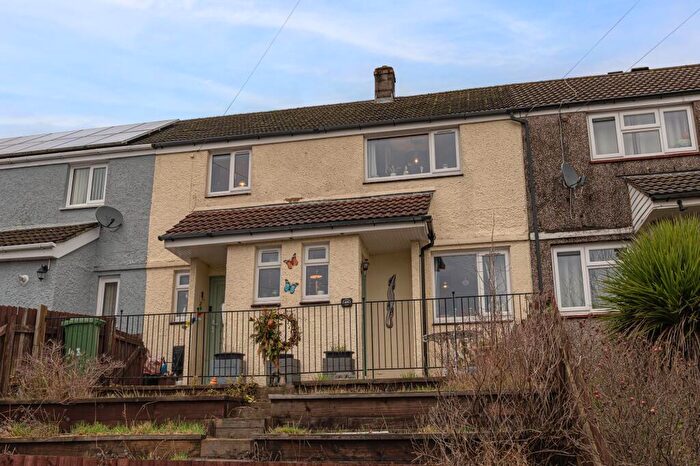
Properties in Pontypool have an average house price of £154,445.00 and had 70 Property Transactions within the last 3 years¹.
Pontypool is an area in Pontypool, Tor-faen - Torfaen with 807 households², where the most expensive property was sold for £355,000.00.
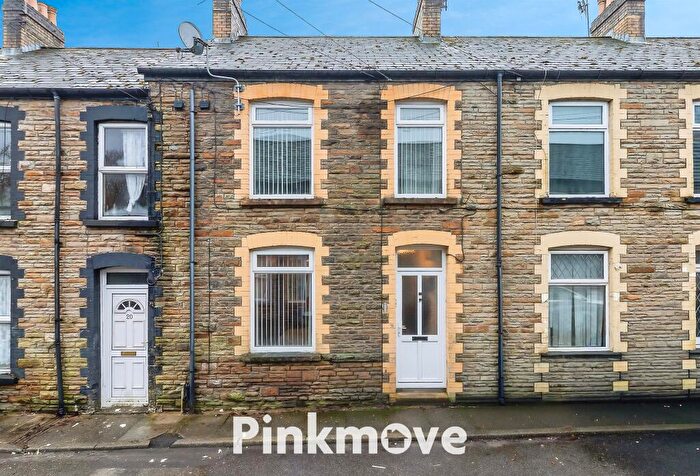
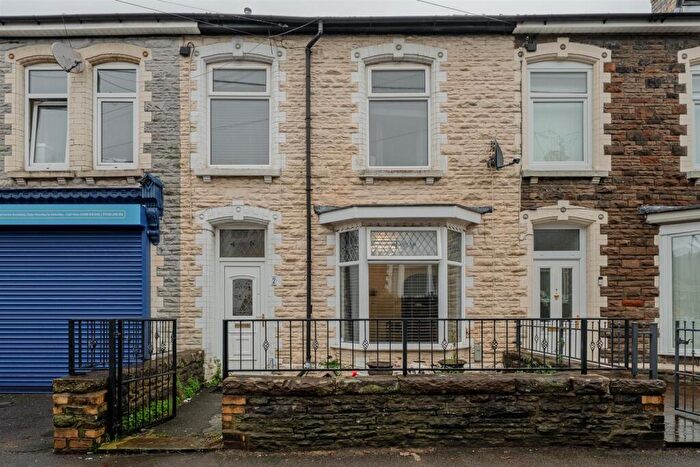
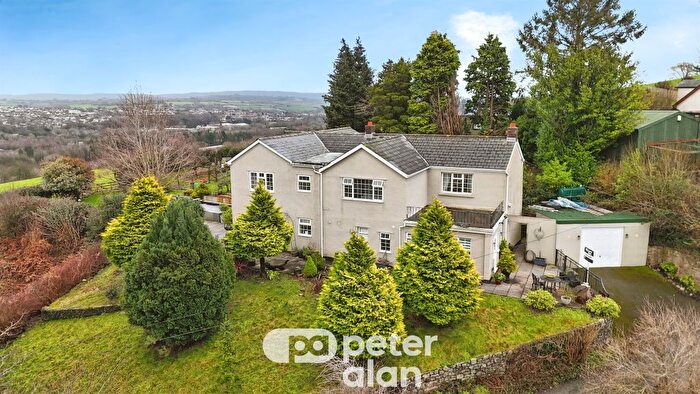
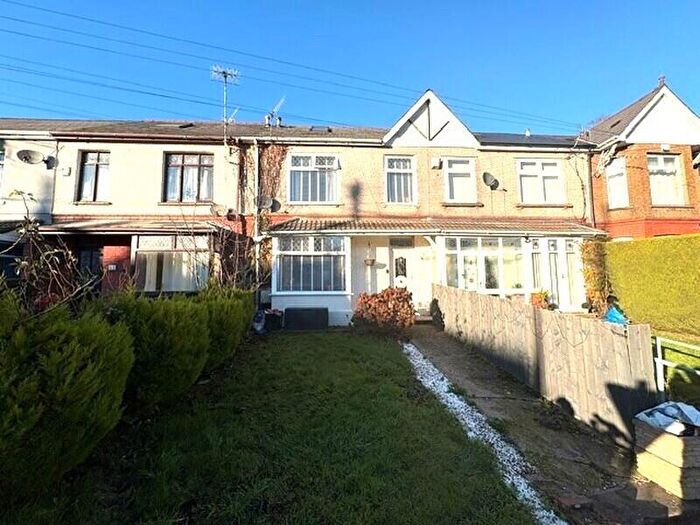
Properties for sale in Pontypool
Roads and Postcodes in Pontypool
Navigate through our locations to find the location of your next house in Pontypool, Pontypool for sale or to rent.
| Streets | Postcodes |
|---|---|
| Alton Terrace | NP4 6LS |
| Castle Mews | NP4 6BU |
| Clarence Place | NP4 8AP |
| Clarence Road | NP4 8AY NP4 8AZ |
| Clarence Street | NP4 6LG NP4 6EW NP4 6LQ NP4 6XP |
| Clos Afon Llwyd | NP4 6DA |
| Commercial Street | NP4 6JQ NP4 6JJ NP4 6JS NP4 6XT NP4 6XU |
| Crane Street | NP4 6LY NP4 6NA NP4 6ND |
| Daisy View | NP4 5JX |
| Davis Close | NP4 6GP |
| Forge Lane | NP4 6JG |
| Forge Place | NP4 6JD |
| Fountain Road | NP4 8ER NP4 8HU NP4 8ET |
| George Street | NP4 6BY NP4 6BZ NP4 6LR |
| Glantorvaen Road | NP4 6YN |
| Hanbury Road | NP4 6JL NP4 6LL NP4 6XY NP4 6YE |
| Lower Bridge Street | NP4 6JU |
| Lower Market Arcade | NP4 6NB |
| Lower Mill Field | NP4 0RH NP4 0XJ |
| Lower Park Gardens | NP4 8DF |
| Maes Y Celyn | NP4 5DG |
| Maesderwen Crescent | NP4 5LD |
| Maesderwen Rise | NP4 5SS |
| Maesderwen Road | NP4 5LF NP4 5LE NP4 5LH |
| Malthouse Lane | NP4 6NQ |
| Market Arcade | NP4 6NH |
| Market Street | NP4 6JN |
| Mervyn Terrace | NP4 6NW |
| Michael Court | NP4 6GT |
| Michael Way | NP4 6GS |
| Old Bailey | NP4 8EU |
| Old Estate Yard | NP4 8ES |
| Osborne Road | NP4 6LT NP4 6LU NP4 6LX NP4 6LZ NP4 6NN NP4 6XA NP4 6ZW |
| Park Court | NP4 8DE |
| Park Gardens | NP4 8DB |
| Park Road | NP4 6JF NP4 8BH NP4 6JE NP4 6JH NP4 6NZ NP4 6XG NP4 6XQ |
| Park View | NP4 5JT |
| Penygraig Terrace | NP4 5JS |
| Riverside Court | NP4 6JB |
| Rockhill Road | NP4 8AN NP4 8AR |
| School View | NP4 5LB |
| St Davids Close | NP4 8BA |
| St James Field | NP4 6JT |
| St Matthews Road | NP4 5JY |
| Stafford Road | NP4 5LG |
| The Grove | NP4 6JR |
| The Market Hall | NP4 6JW |
| The Moorings | NP4 5NB |
| Trosnant Street | NP4 8AT |
| Upper Trosnant Street | NP4 8AU |
| Victoria Road | NP4 5JU |
| NP4 6LW NP4 8BJ NP4 0RF NP4 0XB NP4 4SA NP4 4ZZ NP4 6DH NP4 6YB NP4 6ZE NP4 8BL |
Transport near Pontypool
- FAQ
- Price Paid By Year
- Property Type Price
Frequently asked questions about Pontypool
What is the average price for a property for sale in Pontypool?
The average price for a property for sale in Pontypool is £154,445. This amount is 15% lower than the average price in Pontypool. There are 527 property listings for sale in Pontypool.
What streets have the most expensive properties for sale in Pontypool?
The streets with the most expensive properties for sale in Pontypool are Clarence Place at an average of £285,000, Fountain Road at an average of £244,000 and St James Field at an average of £219,166.
What streets have the most affordable properties for sale in Pontypool?
The streets with the most affordable properties for sale in Pontypool are Crane Street at an average of £47,000, George Street at an average of £77,666 and Commercial Street at an average of £86,500.
Which train stations are available in or near Pontypool?
Some of the train stations available in or near Pontypool are Pontypool and New Inn, Cwmbran and Llanhilleth.
Property Price Paid in Pontypool by Year
The average sold property price by year was:
| Year | Average Sold Price | Price Change |
Sold Properties
|
|---|---|---|---|
| 2025 | £160,295 | 6% |
11 Properties |
| 2024 | £150,895 | -3% |
31 Properties |
| 2023 | £156,077 | -30% |
28 Properties |
| 2022 | £203,567 | 17% |
40 Properties |
| 2021 | £169,791 | 10% |
24 Properties |
| 2020 | £153,193 | -9% |
23 Properties |
| 2019 | £167,324 | 17% |
29 Properties |
| 2018 | £138,422 | 7% |
34 Properties |
| 2017 | £128,693 | -9% |
31 Properties |
| 2016 | £139,950 | 27% |
16 Properties |
| 2015 | £101,658 | -12% |
17 Properties |
| 2014 | £114,205 | -10% |
17 Properties |
| 2013 | £125,885 | -5% |
19 Properties |
| 2012 | £131,860 | -3% |
15 Properties |
| 2011 | £136,051 | 19% |
15 Properties |
| 2010 | £110,770 | 8% |
15 Properties |
| 2009 | £102,157 | -10% |
19 Properties |
| 2008 | £112,305 | -18% |
36 Properties |
| 2007 | £132,513 | 11% |
56 Properties |
| 2006 | £118,388 | 16% |
46 Properties |
| 2005 | £99,158 | -8% |
37 Properties |
| 2004 | £106,997 | 21% |
34 Properties |
| 2003 | £84,627 | 24% |
42 Properties |
| 2002 | £63,983 | -0,3% |
79 Properties |
| 2001 | £64,171 | 6% |
41 Properties |
| 2000 | £60,615 | -10% |
34 Properties |
| 1999 | £66,639 | 34% |
44 Properties |
| 1998 | £44,216 | -16% |
21 Properties |
| 1997 | £51,357 | 28% |
21 Properties |
| 1996 | £36,757 | -11% |
25 Properties |
| 1995 | £40,919 | - |
25 Properties |
Property Price per Property Type in Pontypool
Here you can find historic sold price data in order to help with your property search.
The average Property Paid Price for specific property types in the last three years are:
| Property Type | Average Sold Price | Sold Properties |
|---|---|---|
| Semi Detached House | £208,305.00 | 18 Semi Detached Houses |
| Detached House | £247,500.00 | 5 Detached Houses |
| Terraced House | £134,058.00 | 41 Terraced Houses |
| Flat | £54,625.00 | 6 Flats |

