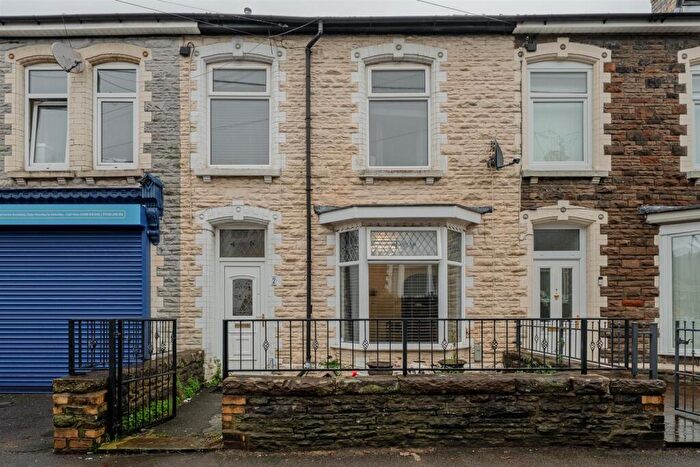
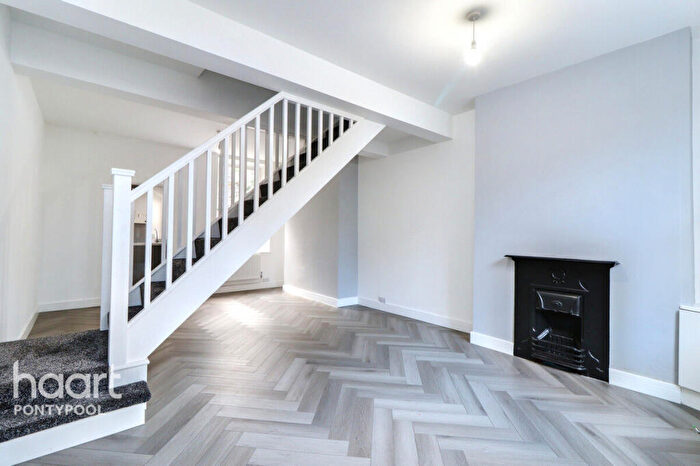
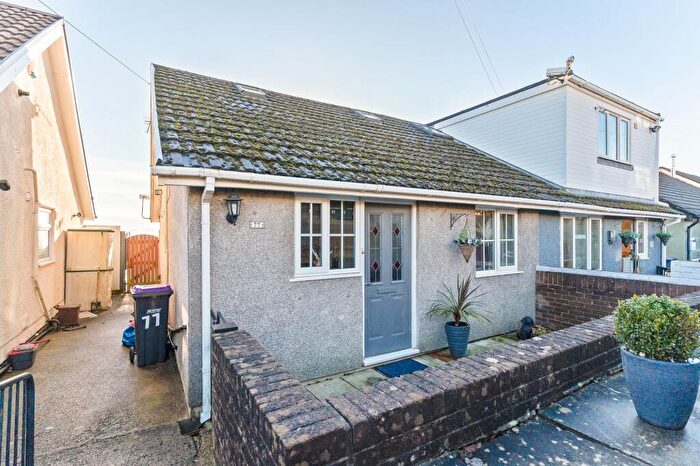
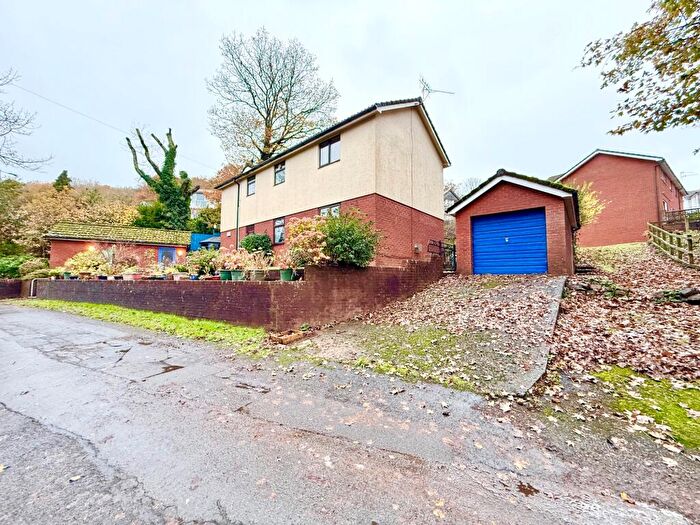
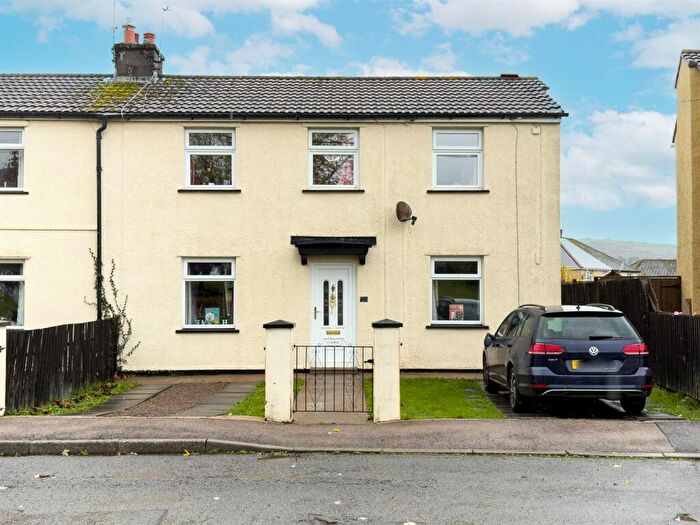
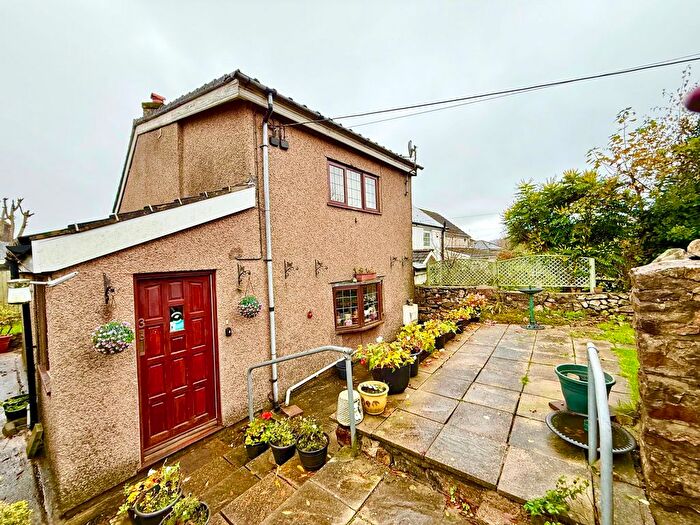
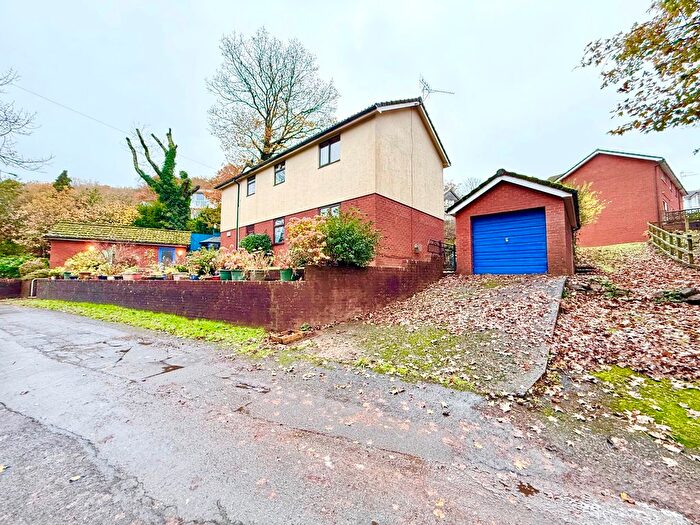
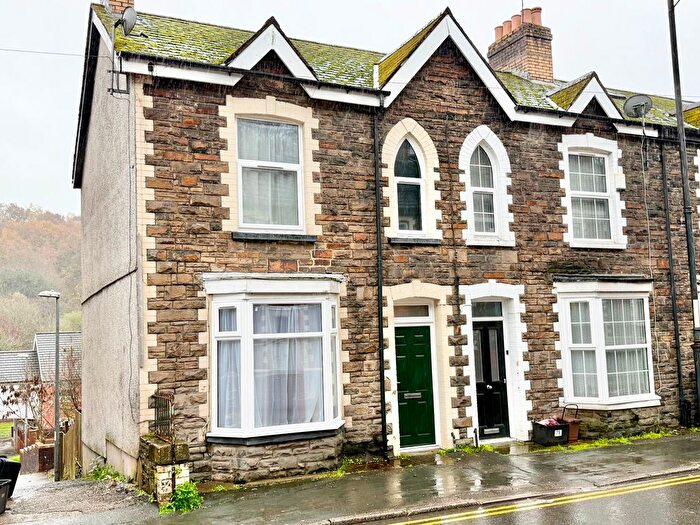
Houses for sale & to rent in St. Cadocs And Penygarn, Pontypool
House Prices in St. Cadocs And Penygarn
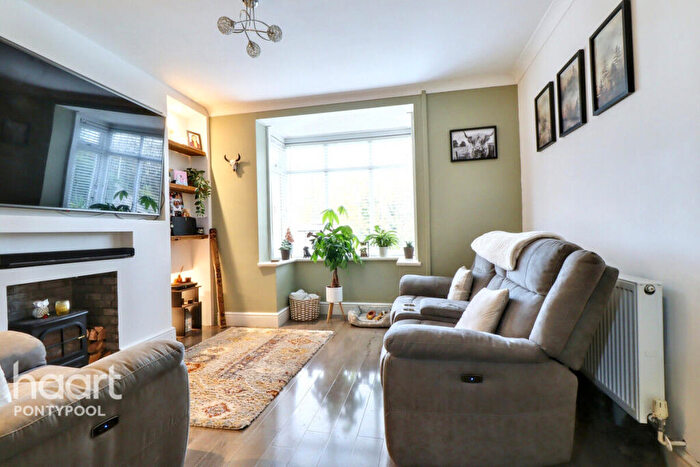
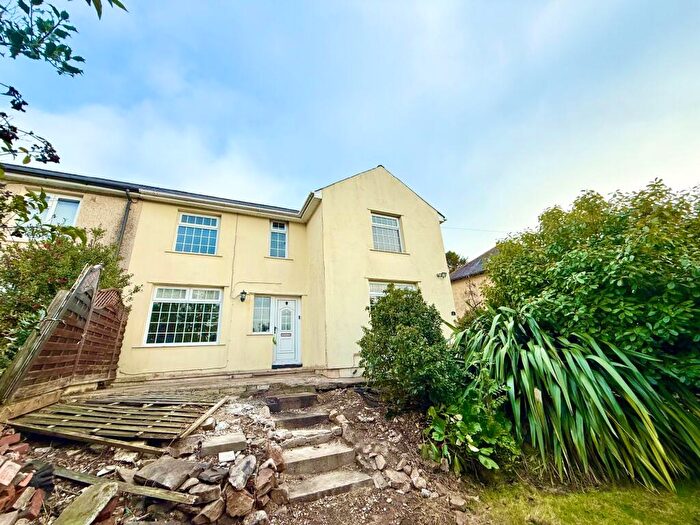
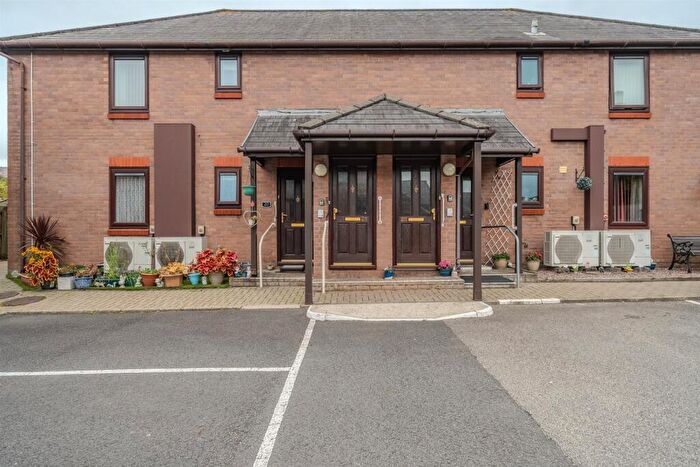
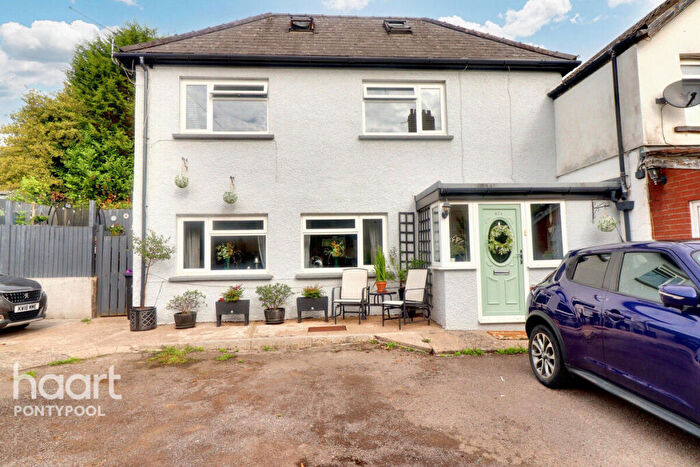
Properties in St. Cadocs And Penygarn have an average house price of £220,305.00 and had 35 Property Transactions within the last 3 years¹.
St. Cadocs And Penygarn is an area in Pontypool, Tor-faen - Torfaen with 607 households², where the most expensive property was sold for £450,000.00.
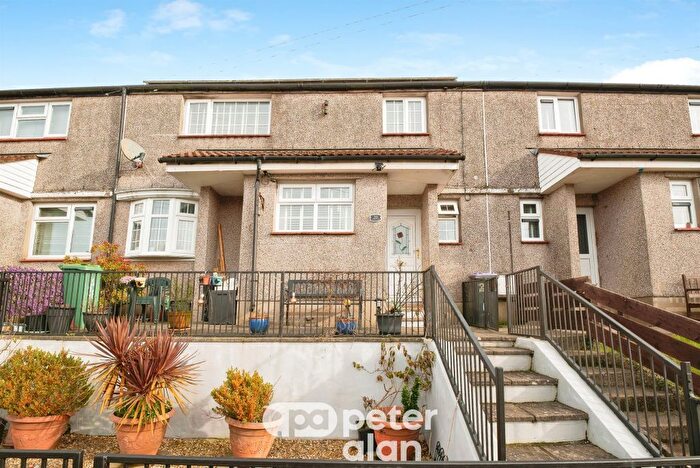
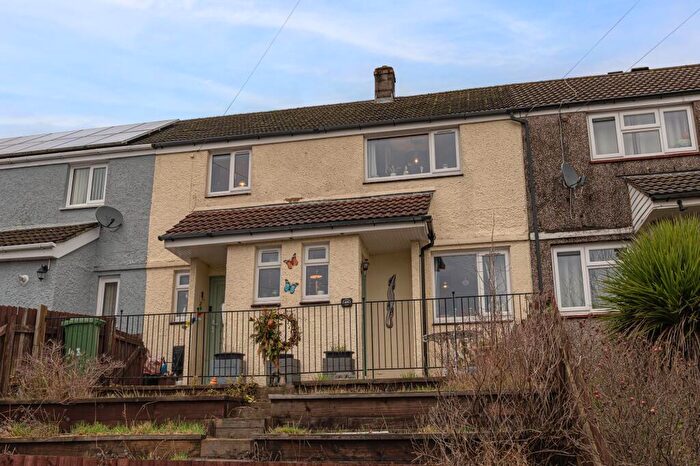
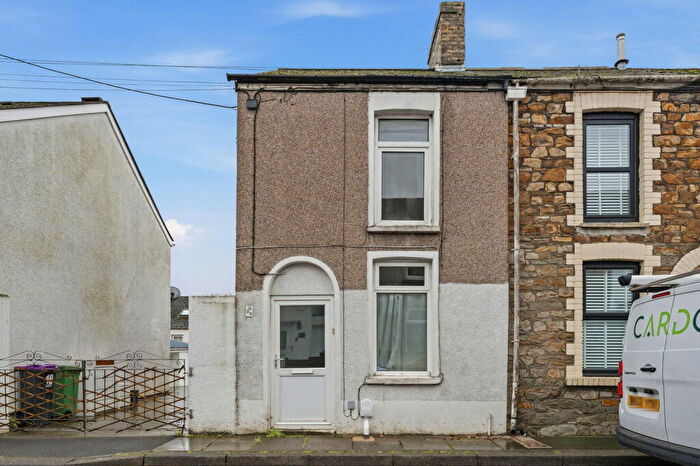
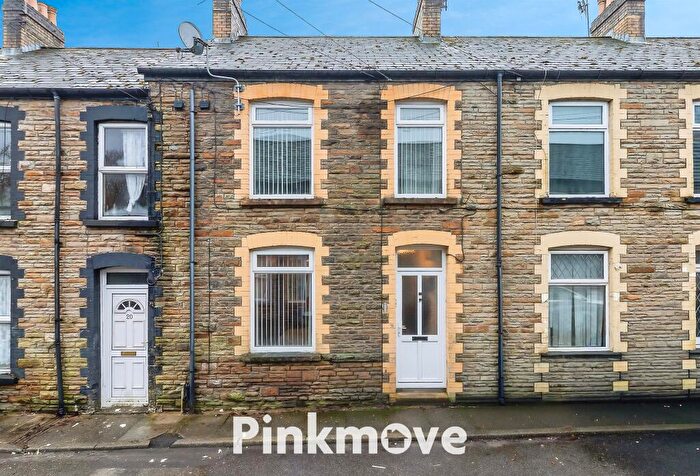
Properties for sale in St. Cadocs And Penygarn
Previously listed properties in St. Cadocs And Penygarn
Roads and Postcodes in St. Cadocs And Penygarn
Navigate through our locations to find the location of your next house in St. Cadocs And Penygarn, Pontypool for sale or to rent.
| Streets | Postcodes |
|---|---|
| Ash Grove | NP4 8JJ |
| Caerwent Road | NP4 8JL |
| Channel View | NP4 8BN NP4 8BP NP4 8BW |
| Chapel Walk | NP4 8AX |
| Church Lane | NP4 8HR |
| Churchwood | NP4 8DD |
| Churchwood Close | NP4 8BD |
| Clos Harry | NP4 8GA |
| College Road | NP4 8BX NP4 8DA |
| Folly View | NP4 8BU |
| James Street | NP4 8BY NP4 8BZ |
| John Jobbins Way | NP4 8EG |
| Mount Road | NP4 8JG NP4 8JQ |
| Park Crescent | NP4 8BR |
| Penybryn | NP4 8BB |
| Penygarn Road | NP4 8BG NP4 8BQ NP4 8JT NP4 8JA NP4 8JR |
| St Cadocs Road | NP4 8JN NP4 8JW |
| Tenison Road | NP4 8JP |
| The Ridgeway | NP4 8JH |
| The Woodlands | NP4 8BS NP4 8BT |
| NP4 8JS NP4 8JU NP4 8JX NP4 8TU |
Transport near St. Cadocs And Penygarn
- FAQ
- Price Paid By Year
- Property Type Price
Frequently asked questions about St. Cadocs And Penygarn
What is the average price for a property for sale in St. Cadocs And Penygarn?
The average price for a property for sale in St. Cadocs And Penygarn is £220,305. This amount is 21% higher than the average price in Pontypool. There are 448 property listings for sale in St. Cadocs And Penygarn.
What streets have the most expensive properties for sale in St. Cadocs And Penygarn?
The streets with the most expensive properties for sale in St. Cadocs And Penygarn are Clos Harry at an average of £365,000, Penygarn Road at an average of £303,000 and Chapel Walk at an average of £283,500.
What streets have the most affordable properties for sale in St. Cadocs And Penygarn?
The streets with the most affordable properties for sale in St. Cadocs And Penygarn are St Cadocs Road at an average of £155,000, James Street at an average of £161,000 and Park Crescent at an average of £195,000.
Which train stations are available in or near St. Cadocs And Penygarn?
Some of the train stations available in or near St. Cadocs And Penygarn are Pontypool and New Inn, Cwmbran and Llanhilleth.
Property Price Paid in St. Cadocs And Penygarn by Year
The average sold property price by year was:
| Year | Average Sold Price | Price Change |
Sold Properties
|
|---|---|---|---|
| 2025 | £221,863 | -1% |
11 Properties |
| 2024 | £223,927 | 4% |
11 Properties |
| 2023 | £215,923 | 3% |
13 Properties |
| 2022 | £209,771 | 9% |
14 Properties |
| 2021 | £190,018 | 8% |
19 Properties |
| 2020 | £174,185 | 23% |
21 Properties |
| 2019 | £134,257 | -27% |
21 Properties |
| 2018 | £170,173 | 0,1% |
26 Properties |
| 2017 | £170,044 | -7% |
43 Properties |
| 2016 | £181,670 | 5% |
55 Properties |
| 2015 | £172,474 | 6% |
46 Properties |
| 2014 | £162,629 | 38% |
19 Properties |
| 2013 | £101,000 | 19% |
12 Properties |
| 2012 | £81,500 | -29% |
8 Properties |
| 2011 | £104,892 | 11% |
12 Properties |
| 2010 | £93,741 | -1% |
6 Properties |
| 2009 | £94,800 | -42% |
10 Properties |
| 2008 | £134,618 | 17% |
8 Properties |
| 2007 | £111,311 | 0,4% |
25 Properties |
| 2006 | £110,902 | -34% |
13 Properties |
| 2005 | £148,400 | 39% |
10 Properties |
| 2004 | £89,900 | 23% |
7 Properties |
| 2003 | £69,620 | 21% |
14 Properties |
| 2002 | £55,029 | -42% |
14 Properties |
| 2001 | £78,056 | 26% |
15 Properties |
| 2000 | £57,379 | 14% |
12 Properties |
| 1999 | £49,444 | 20% |
9 Properties |
| 1998 | £39,600 | -13% |
5 Properties |
| 1997 | £44,733 | 21% |
9 Properties |
| 1996 | £35,500 | -47% |
8 Properties |
| 1995 | £52,332 | - |
6 Properties |
Property Price per Property Type in St. Cadocs And Penygarn
Here you can find historic sold price data in order to help with your property search.
The average Property Paid Price for specific property types in the last three years are:
| Property Type | Average Sold Price | Sold Properties |
|---|---|---|
| Semi Detached House | £195,477.00 | 22 Semi Detached Houses |
| Terraced House | £161,540.00 | 5 Terraced Houses |
| Detached House | £325,312.00 | 8 Detached Houses |

