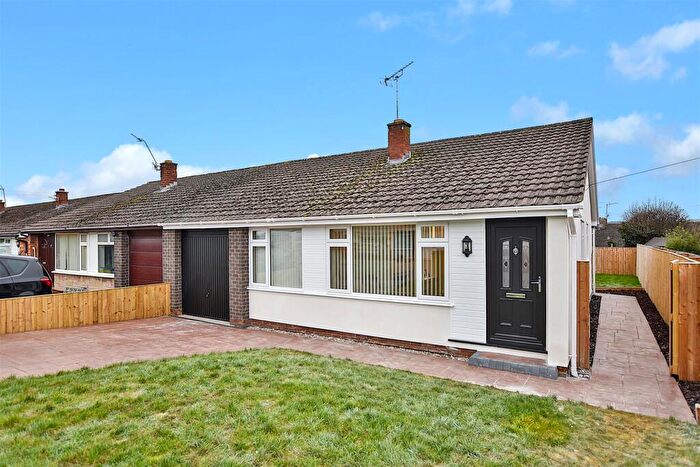
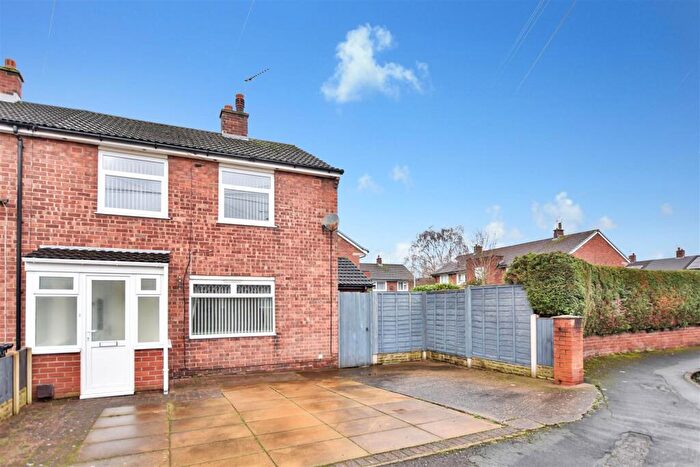
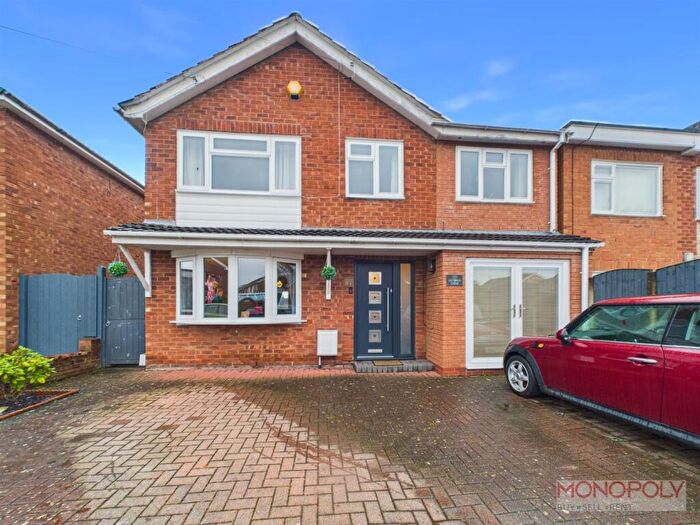
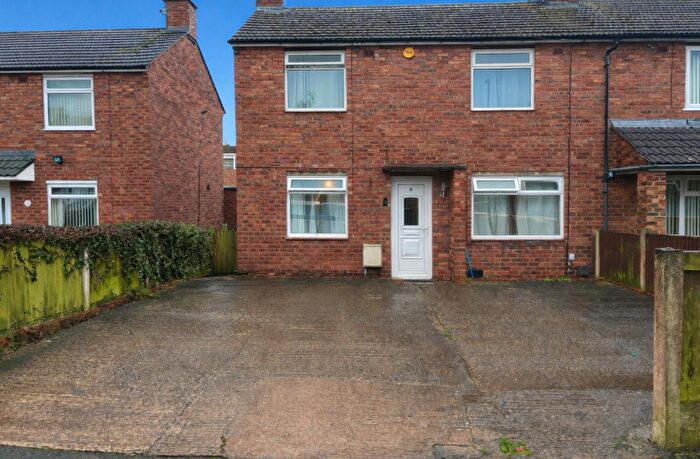
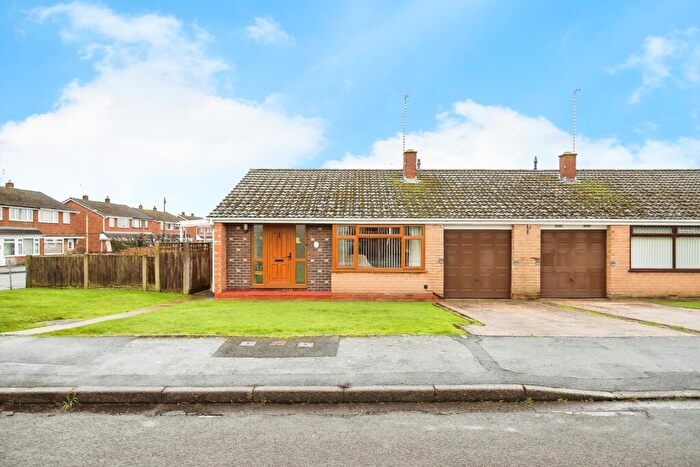
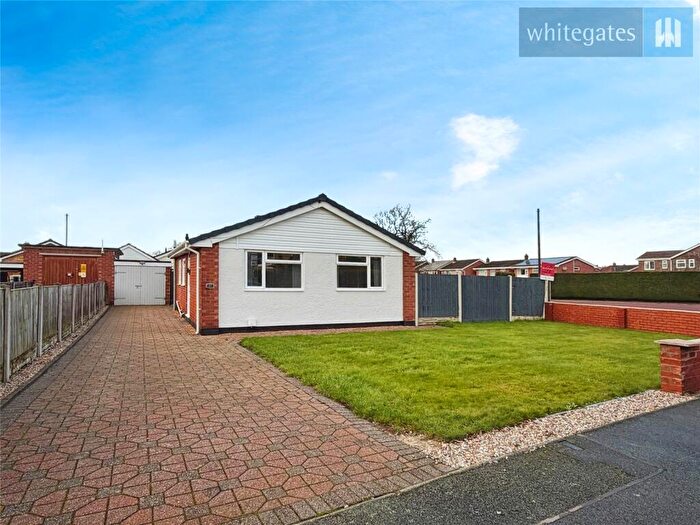
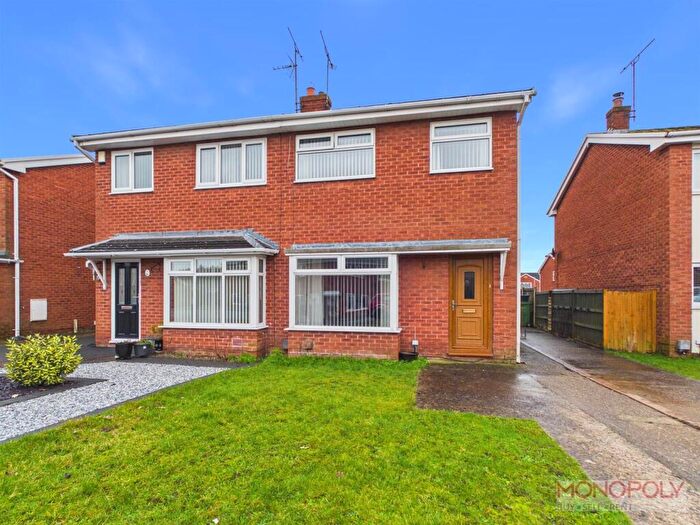
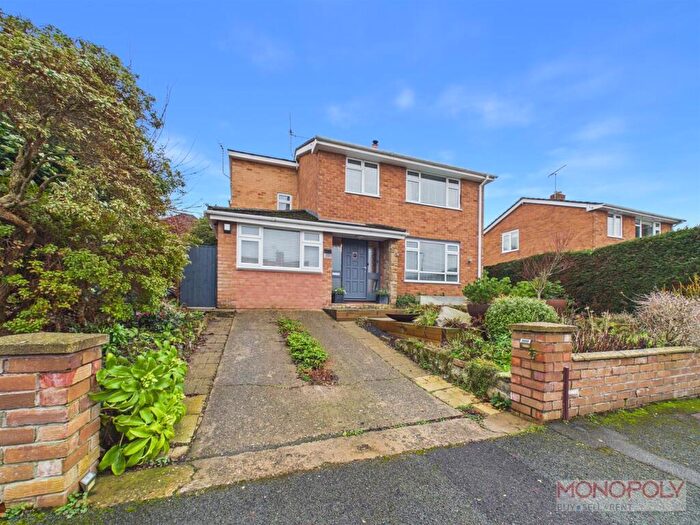
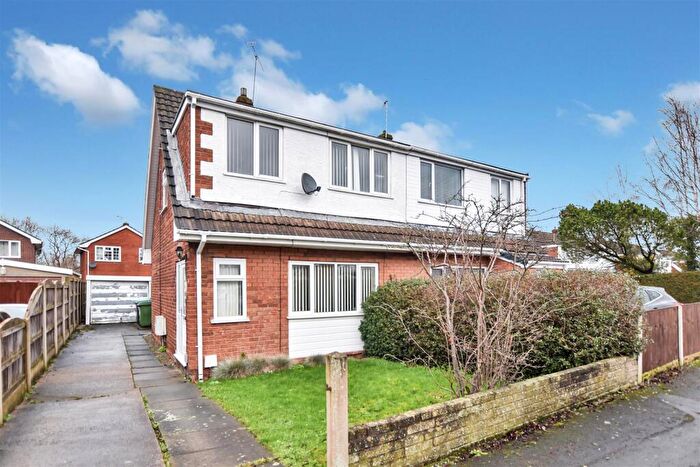
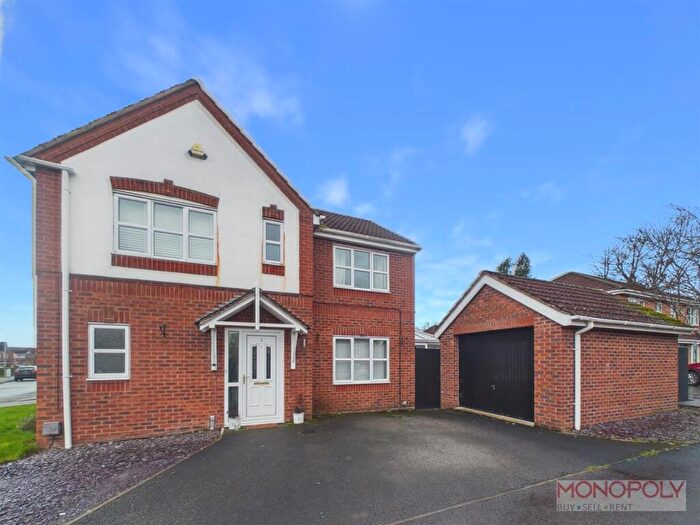
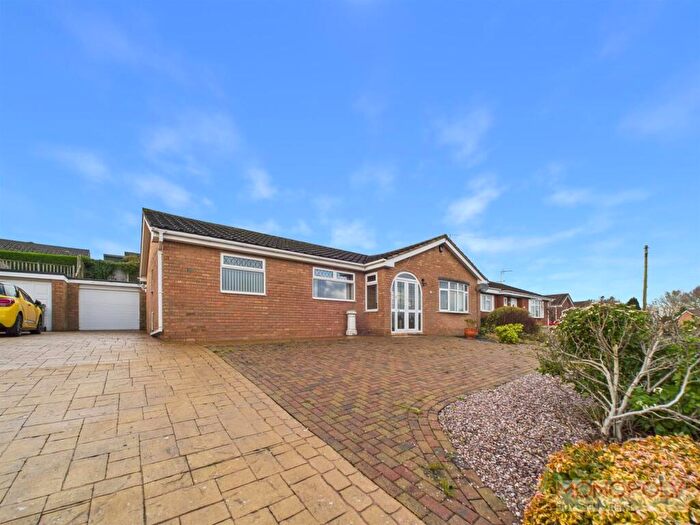
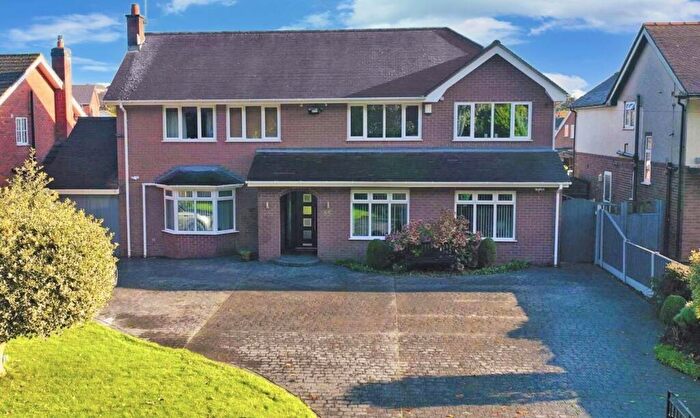
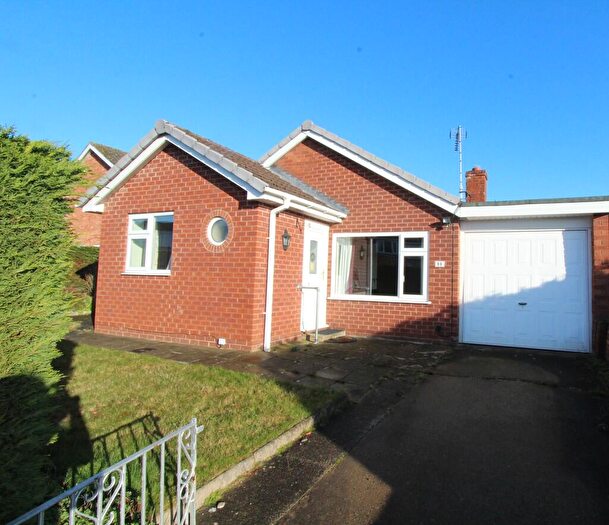
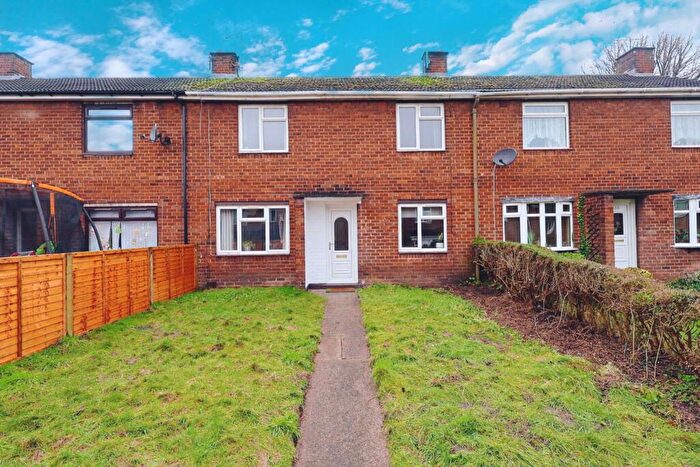
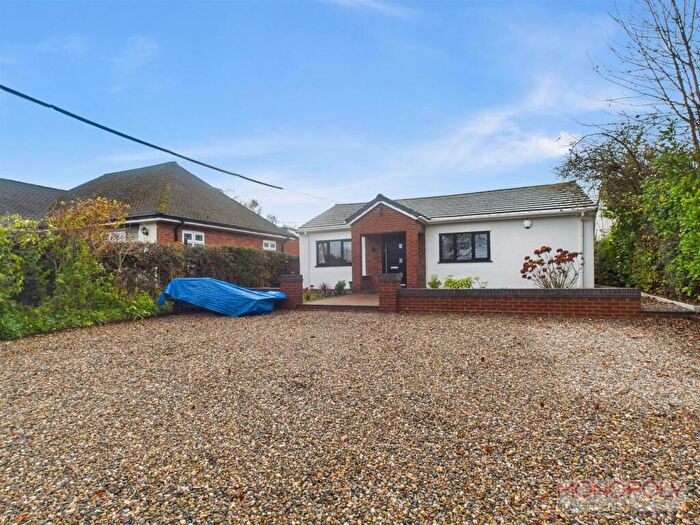
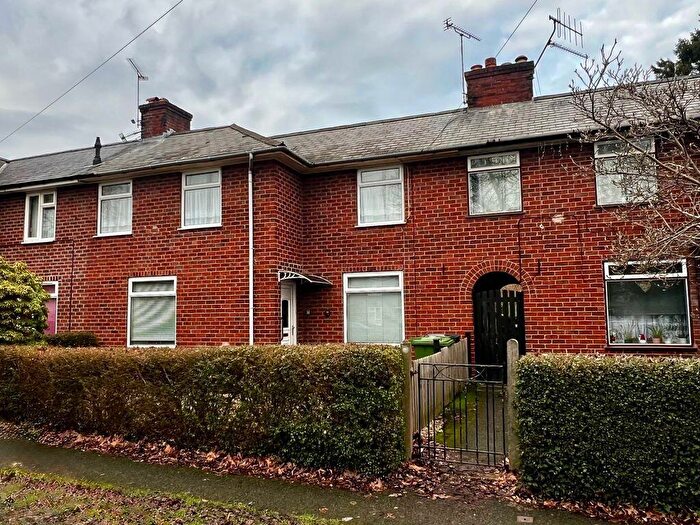
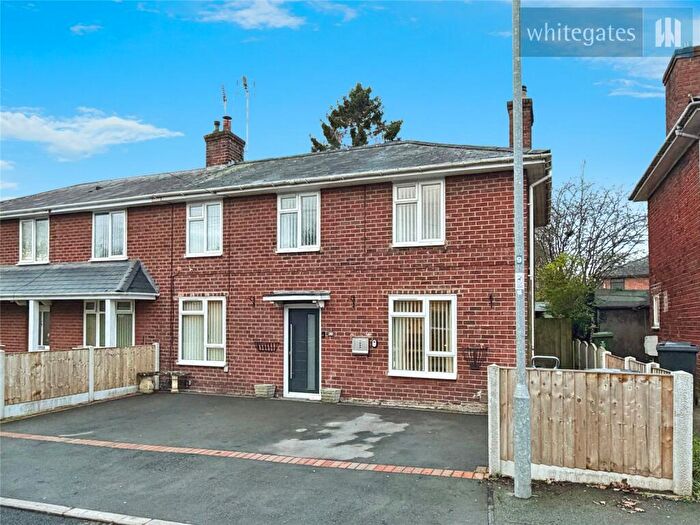
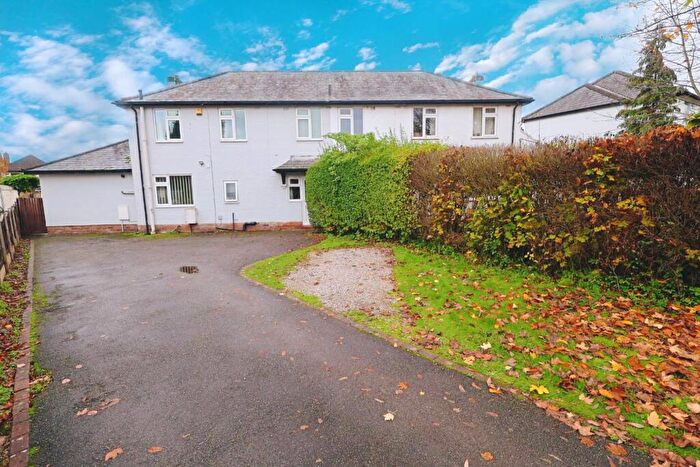
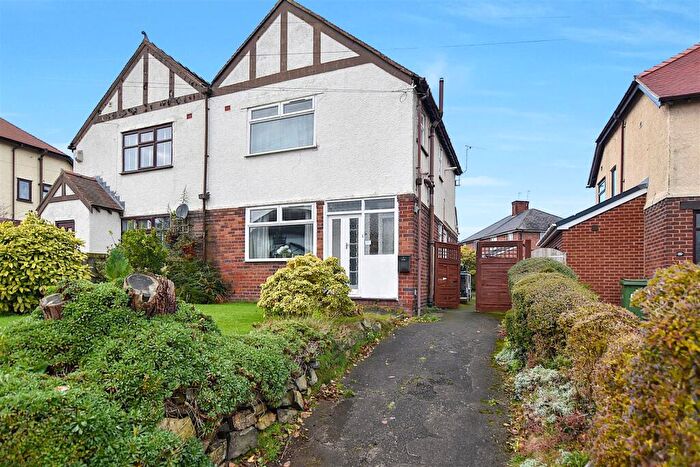
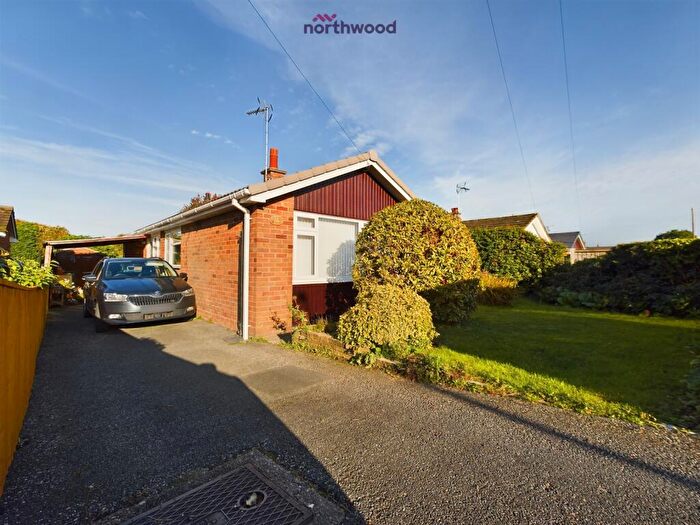
Houses for sale & to rent in Borras Park, Wrexham
House Prices in Borras Park
Properties in Borras Park have an average house price of £241,654.00 and had 87 Property Transactions within the last 3 years¹.
Borras Park is an area in Wrexham, Wrecsam - Wrexham with 1,048 households², where the most expensive property was sold for £450,000.00.
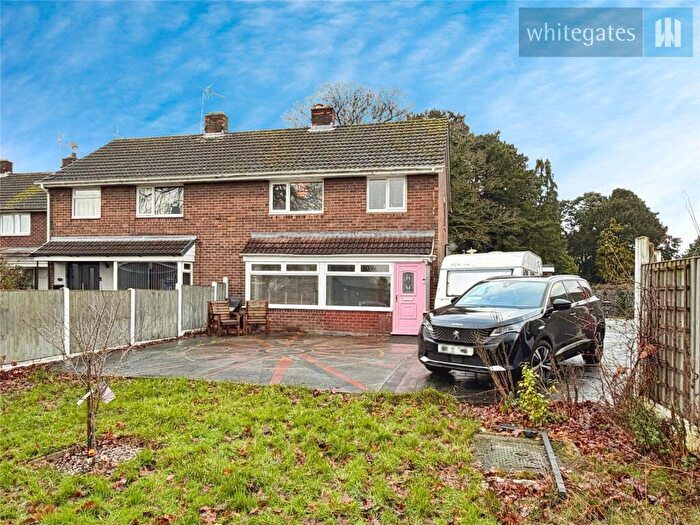
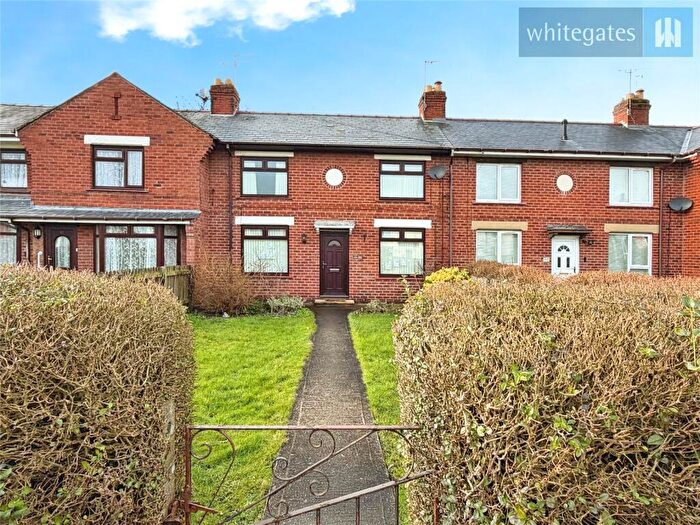
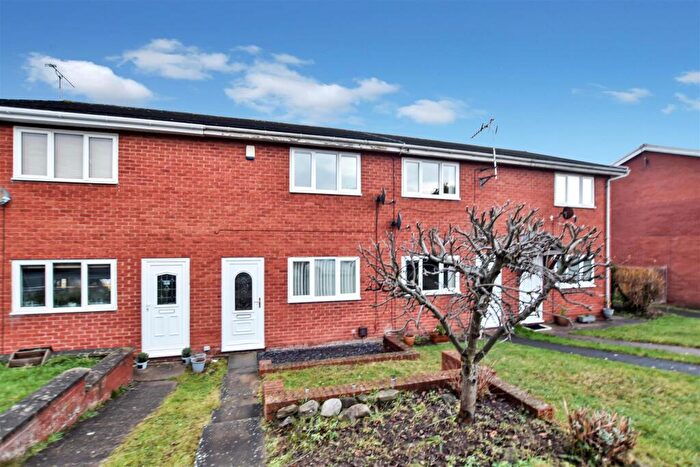
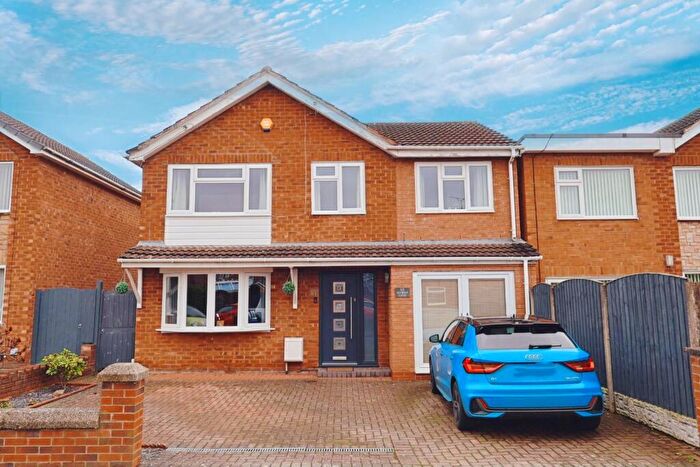
Properties for sale in Borras Park
Roads and Postcodes in Borras Park
Navigate through our locations to find the location of your next house in Borras Park, Wrexham for sale or to rent.
| Streets | Postcodes |
|---|---|
| Ainsdale Grove | LL12 7TJ |
| Avondale Grove | LL12 7TX |
| Barkers Lane | LL13 9UN |
| Bieston Close | LL13 9SZ |
| Borras Park Road | LL12 7TE LL12 7TF |
| Bryn Gryffydd | LL12 7SH |
| Cedar Close | LL12 7SP |
| Chelston Avenue | LL13 9TQ |
| Cherry Hill Drive | LL12 7TU |
| Clarke Road | LL12 7TY |
| Daleside Avenue | LL12 7TQ |
| Denning Road | LL12 7UG |
| Farmside | LL12 7SW |
| Fernham Drive | LL13 9TX |
| Ffordd Alafon | LL12 7SR |
| Ffordd Aled | LL12 7PP |
| Ffordd Alun | LL12 7PH |
| Ffordd Cynan | LL12 7SS LL12 7ST |
| Ffordd Madoc | LL12 7PS |
| Ffordd Pedrog | LL12 7PL |
| Ffordd Tegid | LL12 7PR |
| Ffordd Tegla | LL12 7PW |
| Ffordd Trefin | LL12 7PN |
| Firgrove Corner | LL12 7UF |
| Friars Close | LL12 7RA |
| Gainsborough Road | LL12 7UA |
| Greyfriars | LL12 7PY |
| Hilltopview Road | LL12 7SF |
| Huntsmans Corner | LL12 7UD LL12 7UE LL12 7UH |
| Jeffreys Road | LL12 7PB LL12 7PD LL12 7PE LL12 7PF |
| Juniper Close | LL12 7SN |
| Lake View | LL12 7SE |
| Larchwood Road | LL12 7SG |
| Lisburne Grove | LL13 9TJ |
| Lower Minster | LL12 7PT |
| Norfolk Road | LL12 7RP LL12 7RR LL12 7RS LL12 7RT LL12 7RU LL12 7RY LL12 7SA LL12 7SB LL12 7SD |
| North Wood | LL12 7SL |
| Philips Close | LL12 7RW |
| Ranscombe Crescent | LL13 9UX |
| Sherwell Avenue | LL13 9TZ |
| Townsend Avenue | LL12 7UB |
| Warrenwood Road | LL12 7RN |
| Wellswood Road | LL13 9UQ |
| White Friars | LL12 7PU |
| Yarwood Drive | LL13 9UJ |
Transport near Borras Park
- FAQ
- Price Paid By Year
- Property Type Price
Frequently asked questions about Borras Park
What is the average price for a property for sale in Borras Park?
The average price for a property for sale in Borras Park is £241,654. This amount is 17% higher than the average price in Wrexham. There are 247 property listings for sale in Borras Park.
What streets have the most expensive properties for sale in Borras Park?
The streets with the most expensive properties for sale in Borras Park are Bieston Close at an average of £362,500, Jeffreys Road at an average of £357,666 and Cedar Close at an average of £346,000.
What streets have the most affordable properties for sale in Borras Park?
The streets with the most affordable properties for sale in Borras Park are Warrenwood Road at an average of £170,000, Greyfriars at an average of £180,500 and North Wood at an average of £203,000.
Which train stations are available in or near Borras Park?
Some of the train stations available in or near Borras Park are Wrexham General, Wrexham Central and Gwersyllt.
Property Price Paid in Borras Park by Year
The average sold property price by year was:
| Year | Average Sold Price | Price Change |
Sold Properties
|
|---|---|---|---|
| 2025 | £254,597 | 13% |
20 Properties |
| 2024 | £222,737 | -17% |
40 Properties |
| 2023 | £260,092 | 4% |
27 Properties |
| 2022 | £248,931 | 9% |
29 Properties |
| 2021 | £226,132 | 9% |
45 Properties |
| 2020 | £205,539 | 10% |
24 Properties |
| 2019 | £184,672 | -3% |
37 Properties |
| 2018 | £189,509 | 2% |
36 Properties |
| 2017 | £185,597 | 9% |
40 Properties |
| 2016 | £168,312 | 6% |
32 Properties |
| 2015 | £158,998 | -7% |
26 Properties |
| 2014 | £169,946 | 2% |
38 Properties |
| 2013 | £165,714 | 7% |
14 Properties |
| 2012 | £154,740 | 0,2% |
27 Properties |
| 2011 | £154,497 | -16% |
22 Properties |
| 2010 | £178,637 | 11% |
28 Properties |
| 2009 | £159,157 | 3% |
19 Properties |
| 2008 | £154,406 | -17% |
16 Properties |
| 2007 | £181,240 | 6% |
27 Properties |
| 2006 | £170,297 | 11% |
39 Properties |
| 2005 | £151,108 | -8% |
35 Properties |
| 2004 | £163,099 | 22% |
48 Properties |
| 2003 | £128,010 | 7% |
33 Properties |
| 2002 | £118,770 | 26% |
36 Properties |
| 2001 | £87,896 | 14% |
47 Properties |
| 2000 | £75,627 | 7% |
48 Properties |
| 1999 | £70,057 | 3% |
41 Properties |
| 1998 | £68,080 | 4% |
40 Properties |
| 1997 | £65,556 | 8% |
59 Properties |
| 1996 | £60,195 | 2% |
31 Properties |
| 1995 | £59,260 | - |
41 Properties |
Property Price per Property Type in Borras Park
Here you can find historic sold price data in order to help with your property search.
The average Property Paid Price for specific property types in the last three years are:
| Property Type | Average Sold Price | Sold Properties |
|---|---|---|
| Semi Detached House | £218,877.00 | 41 Semi Detached Houses |
| Detached House | £265,617.00 | 42 Detached Houses |
| Terraced House | £223,500.00 | 4 Terraced Houses |

